The Beginner Trader's Roadmap (Free Guide)
You open a chart and it is a wall of red and green bars. Every video assumes you already know what a wick is, what the bars along the bottom mean, or why anyone cares where a line gets drawn. So you learn a rule, apply it, and it works once and then loses money twice, and nobody ever explains that the rule was fine and the market it was pointed at was not.
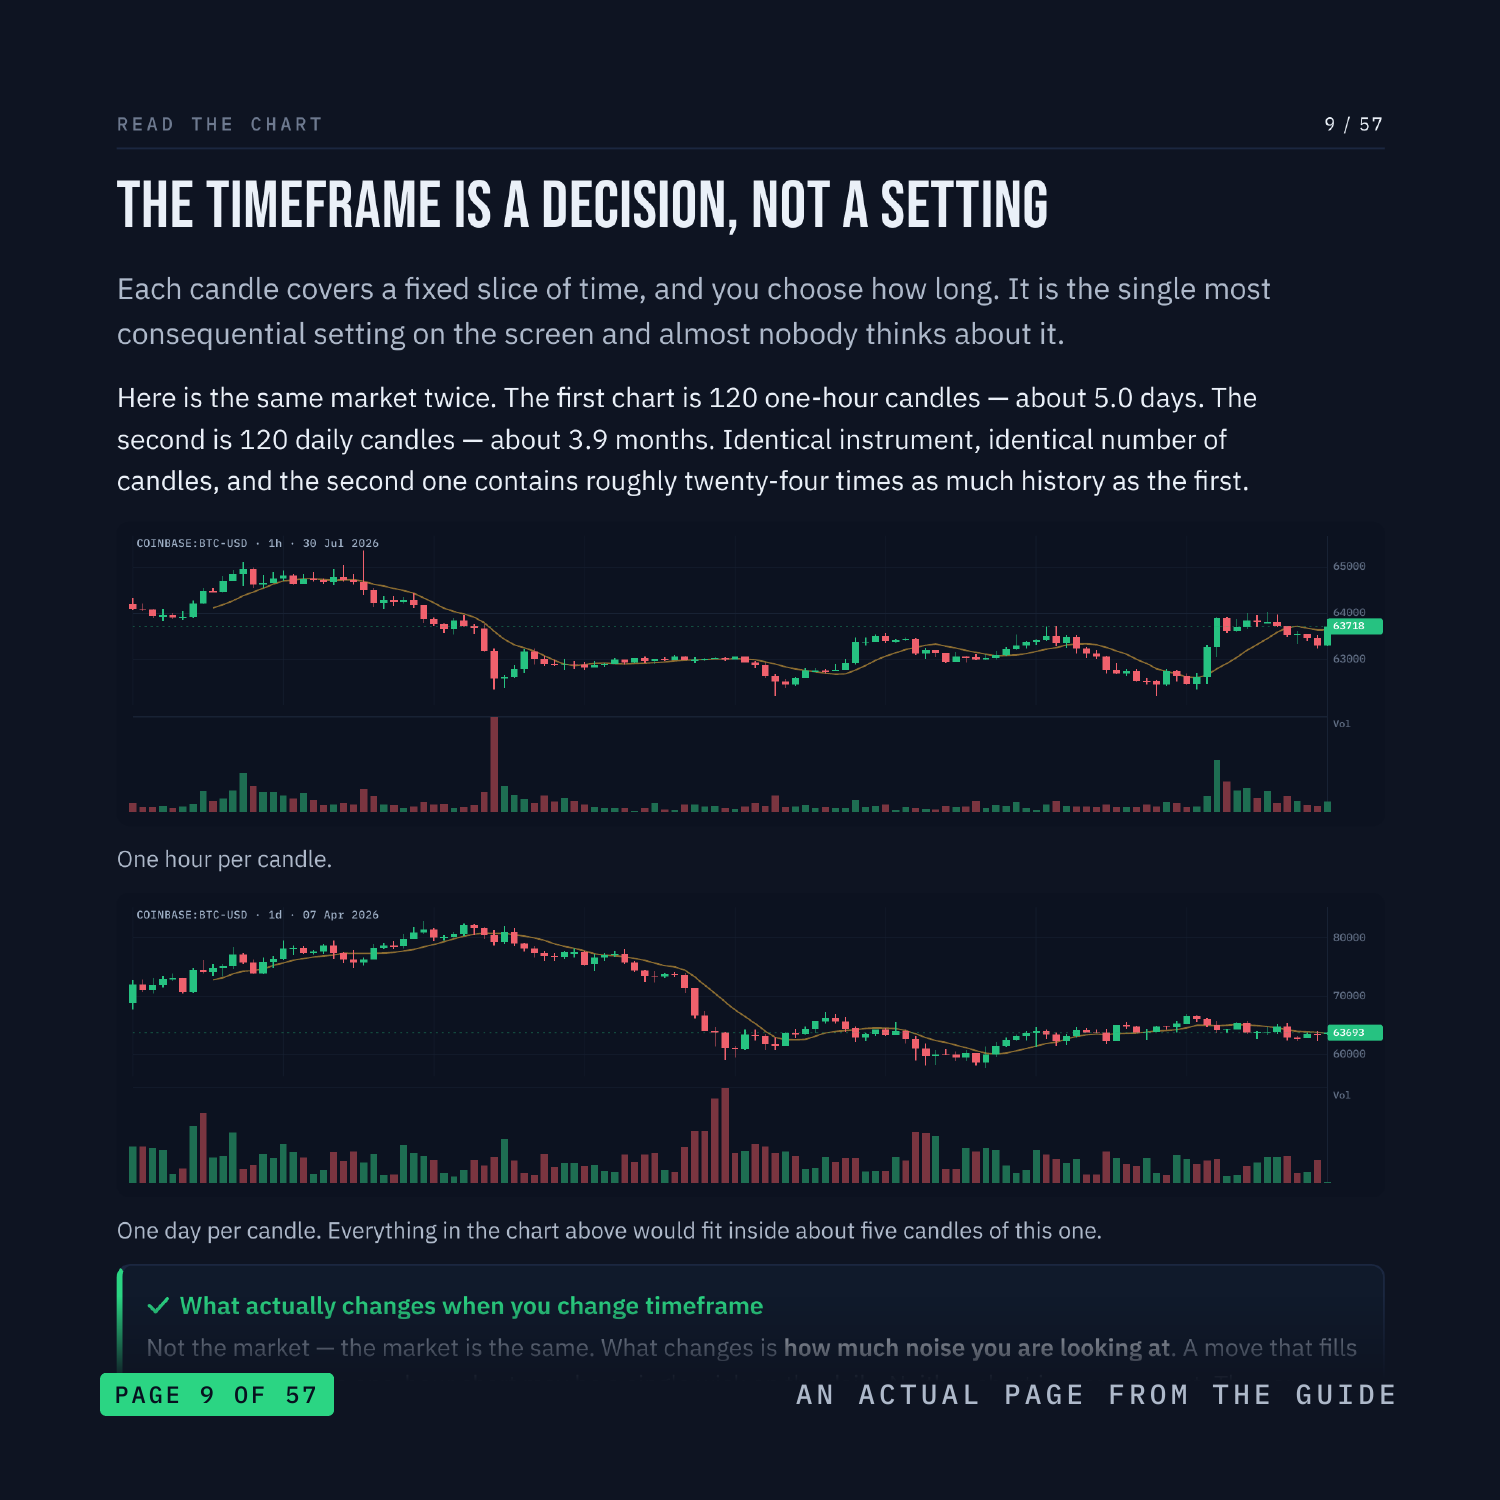
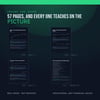
This starts at the very beginning: every single thing on the screen, named on the picture rather than in a paragraph underneath it. 57 pages, from the first thing you see on a chart through to a written trade plan with an entry, a stop and an explicit rule for when the trade is wrong.
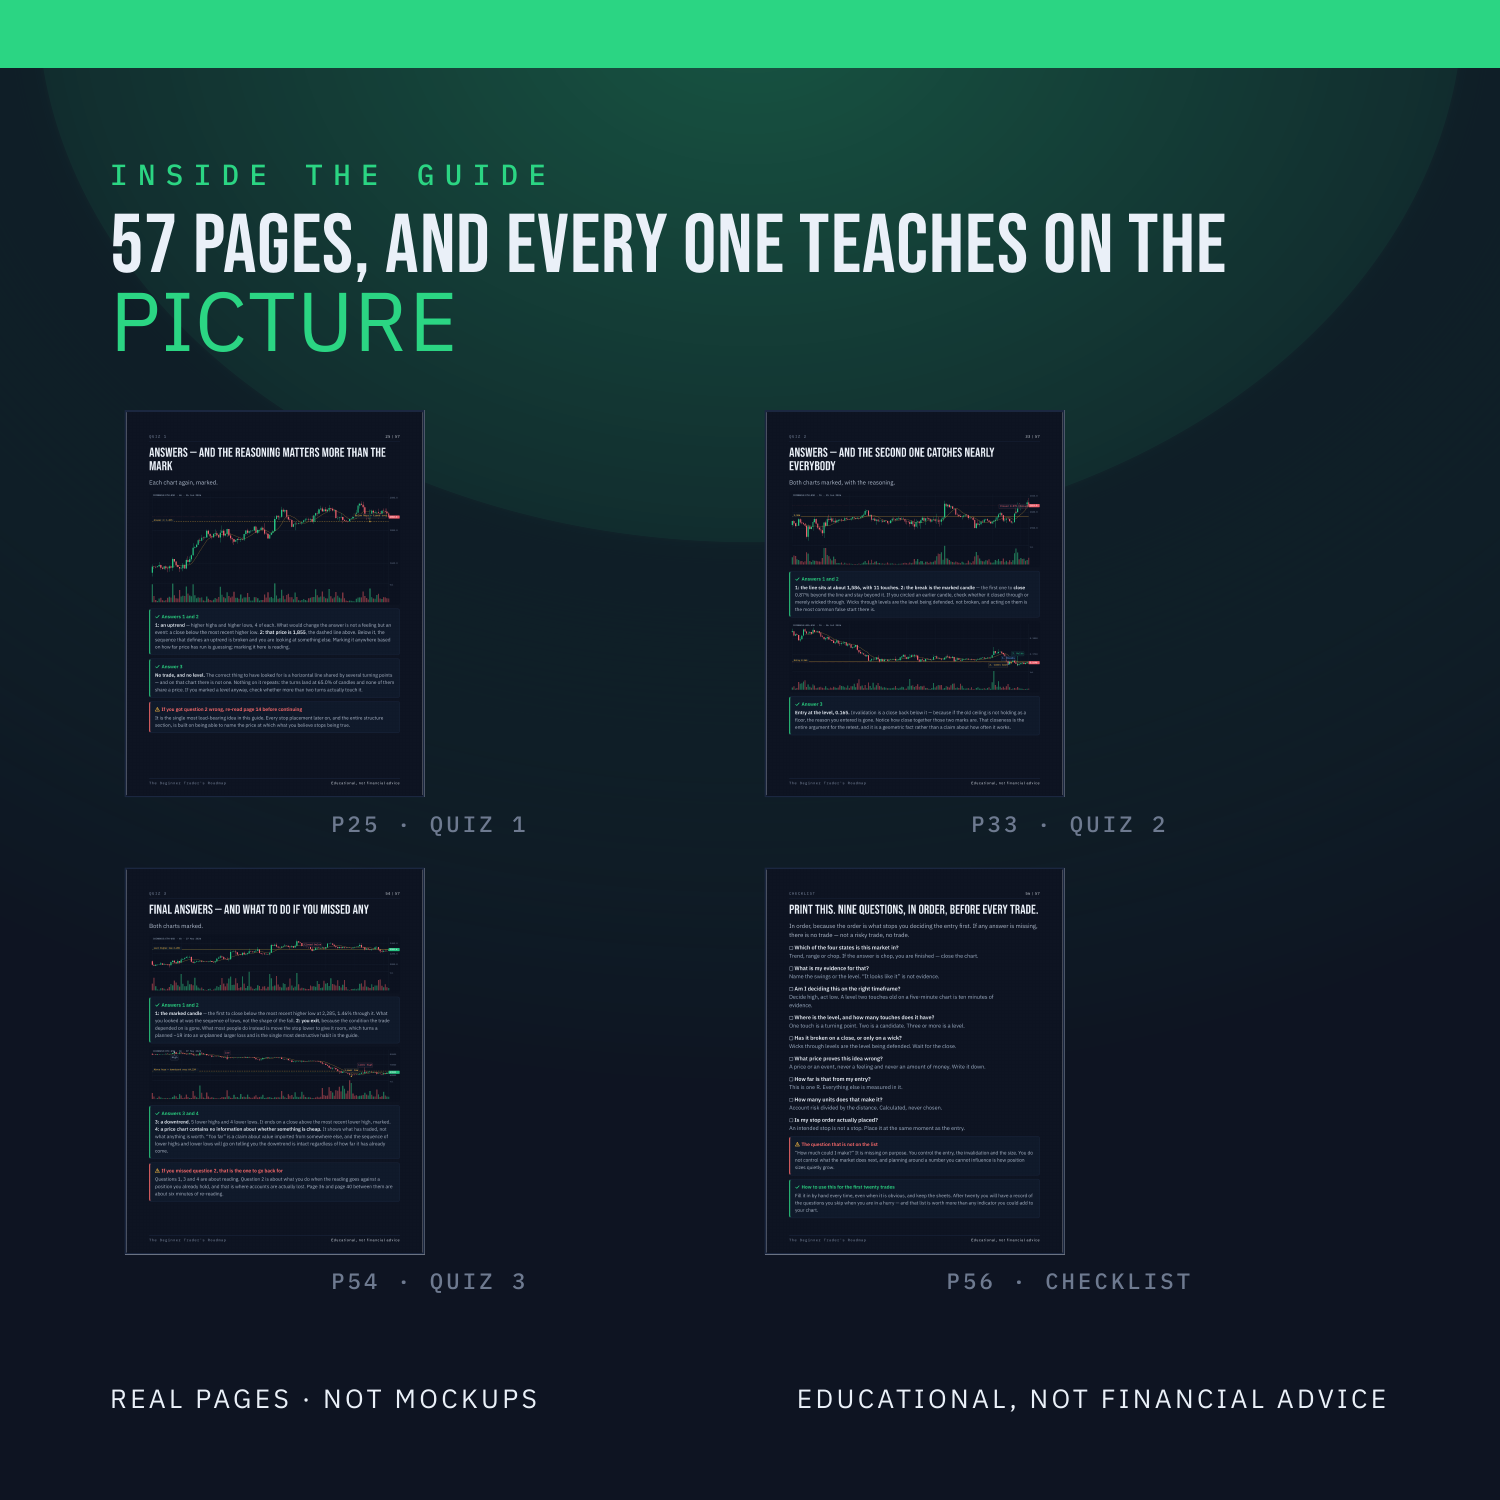
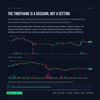
Nothing is taught underneath a chart. Every label sits on the candle, the line or the level it is describing, on real market data. There are three quizzes on real charts, each followed by the same chart re-shown annotated with the reasoning, plus faded practice pages where the first steps are filled in and you finish the rest.
WHAT'S INSIDE
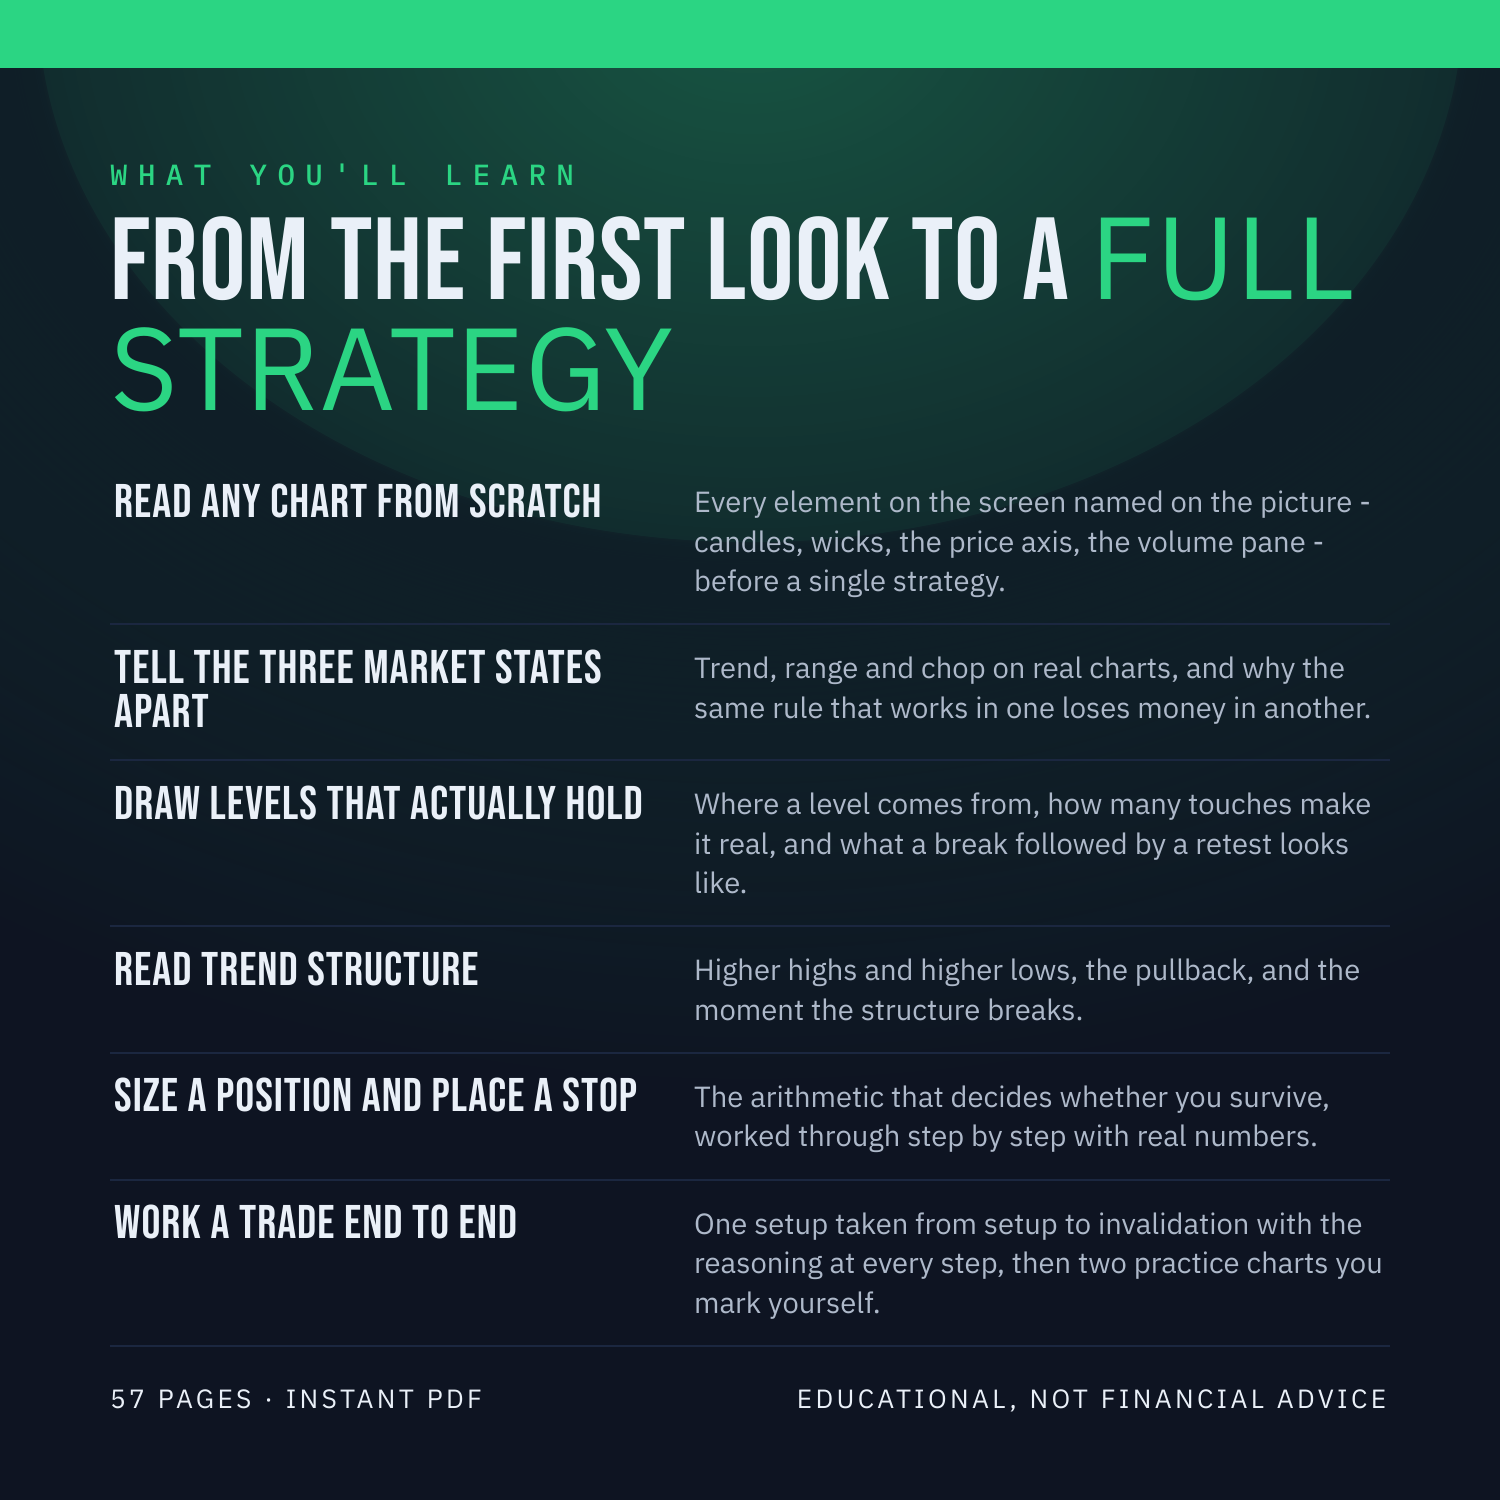
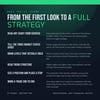
- Read any chart from scratch — every element on the screen named on the picture: candles, wicks, the price axis, the volume pane, before a single strategy.
- Tell the three market states apart — trend, range and chop on real charts, and why the same rule that works in one loses money in another.
- Draw levels that actually hold — where a level comes from, how many touches make it real, and what a break followed by a retest looks like.
- Read trend structure — higher highs and higher lows, the pullback, and the moment the structure breaks.
- Size a position and place a stop — the arithmetic that decides whether you survive, worked through step by step with real numbers.
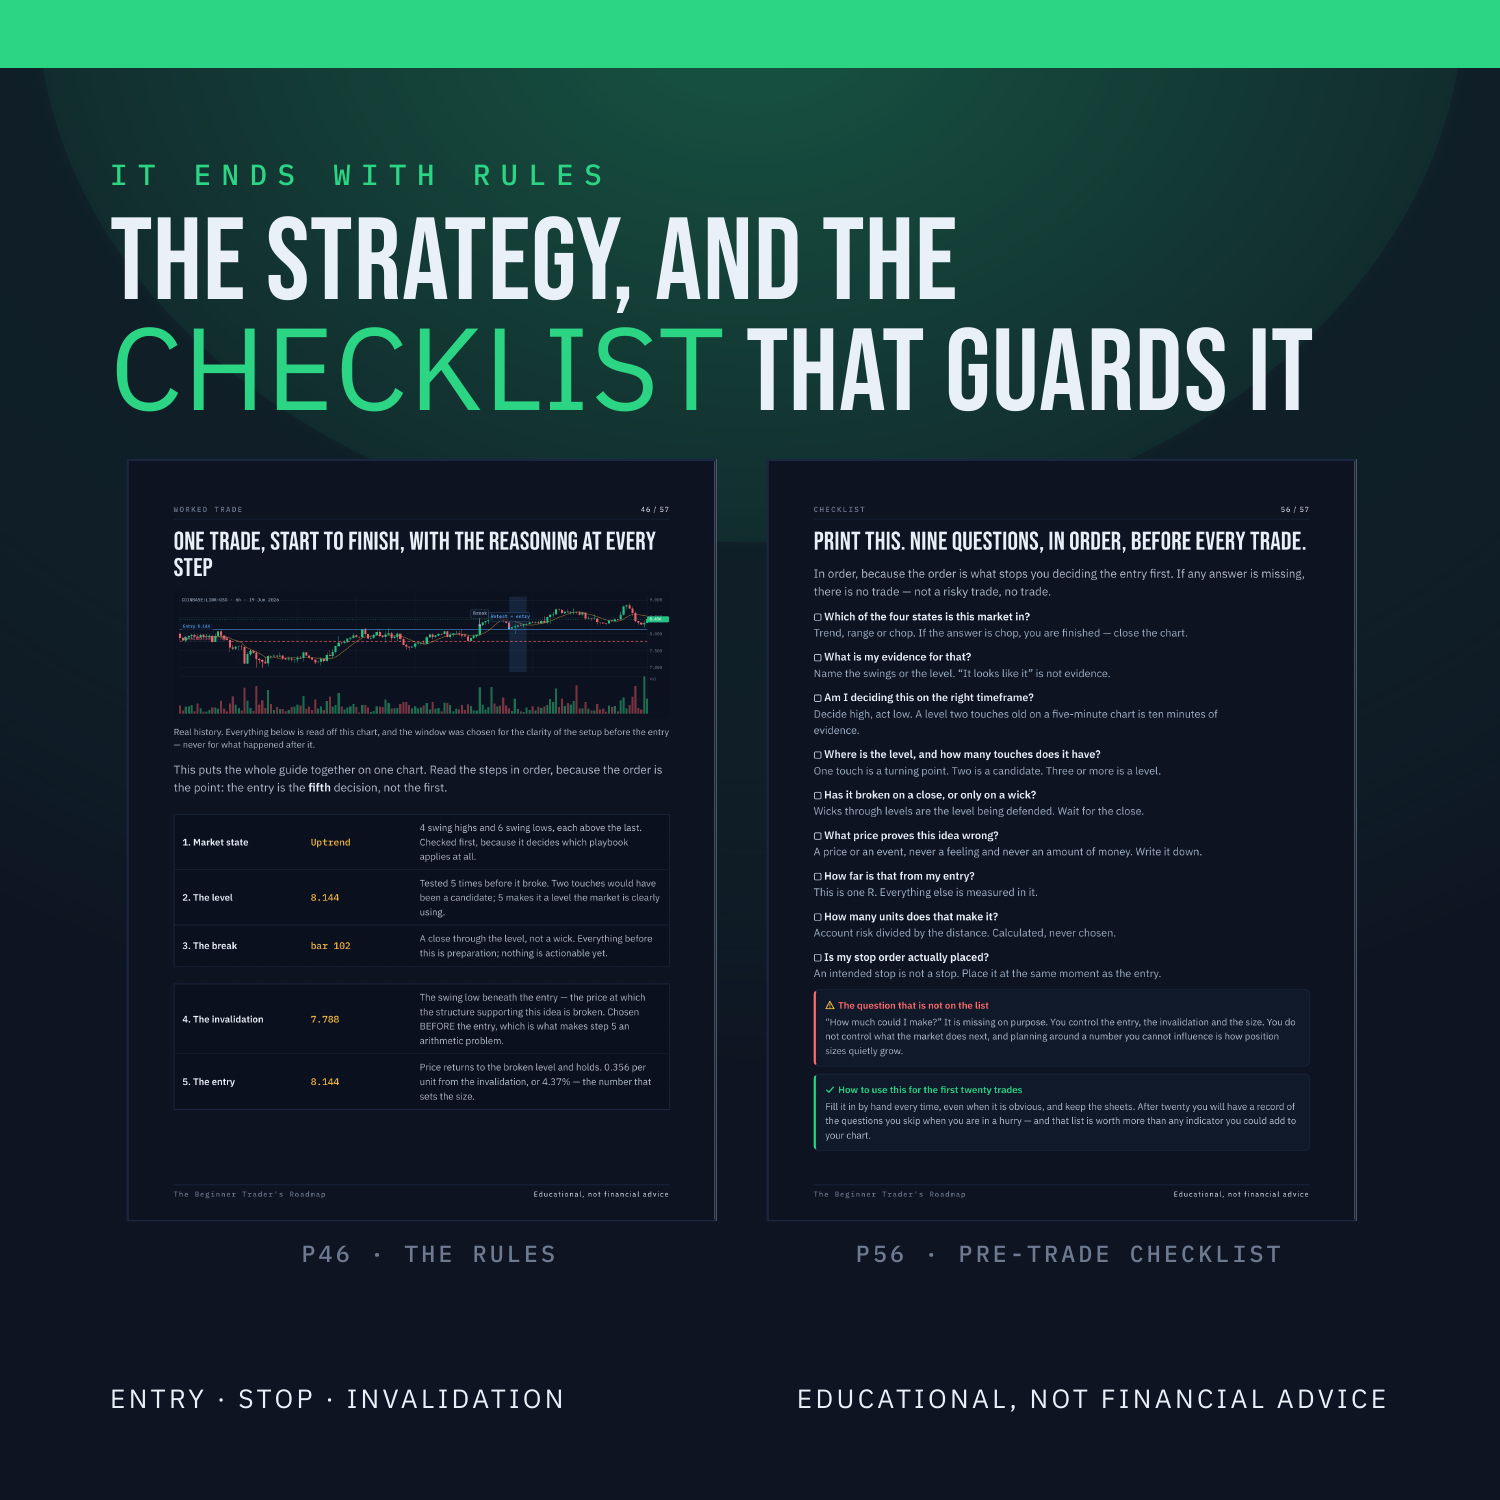
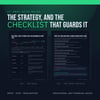
- Work a trade end to end — one setup from entry to invalidation with the reasoning at every step, then two practice charts you mark yourself.
WHAT YOU'LL BE ABLE TO DO
- Open any chart and name every element on it without guessing.
- Say which of the four market states you are looking at, and what would change your answer.
- Draw a level from real swing points and know how many touches make it worth trading.
- Tell a break from a poke, and know why the retest gives a tighter invalidation.
- Work out a position size from a stop instead of picking a round number.
- Finish the sentence "I am wrong if price ______" before every trade you take.
AN HONEST NOTE
A chart is a clue, not a crystal ball. It describes what price has already done. This guide contains no win-rates, no backtest results and no promises about what you will make, because nobody can verify those and you should not trust anyone who prints them. What it hands you instead is a set of rules you can test yourself on TradingView in an afternoon. Educational, not financial advice.
Instant download. 57 pages, PDF.