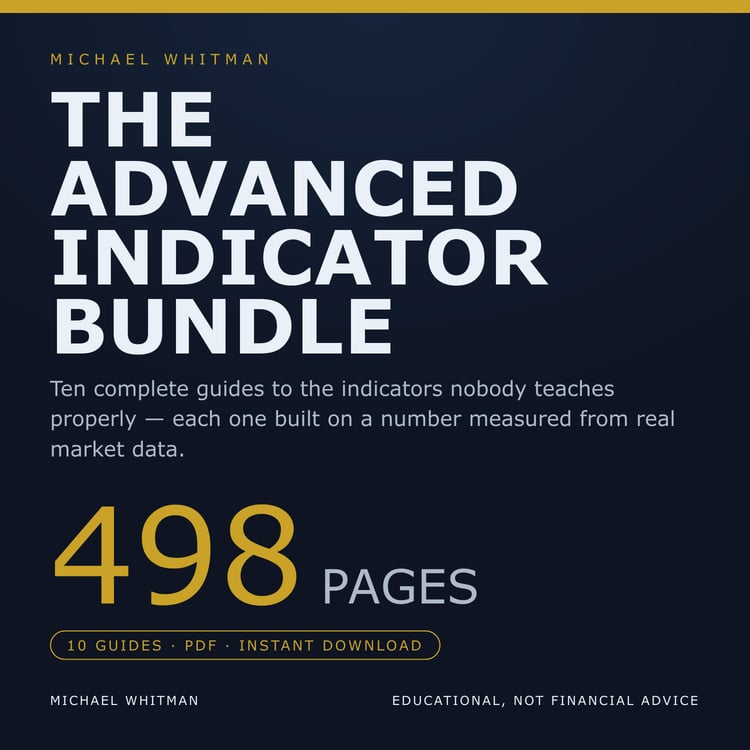







The Complete Indicator Bundle — 13 Guides, Measured
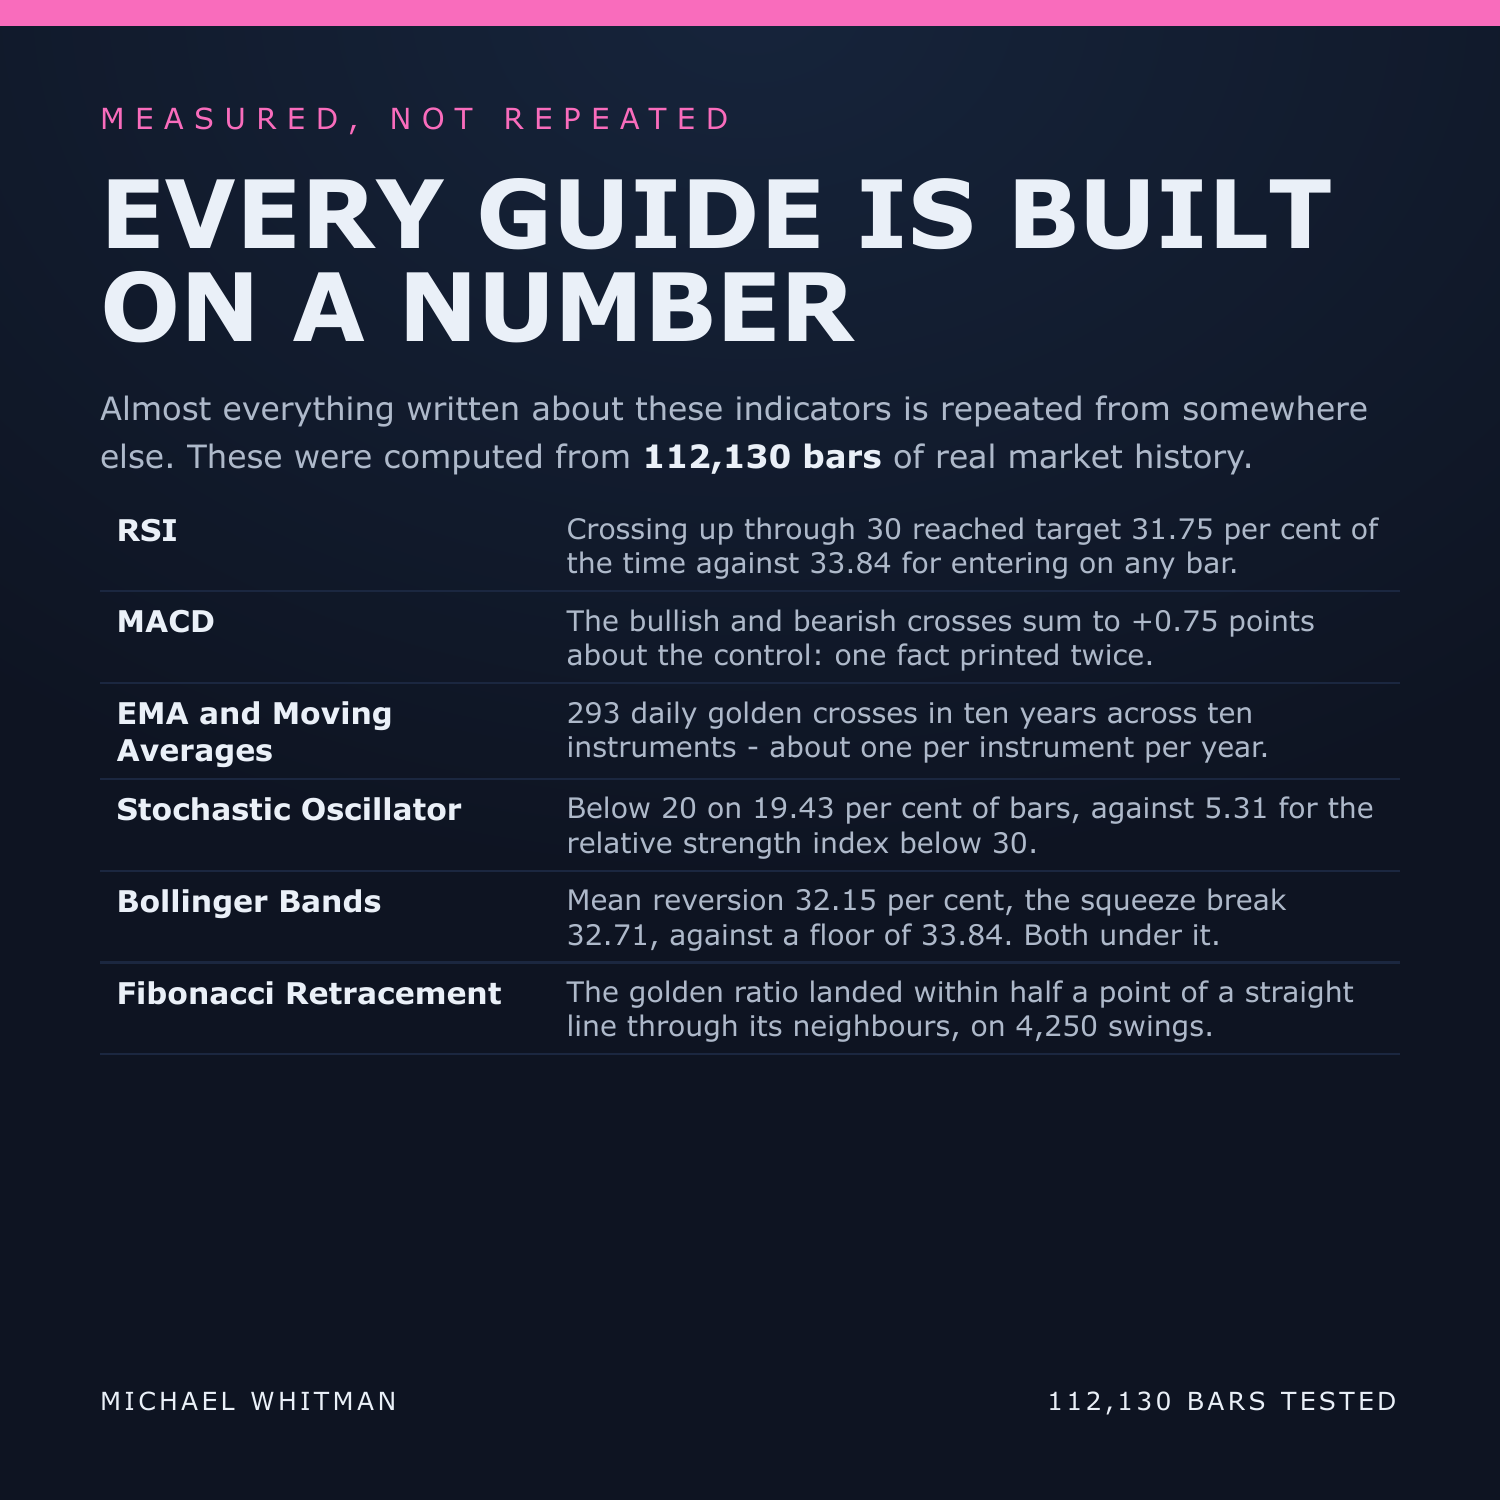
You have read a dozen articles about RSI and every one of them told you what it measures, what the levels mean and when to buy. Not one of them told you what the buy signal actually paid, or what you would have got by ignoring it entirely. That second number is the only thing that makes the first one mean anything, and almost nobody prints it.
This bundle is thirteen complete guides -- 596 pages -- to the indicators everyone uses, and every single one of them is measured against the same control: what entering on ANY bar at all pays under the identical target, stop and deadline. On this panel that figure is 33.84 per cent, and it is printed beside every percentage in all thirteen guides.
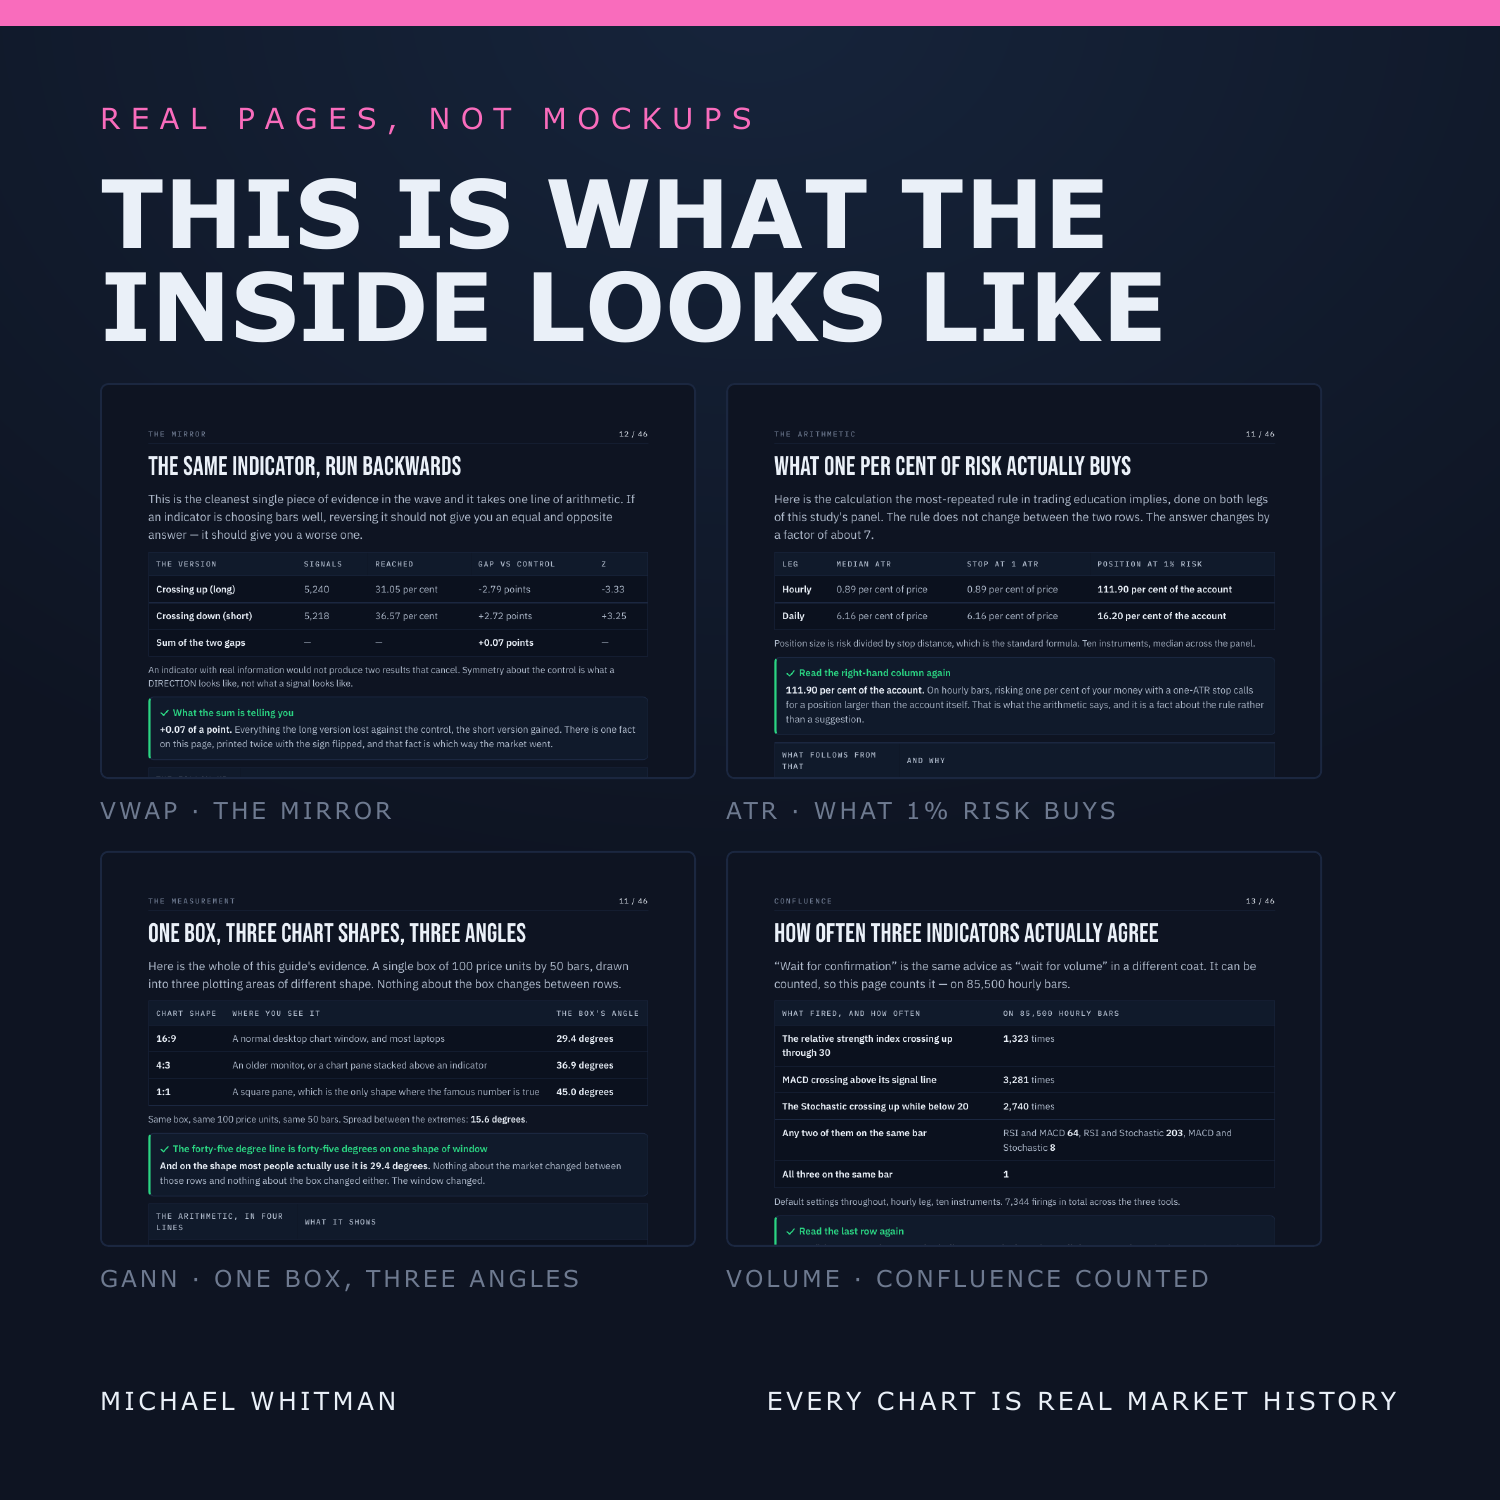
Nothing is taught underneath a chart. Every label sits on the candle, the line or the level it is describing, on real BTC, ETH, SOL and LINK charts. Each guide carries three quizzes on real charts, a worked example, faded practice where the first steps are filled in and you finish the rest, and a blank one with no scaffolding at all.
WHAT'S INSIDE
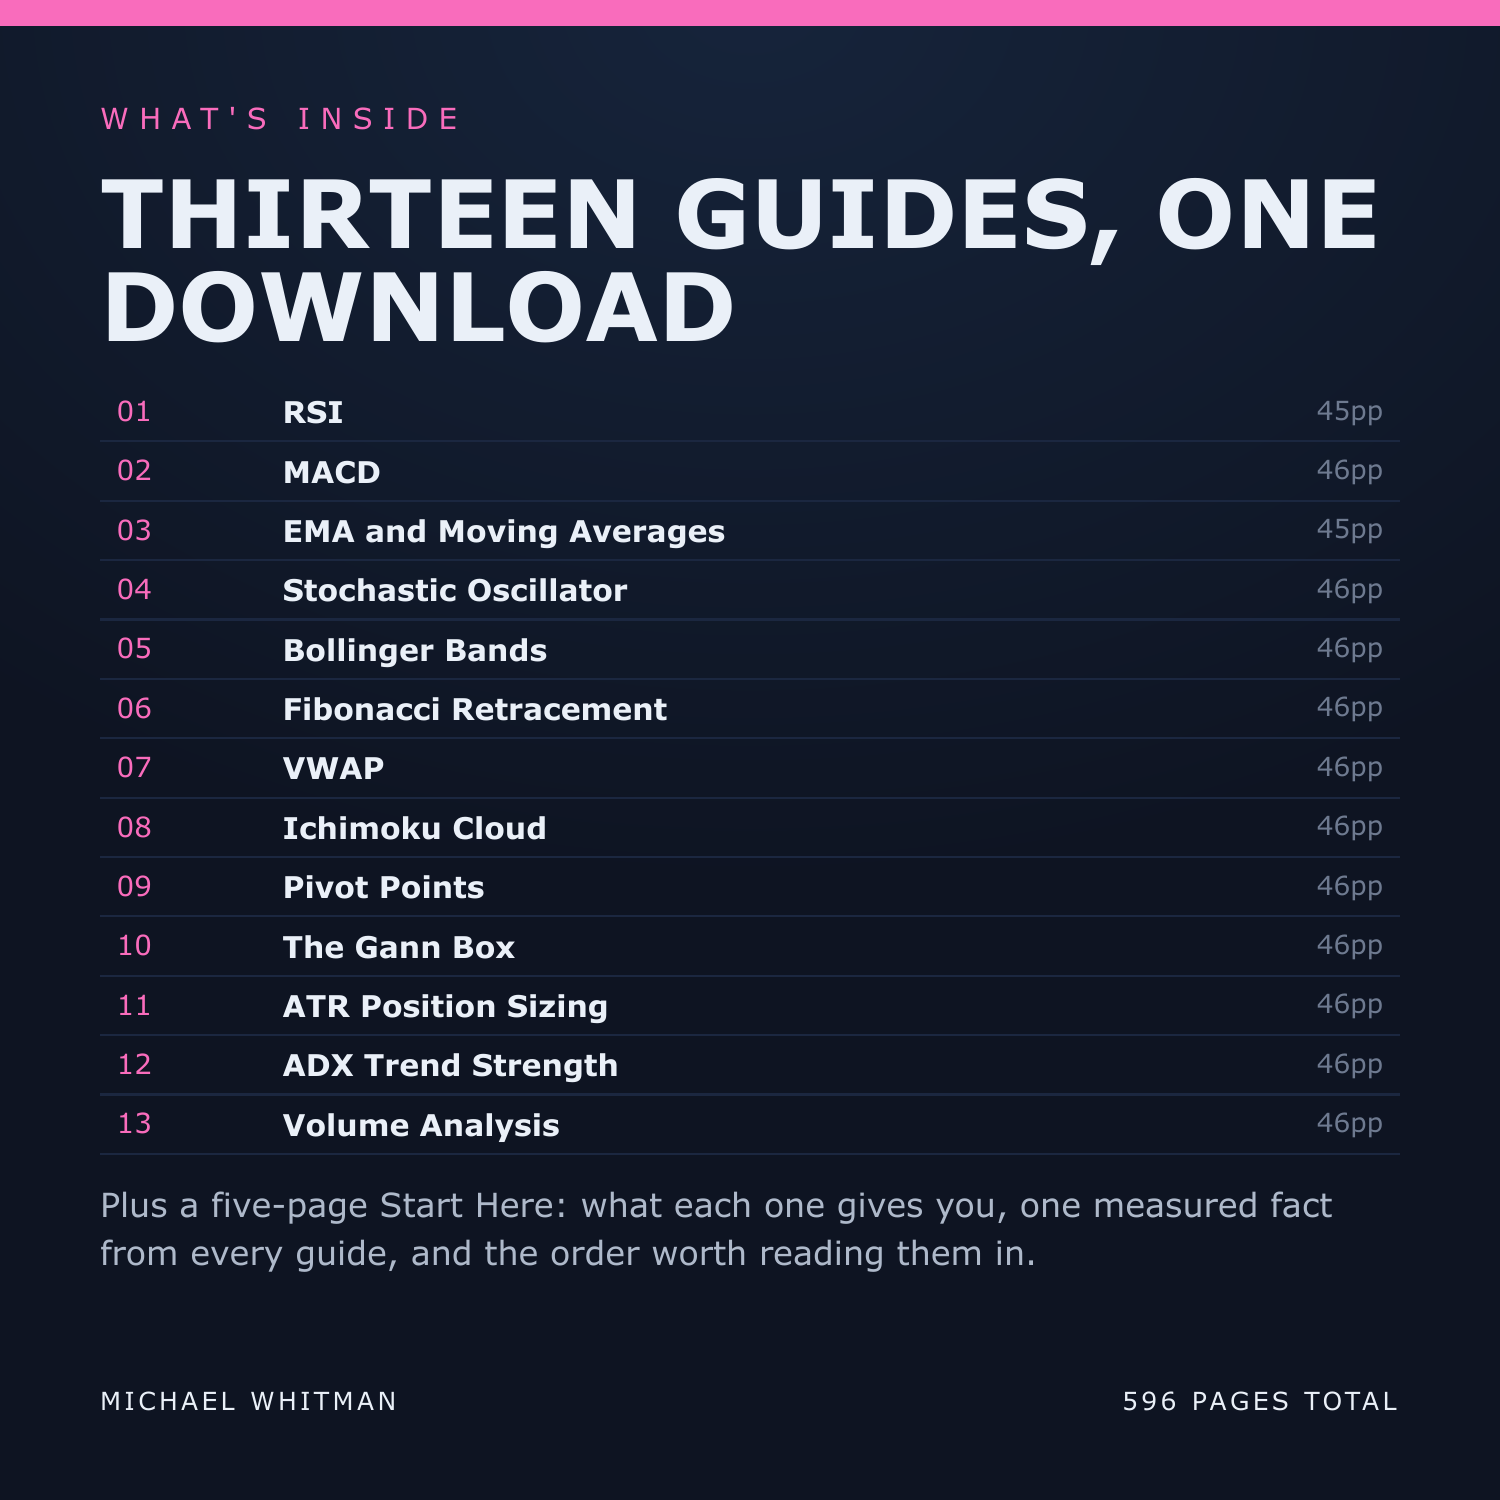
RSI (45pp) -- The most-taught oscillator in the subject, measured against a control.
MACD (46pp) -- Three lines and one subtraction, and what each cross actually paid.
EMA and Moving Averages (45pp) -- The golden cross, on the smallest sample and the biggest reputation.
Stochastic Oscillator (46pp) -- Where the close sits in a range, and why it pins in a trend.
Bollinger Bands (46pp) -- The one indicator taught two opposite ways, with both measured.
Fibonacci Retracement (46pp) -- Where the ratios come from, and why no honest test is possible.
VWAP (46pp) -- Two results that cleared a corrected significance bar, taken apart.
Ichimoku Cloud (46pp) -- Five lines, two numbers, and the displacement nobody explains.
Pivot Points (46pp) -- The only support-and-resistance tool that can be tested at all.
The Gann Box (46pp) -- Why the forty-five degree line is a fact about your monitor.
ATR Position Sizing (46pp) -- The one guide here whose arithmetic changes what you do.
ADX Trend Strength (46pp) -- A filter tested the only way a filter can be: with it and without.
Volume Analysis (46pp) -- What confirmation costs, counted rather than repeated.
Plus a five-page Start Here: what each guide gives you, one measured fact from every one of them, and the order worth reading them in.
WHAT YOU'LL BE ABLE TO DO
Read any indicator claim and immediately ask what it was compared against.
Say what each of these thirteen tools is actually computed from.
Run the same five-step check on your own trading record in an afternoon.
Tell a rare signal from a good one, using the firing rate rather than memory.
Spot a rule that has been fitted to an outcome after the fact.
Work out what a round trip costs you as a share of your own risk.
THE HONEST NOTE
Not one of the thirteen indicators beat the control. Three tests cleared a corrected significance bar and all three turned out to be the direction of the window rather than the indicator. There are no win rates here, no backtest results and no profit figures -- none of those can be verified by you, and anything you cannot verify you should not be trading on.
Educational material, not financial advice.
Instant download. 596 pages across 13 guides, plus the Start Here. One zip, or every PDF separately.