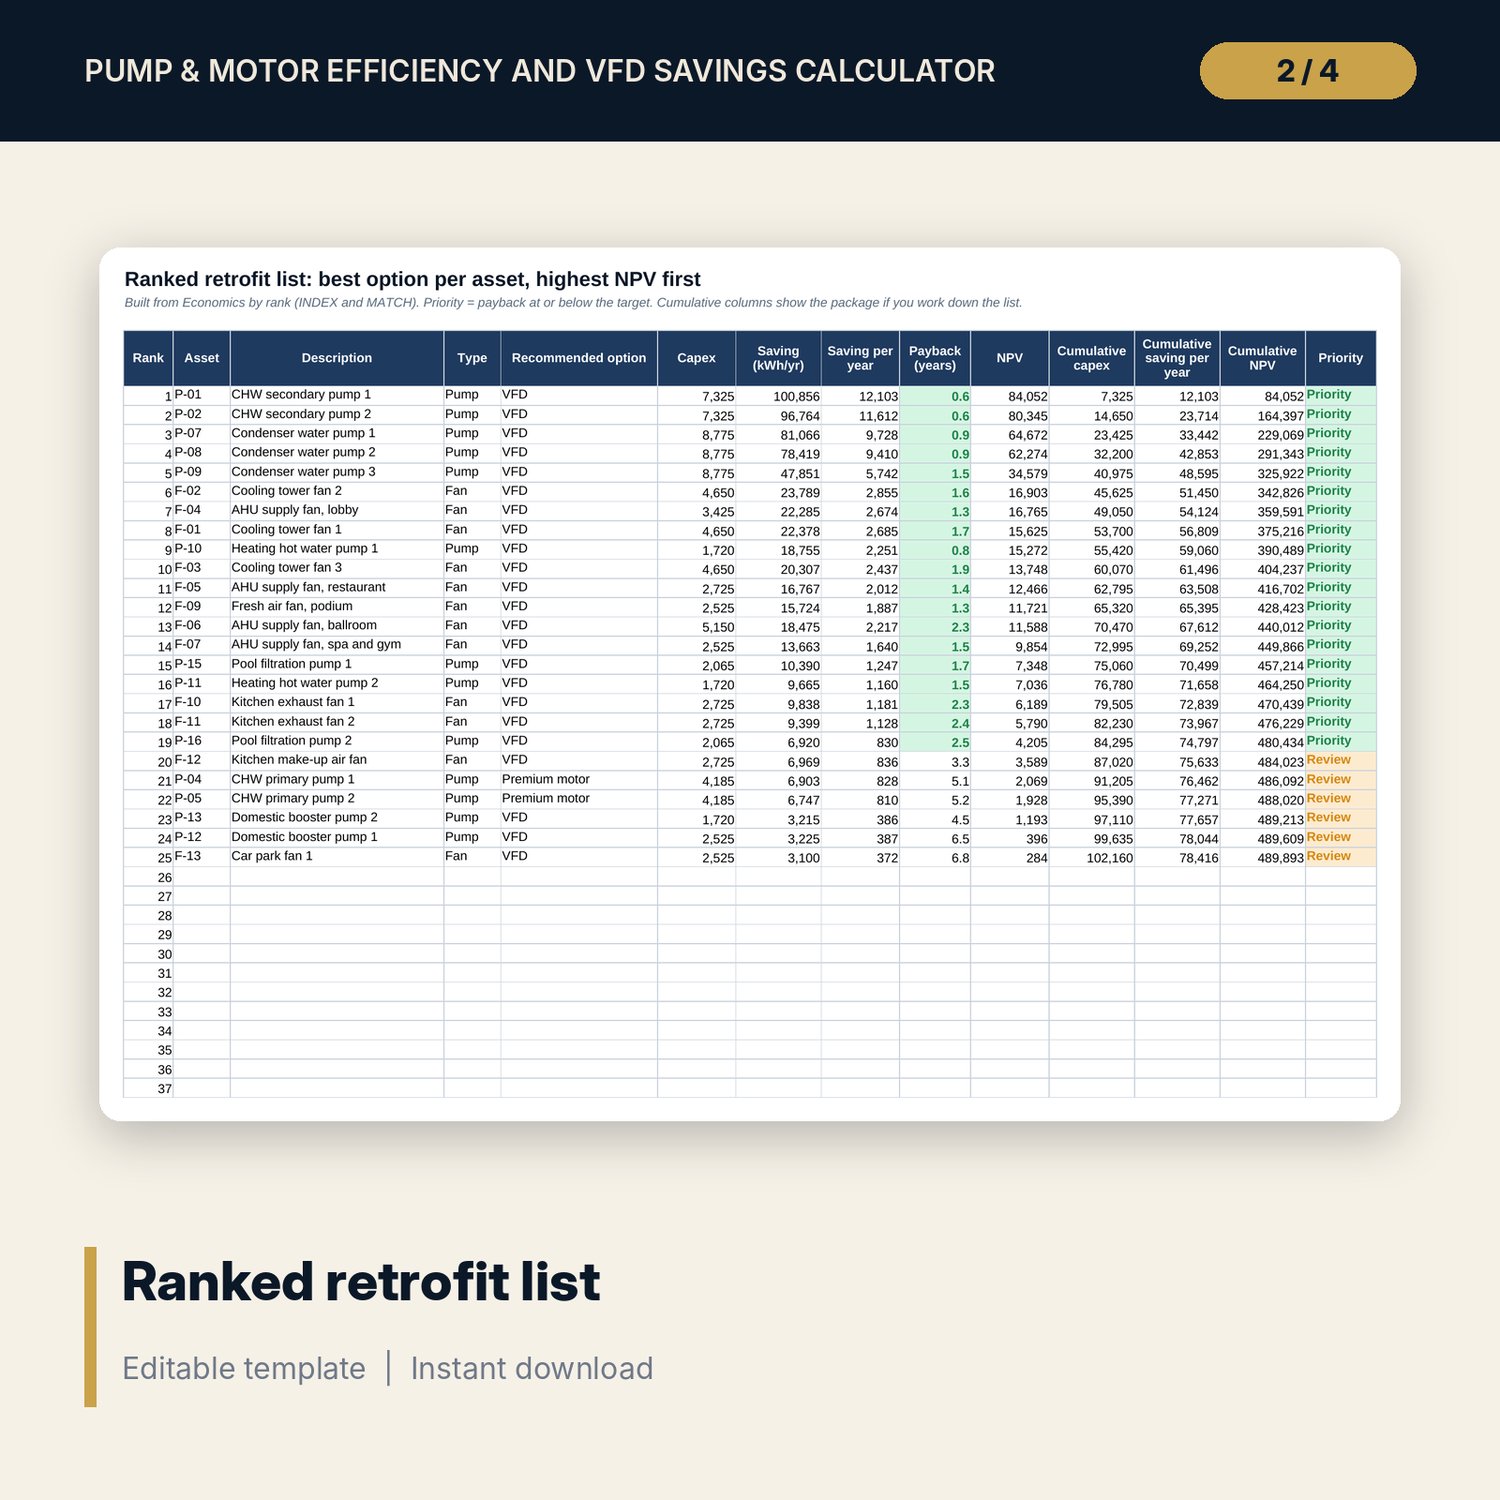


Pump & Motor Efficiency and VFD Savings Calculator: VFD Savings, Affinity Laws and Premium Motor Payback Excel Workbook
Full description
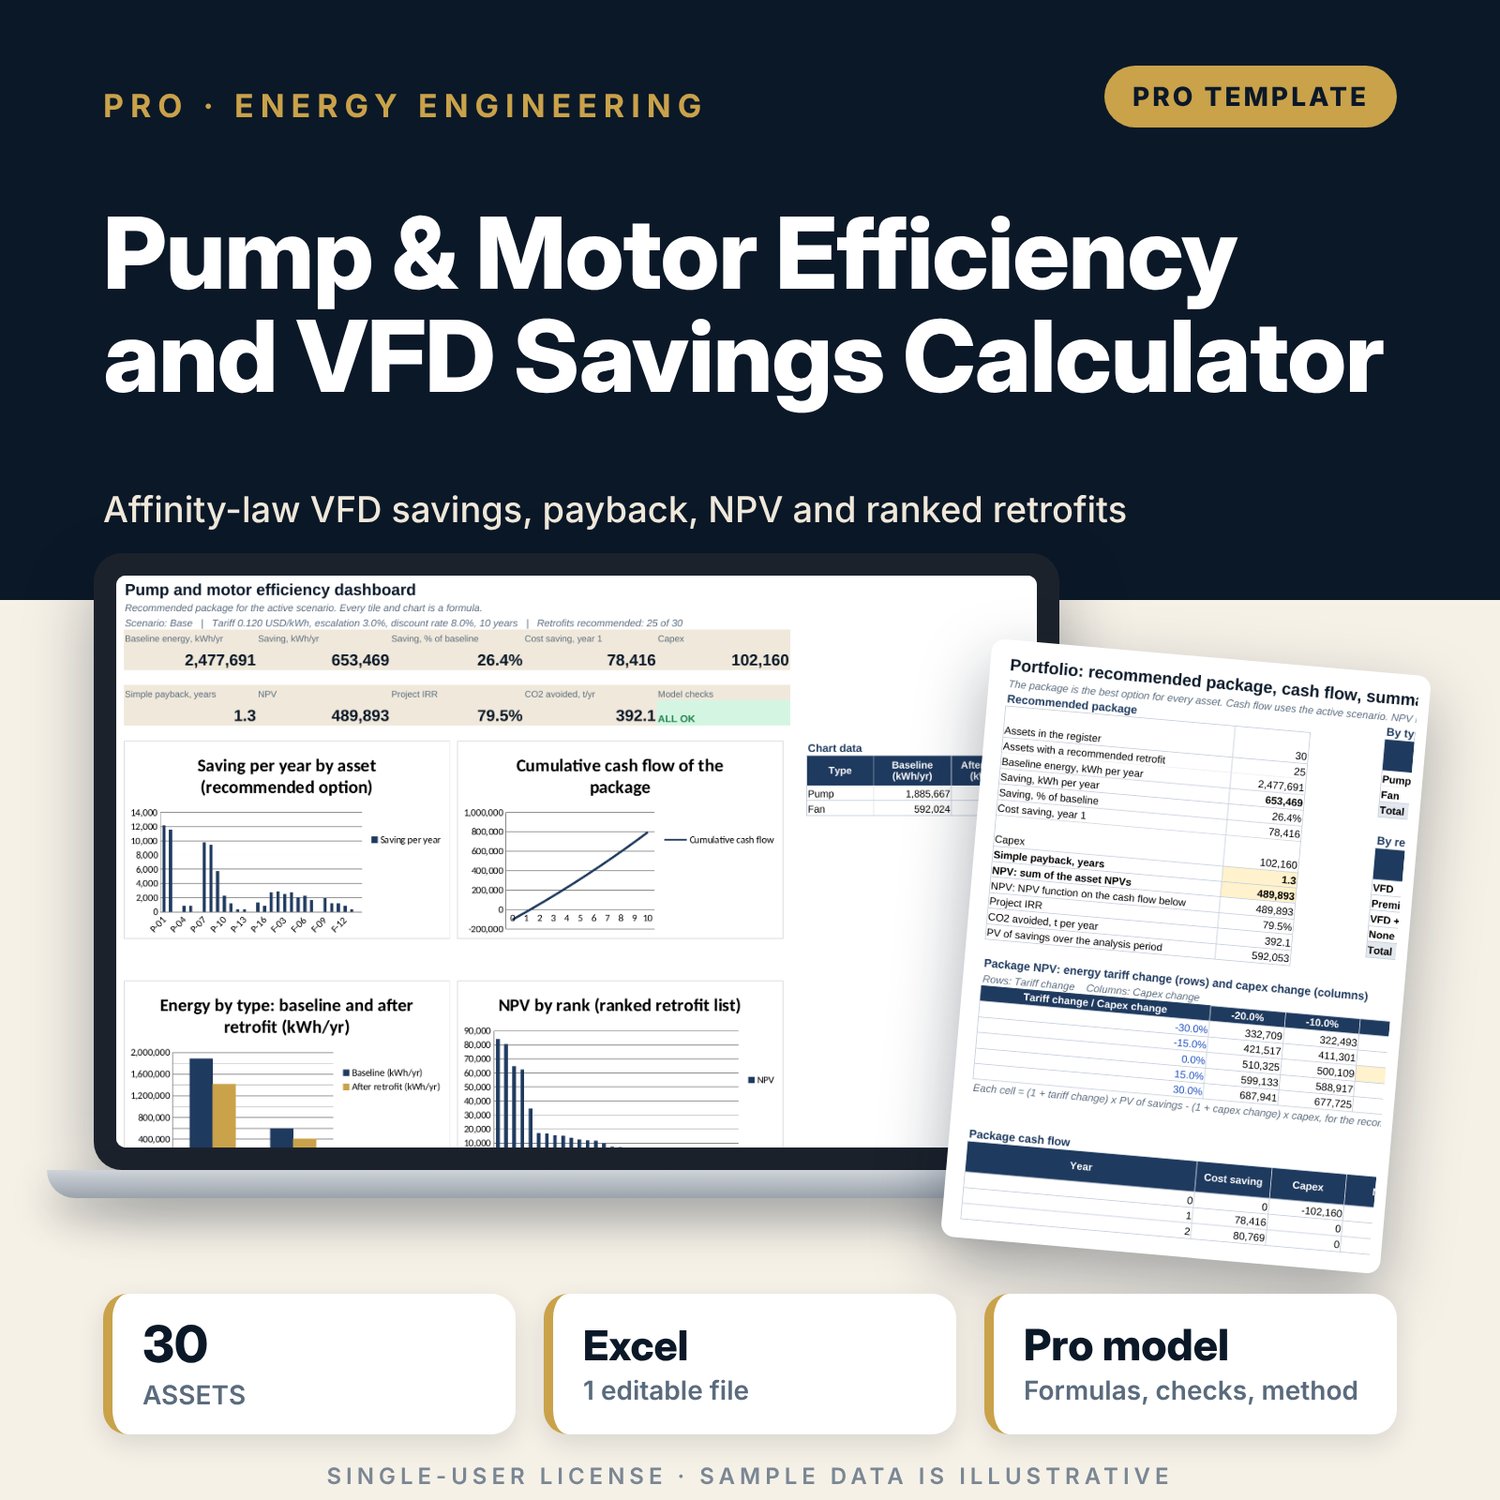
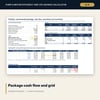
For chief engineers, energy managers, asset managers and general managers who need to decide which pumps and fans to put on a variable speed drive or fit with a premium-efficiency motor. You enter rated and measured kW, flow and head, the control method, hours and a load profile by flow band. The workbook calculates wire-to-water efficiency and motor load, builds baseline kWh from the control curve, applies the affinity laws with a static-head share to estimate VFD kWh, adds a premium motor option, and compares kWh, cost saving, simple payback and NPV with a growing tariff. Each asset gets its best option and a rank. A package cash flow gives NPV and IRR, and a grid tests tariff and capex.
Save with a bundle: this workbook is also in the Hotel Engineering & MEP Pro Bundle, 25 workbooks for $59 instead of $319. All 100 Pro workbooks are in the Pro Library for $119, and all 241 templates and workbooks are in the Ultimate Hospitality Library for $149.
What is inside
- Pump_Motor_Efficiency_VFD_Savings_Calculator.xlsx: 12 tabs, 2,984 formulas, 4 native charts, 21 drop-down and input rules
- Asset_Register with room for 40 assets (30 sample assets: 16 pumps and 14 fans) and Load_Profile with five flow bands per asset
- Duty_Check: hydraulic or air power, wire-to-water efficiency, shaft load, full-flow power and flags
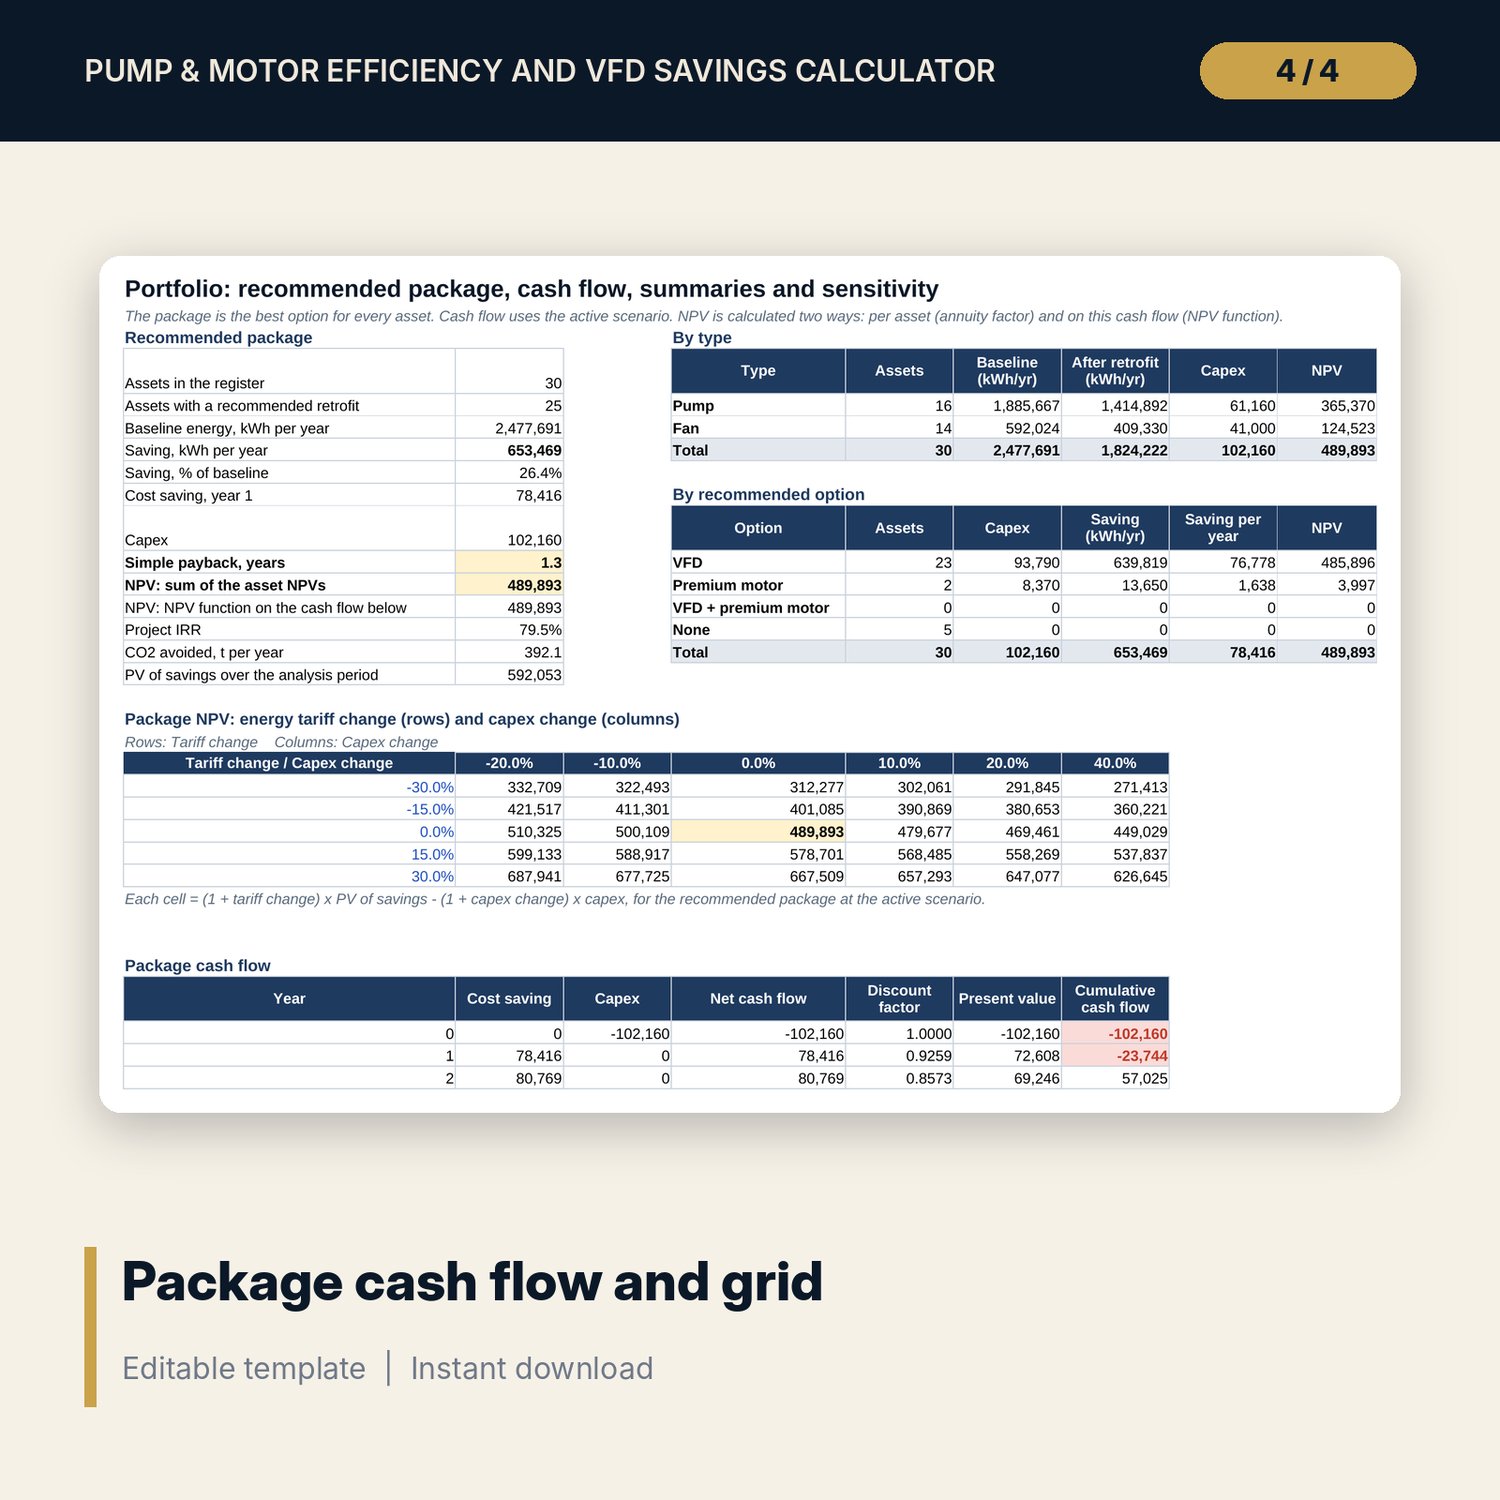
- Energy_Calc: flow-band means M1, M2 and M3, baseline, VFD and premium motor kWh per year, speed ratio and a minimum speed check
- Economics: capex, saving and NPV for three options per asset, best option, payback, rank and CO2
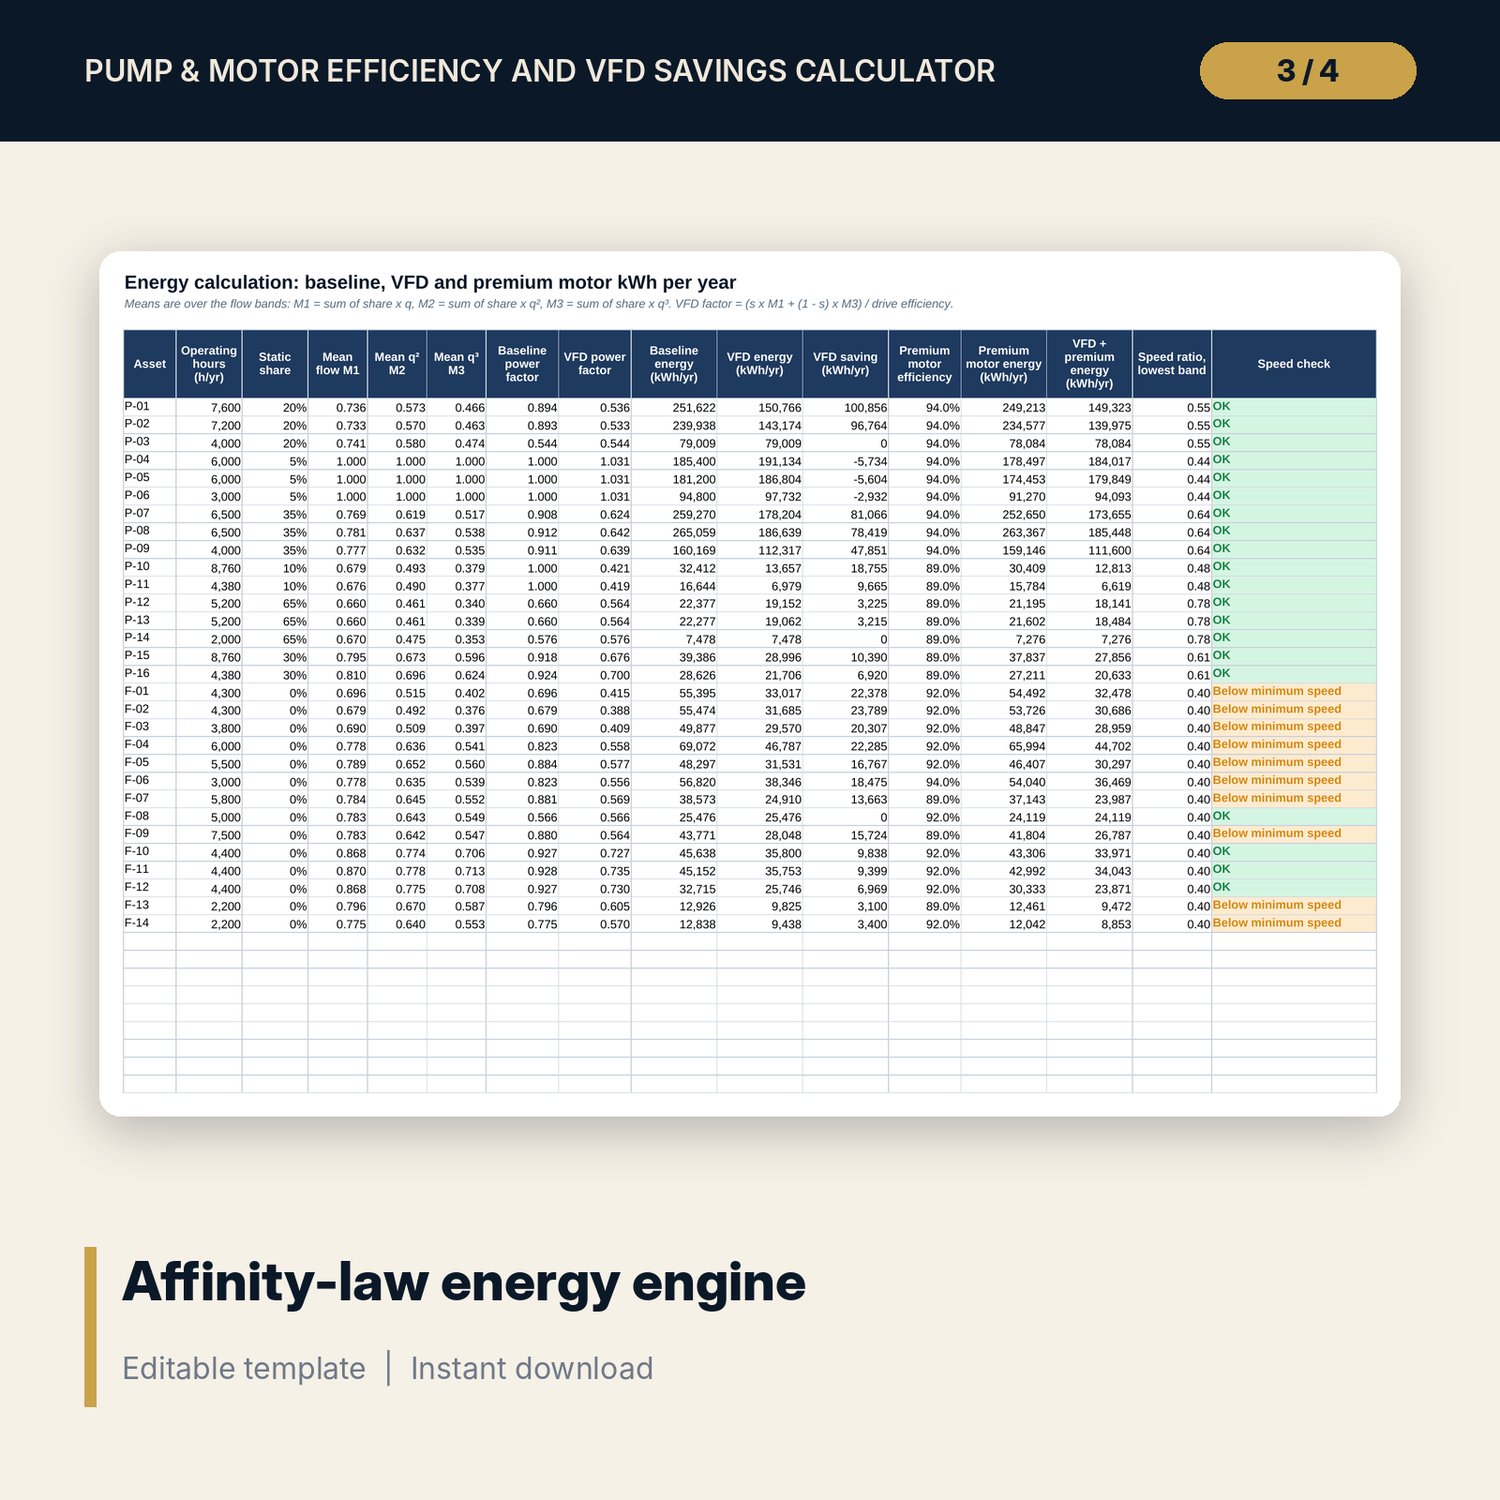
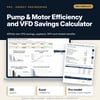
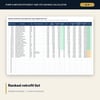
- Ranked_List sorted by NPV with cumulative capex, saving and NPV; Portfolio with cash flow, NPV, IRR, summaries by type and option, and two 5 x 6 grids
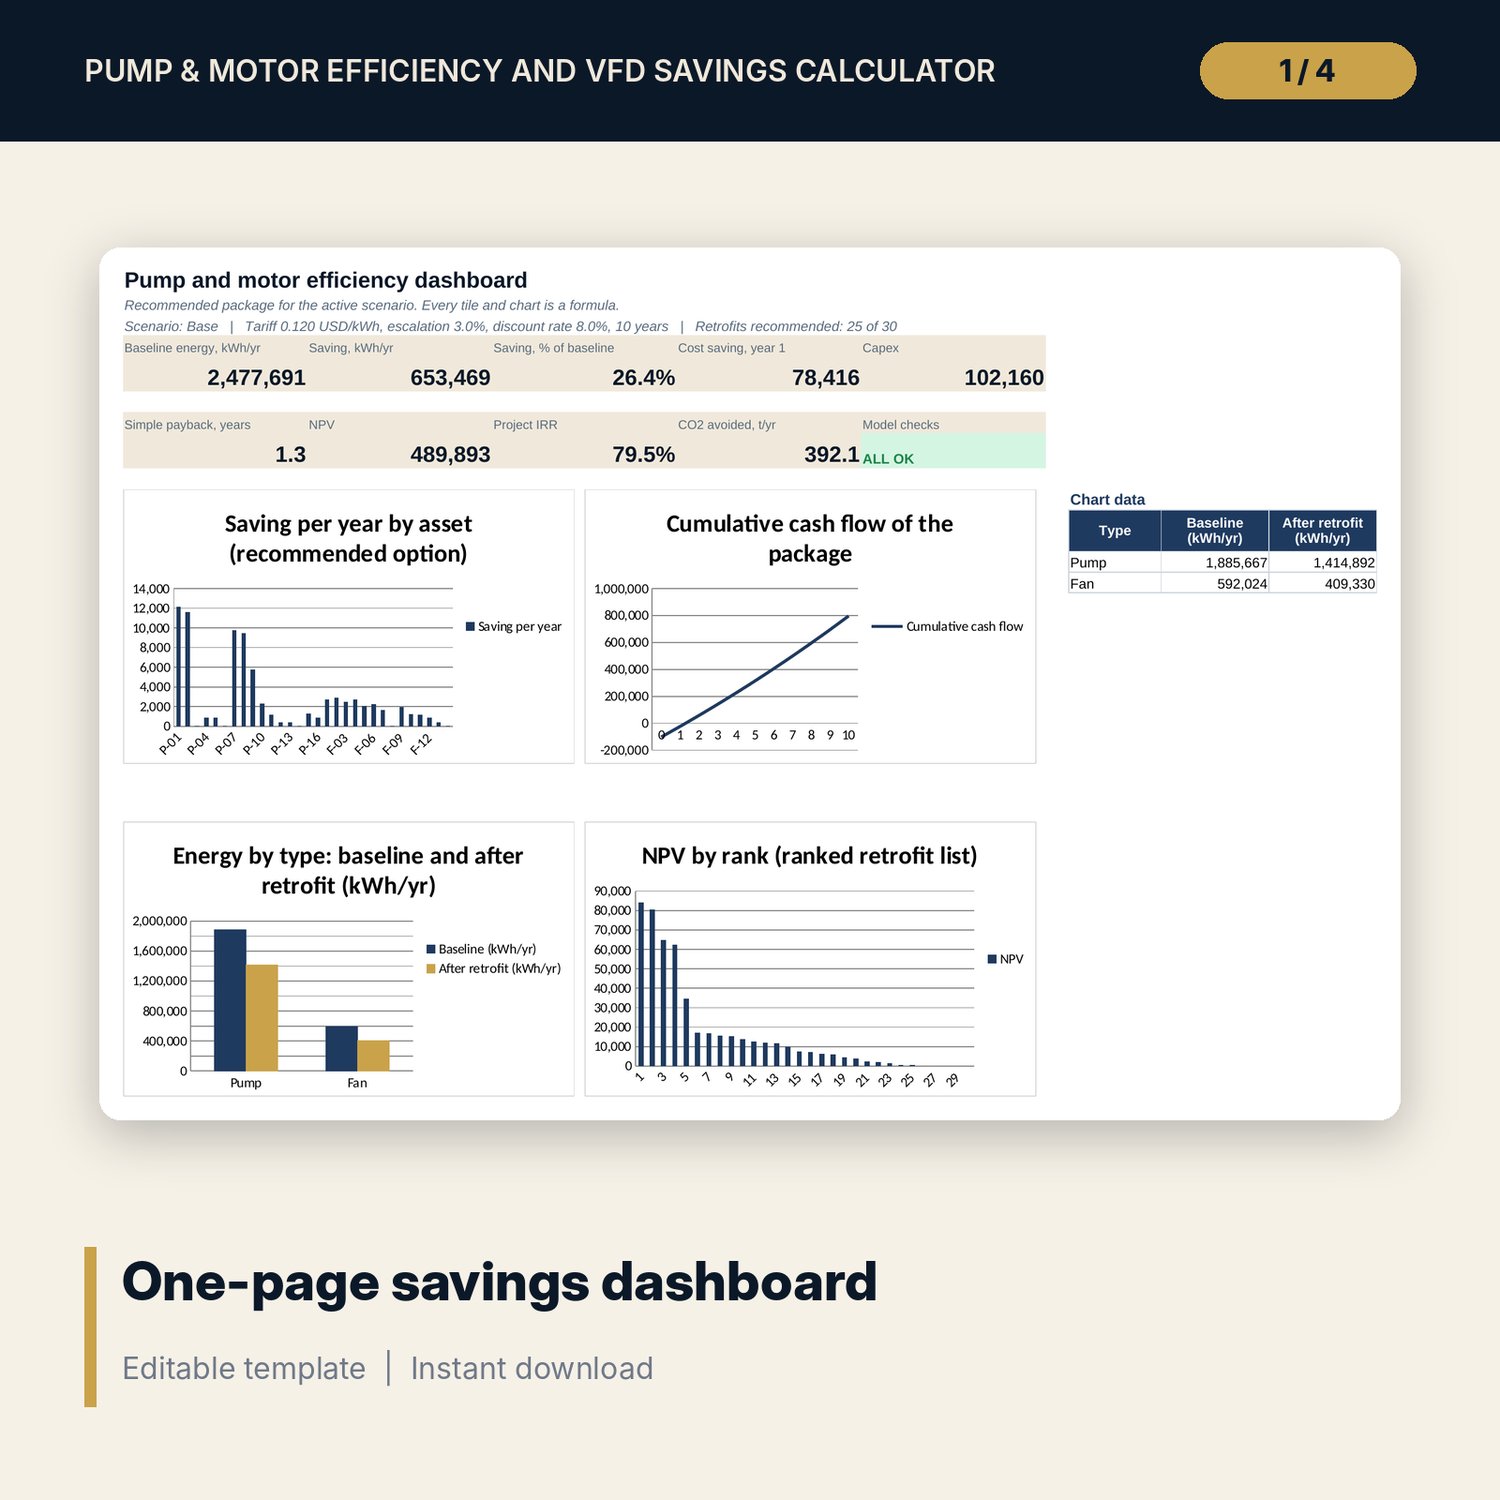
- Three price and finance scenarios, a one-page Dashboard with 9 KPI tiles and 4 charts, 14 integrity checks and a Method tab with 18 documented calculations
- README.txt and LICENSE-and-Terms.txt
How it works
- Choose a scenario on Assumptions and enter your tariff, discount rate, control curves and size band costs.
- List your pumps and fans on Asset_Register with measured kW, flow and head taken at the same time.
- Enter the flow bands and each asset's share of hours in each band on Load_Profile.
- Review the duty flags and the energy calculation, then read Economics and Ranked_List.
- Test the package on Portfolio: cash flow, NPV, IRR and the tariff and capex grid.
Details
- Format: .xlsx workbook, English
- Software: Excel 2016 or later, or LibreOffice Calc 7 or later
- No macros, no external links, no data tables, no array formulas
- Instant digital download
Good to know
- Sample data is illustrative. Replace it with your own measurements.
- Tariffs, control curves, motor efficiencies and costs are editable inputs. Verify with your supplier, utility and adviser.
- Savings are estimates from spot readings and a profile, not guarantees. This is not engineering advice.
- Single-user license. Do not redistribute.
FAQ
Does it follow the affinity laws?
Yes. Flow varies with speed, head with speed squared and power with speed cubed. A static-head share lets you model boosters and open systems, where savings are smaller.
What if a pump already has a drive?
Mark Existing VFD as Yes. The VFD options are not offered for that asset and its baseline uses the drive curve.
Can I change the control method curves?
Yes. Each method has three coefficients on Assumptions: power fraction = c0 + c1 x flow + c2 x flow squared. A check confirms each curve gives 1.00 at full flow.
How is NPV calculated?
Saving in kWh x tariff x a growing annuity factor, minus capex. The package NPV is also calculated with the NPV function on a year-by-year cash flow, and a check ties the two.
Does it include maintenance savings or incentives?
No. It counts energy only. Add incentives or avoided maintenance in your own business case.