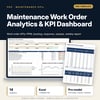
Maintenance Work Order Analytics & KPI Dashboard: planned vs reactive ratio, PPM compliance and backlog
Full description
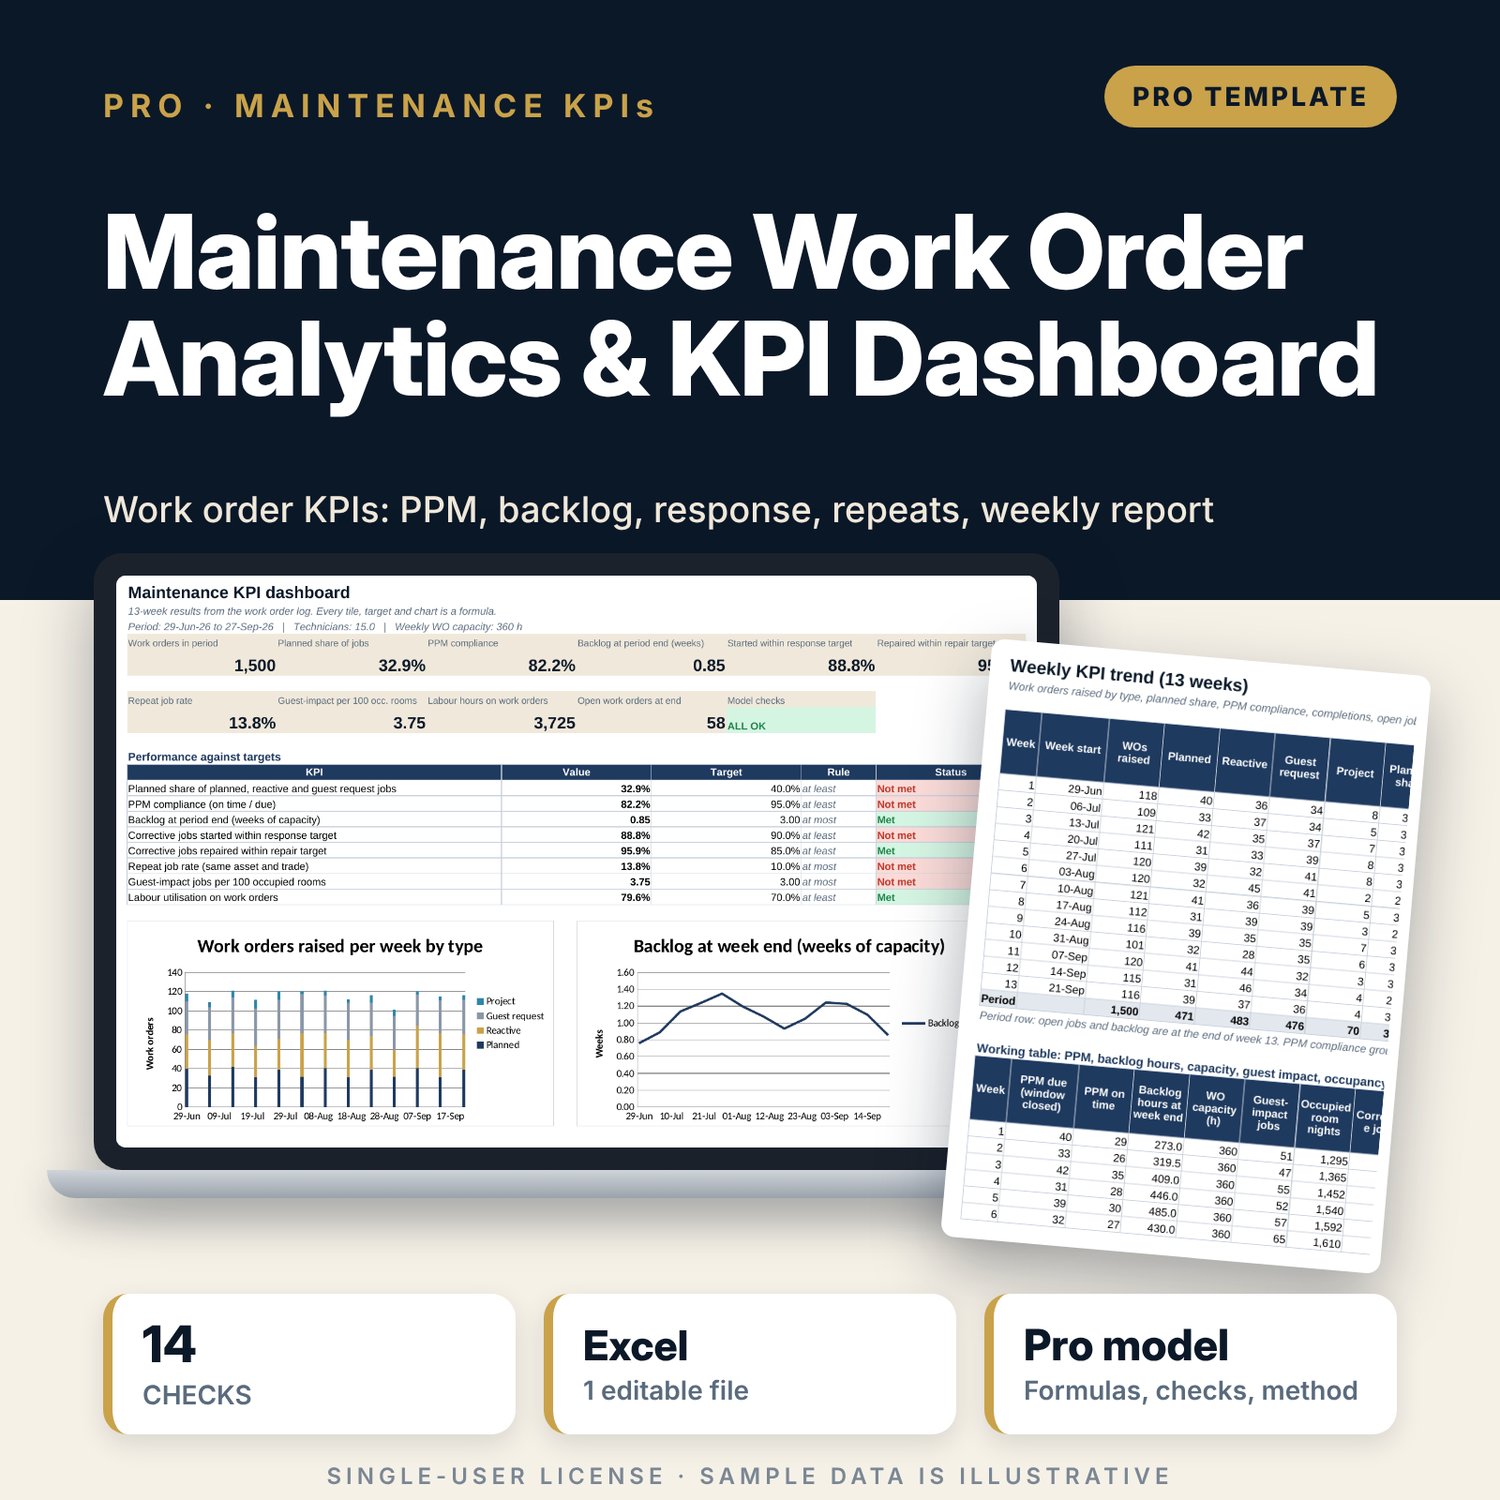
For chief engineers, hotel general managers, asset managers and technical directors who need facts for the weekly engineering meeting. You paste 13 weeks of work orders (type, trade, area, asset, priority, guest impact, reported, started and completed times, hours) and a register of your assets. The workbook calculates the planned share of jobs, PPM compliance with a due-date tolerance, backlog in weeks of labour capacity, mean time to respond and to repair by priority against your targets, repeat jobs on the same asset within a set window, guest-impact jobs per 100 occupied rooms and labour hours by trade. Every step sits in a visible engine tab, and each result carries a target and a Met or Not met status.
Save with a bundle: this workbook is also in the Hotel Engineering & MEP Pro Bundle, 25 workbooks for $59 instead of $319. All 100 Pro workbooks are in the Pro Library for $119, and all 241 templates and workbooks are in the Ultimate Hospitality Library for $149.
What is inside
- Maintenance_Work_Order_Analytics_KPI_Dashboard.xlsx: 11 tabs, 33,812 formulas, 4 native charts, 12 drop-down and input rules, 14 integrity checks, a Method tab with 16 calculation notes.
- Sample data (illustrative): 1,500 work orders over 13 weeks with room for 1,800, 331 assets with room for 400, 7 trades, 4 priority levels and weekly occupied room nights.
- WO_Calc engine: one row per work order with week, response and repair hours, targets, open status, repeat flag, PPM status and age.
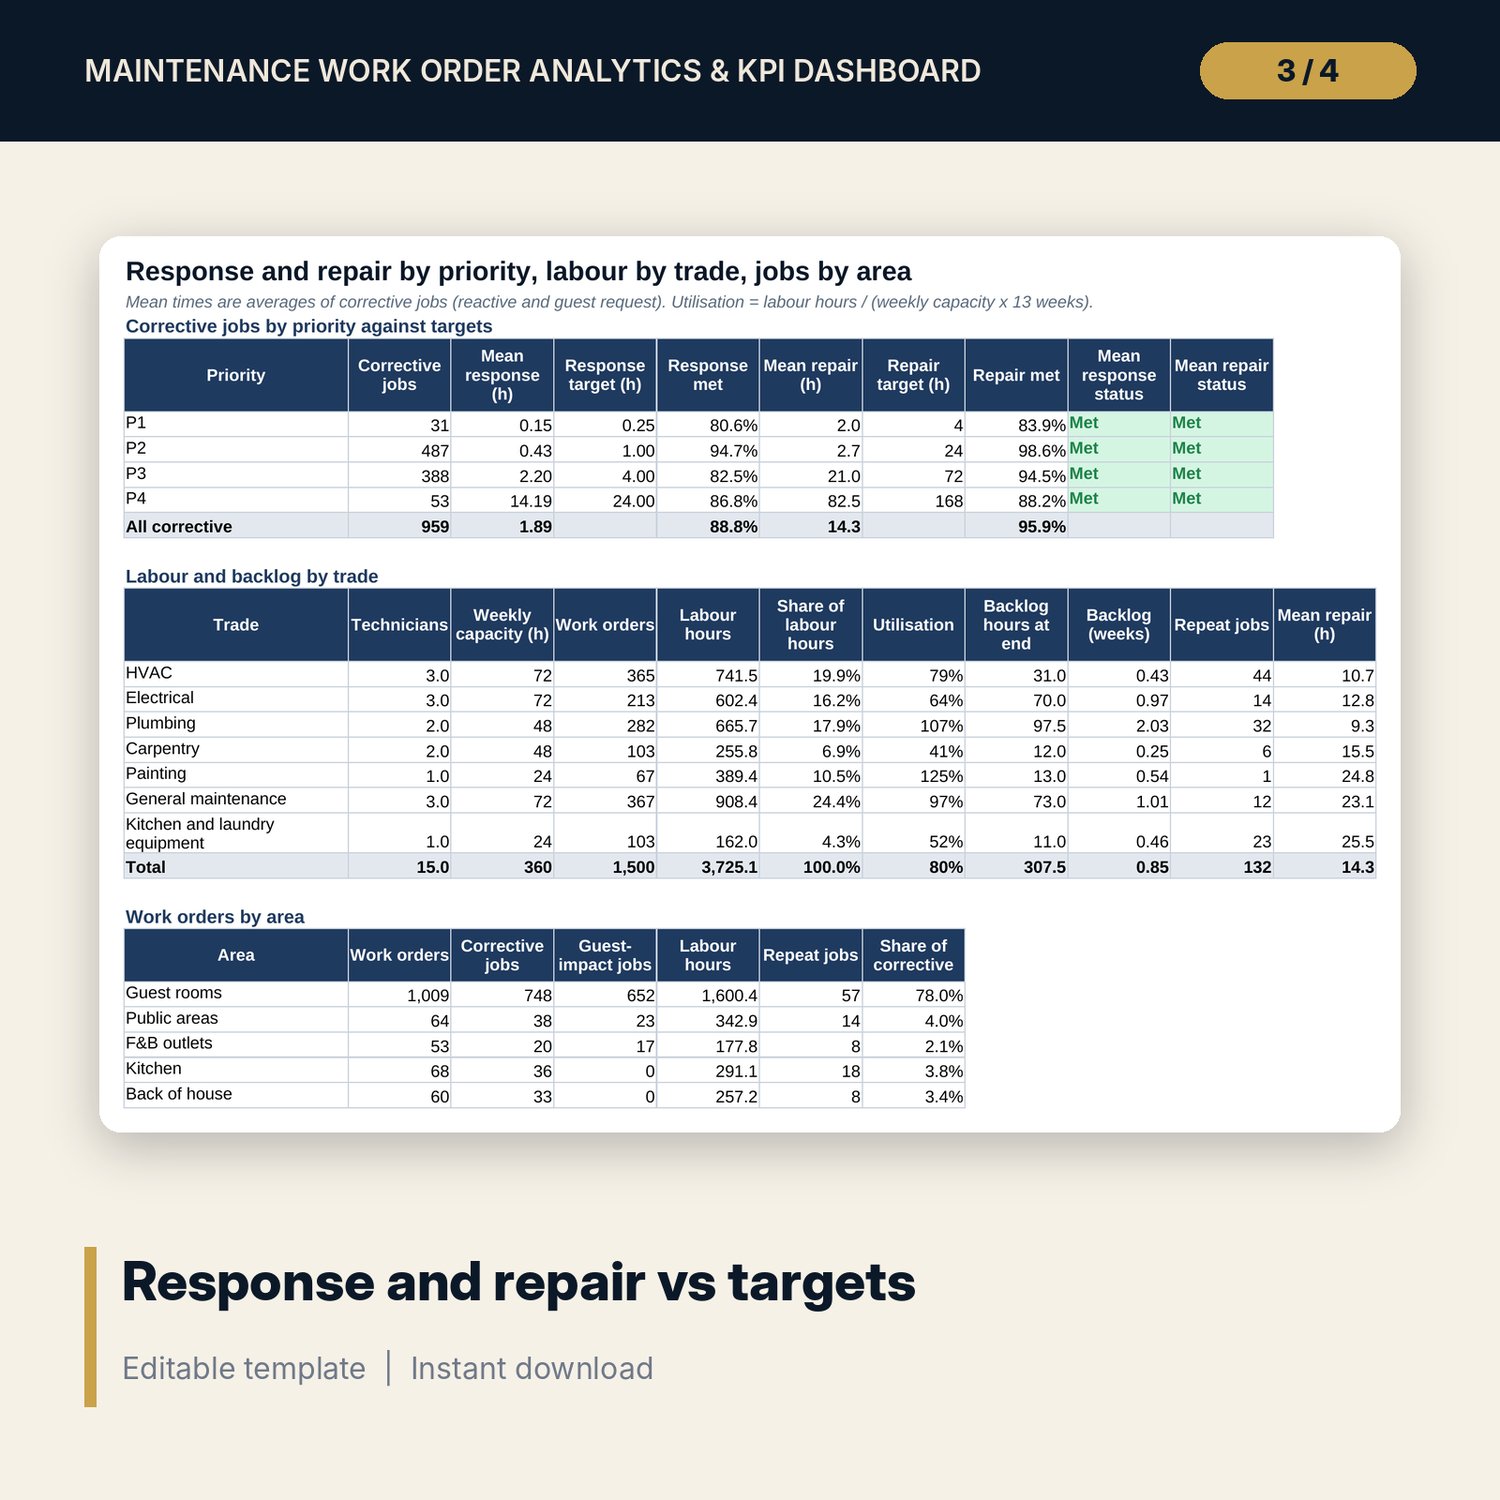
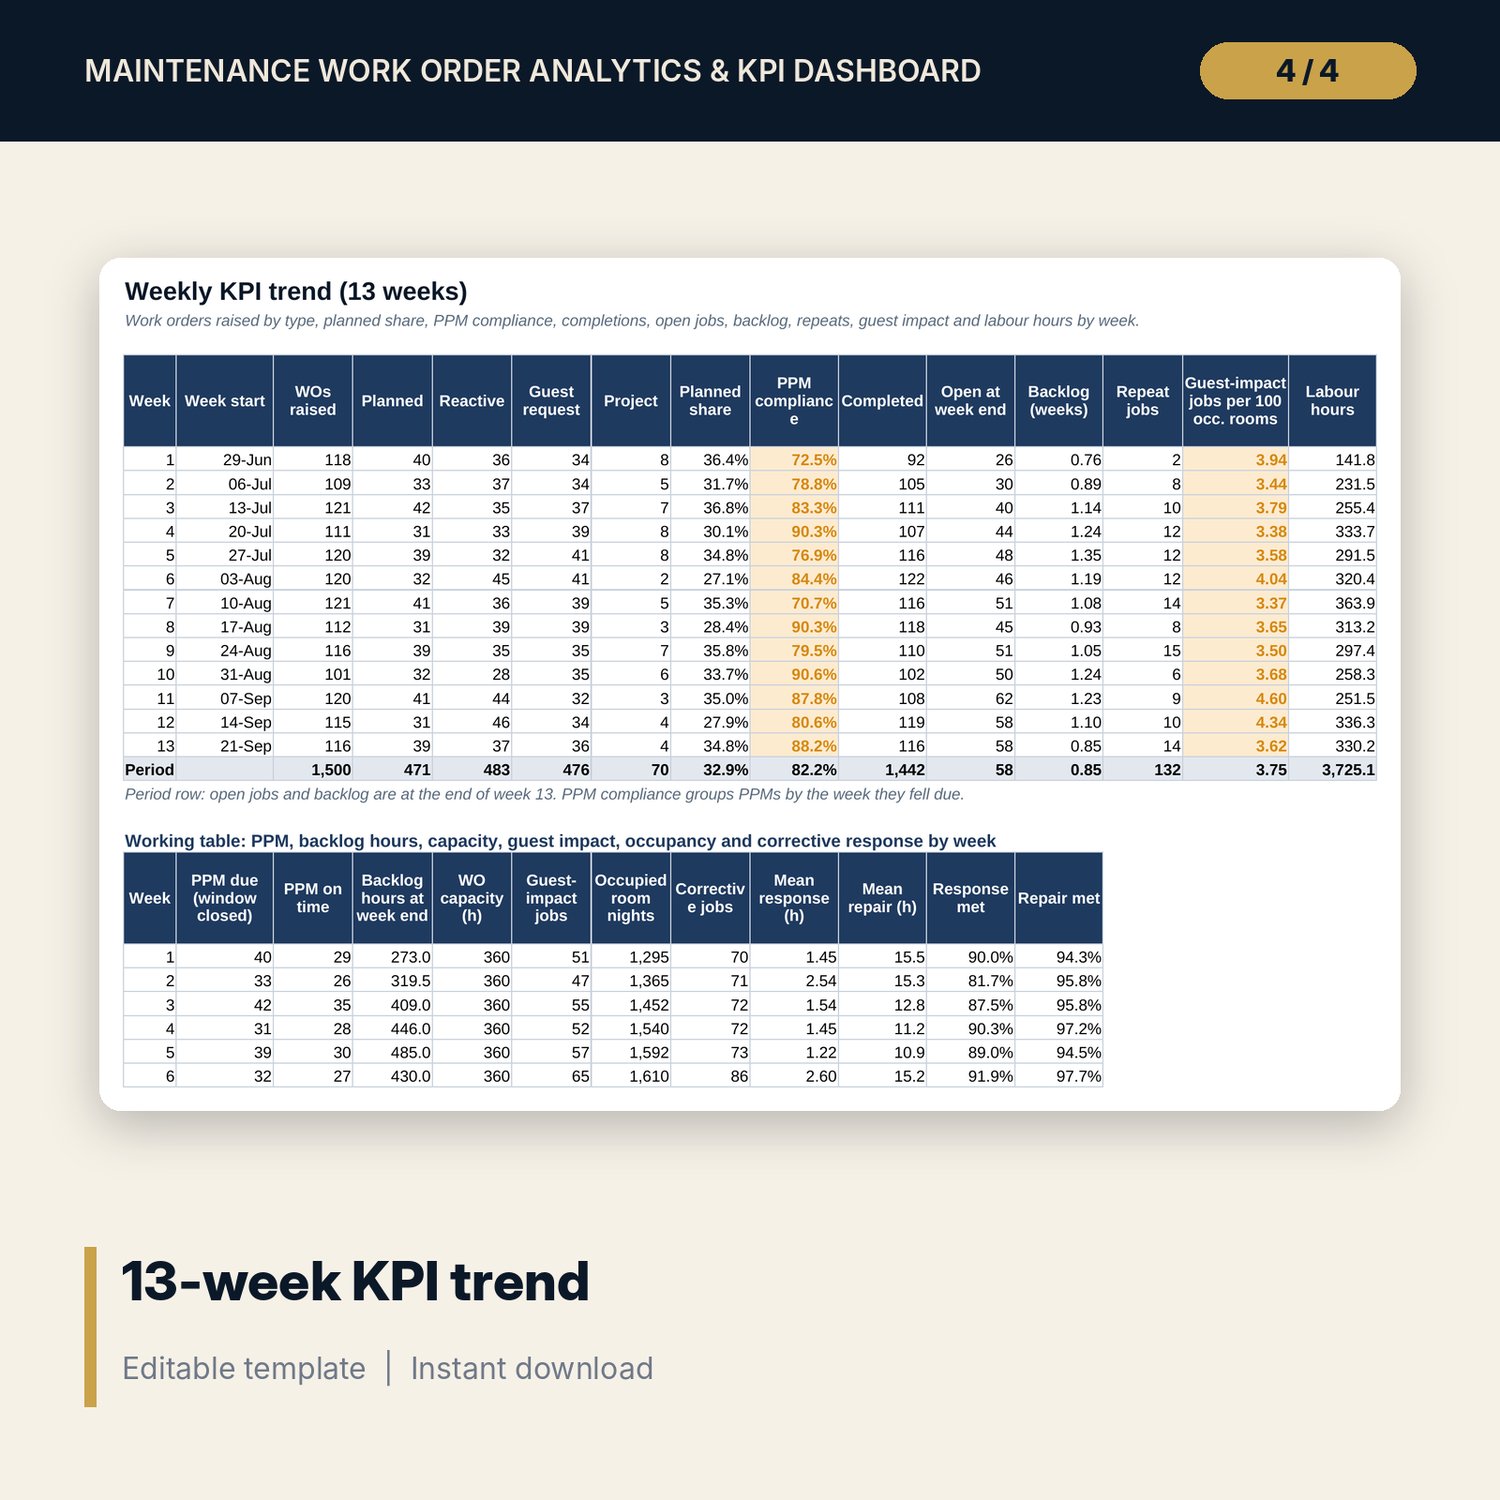
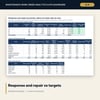
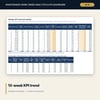
- Weekly_KPIs and Performance: 13-week trend, priority table against targets, labour and backlog by trade, jobs by area and type, top 10 assets.
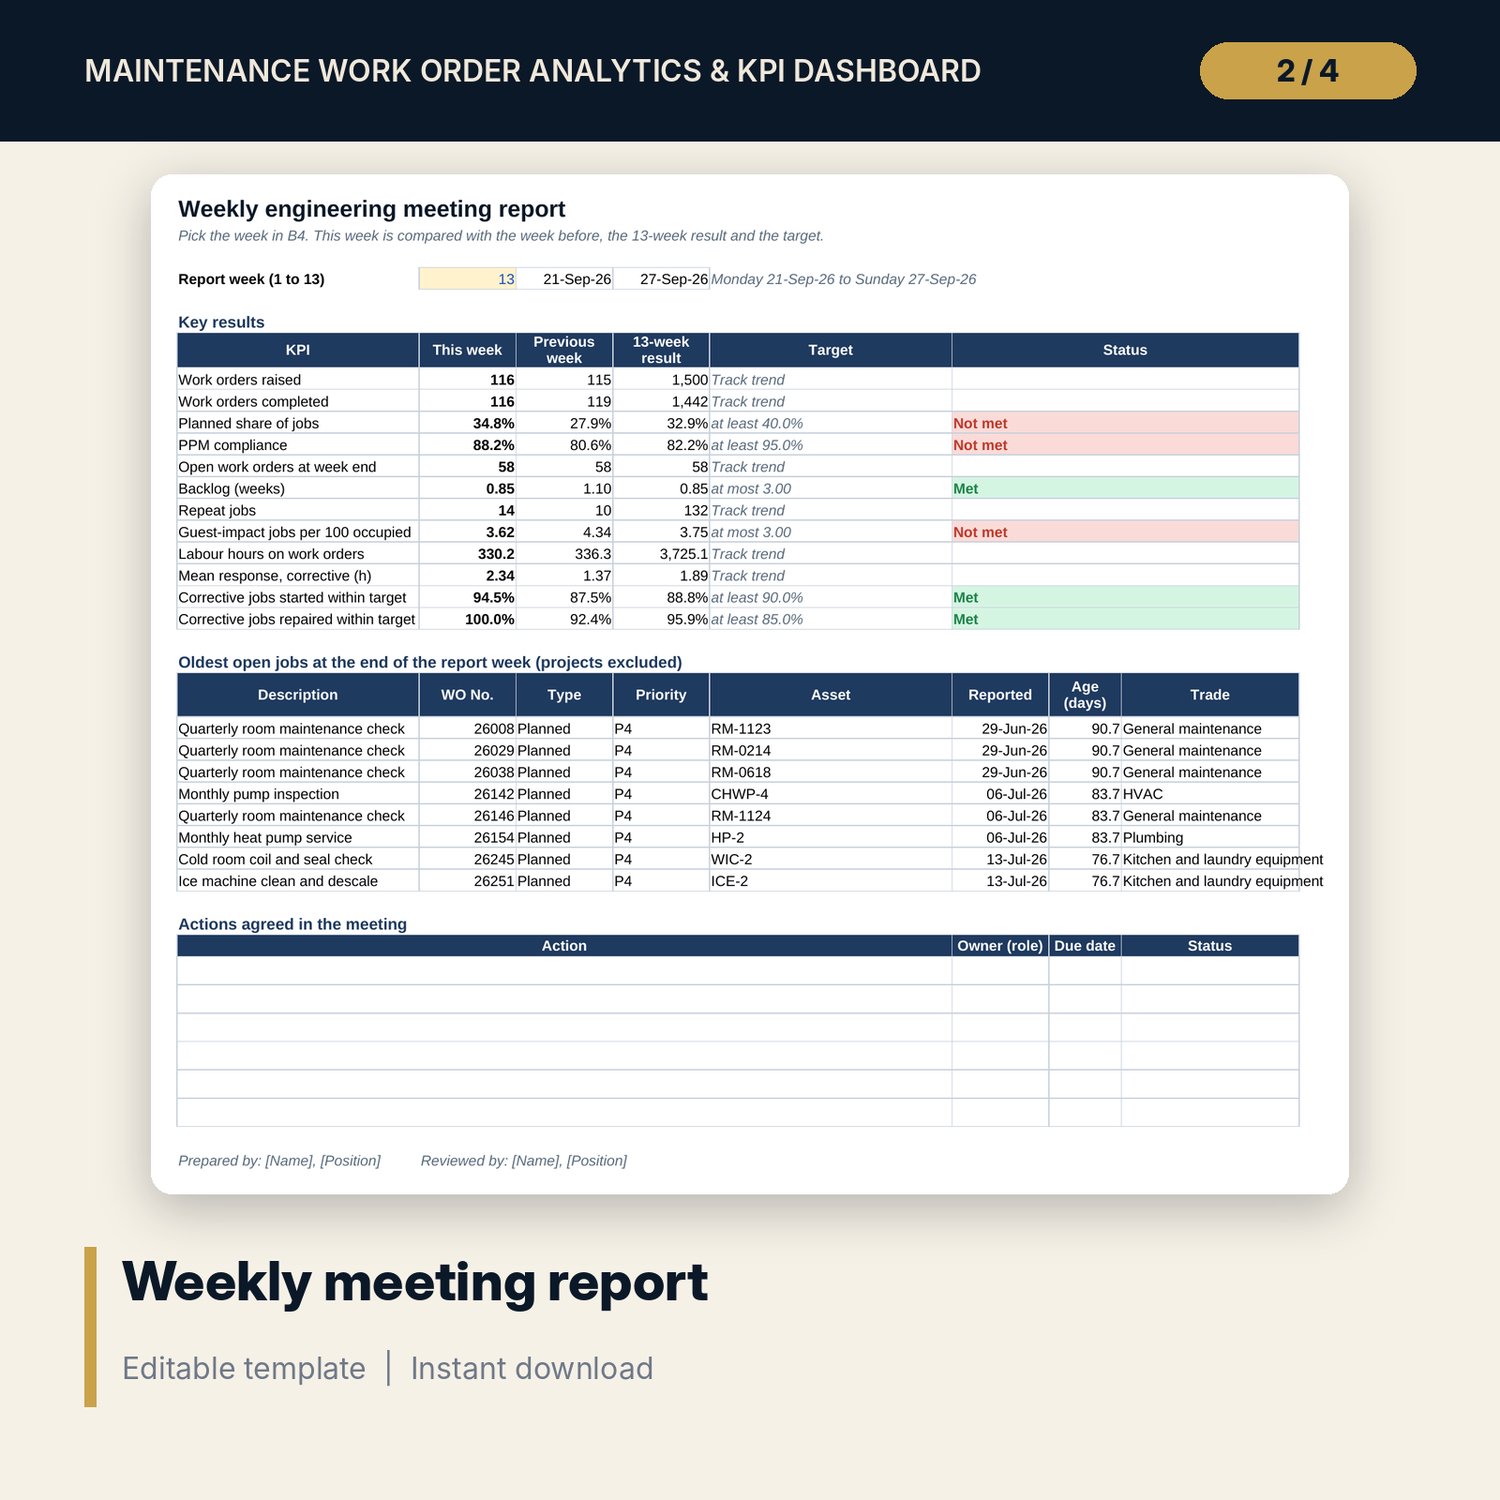
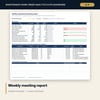
- Weekly_Report: one-page meeting report for any week, with last week, 13-week result, target, status, the 8 oldest open jobs and an action list.
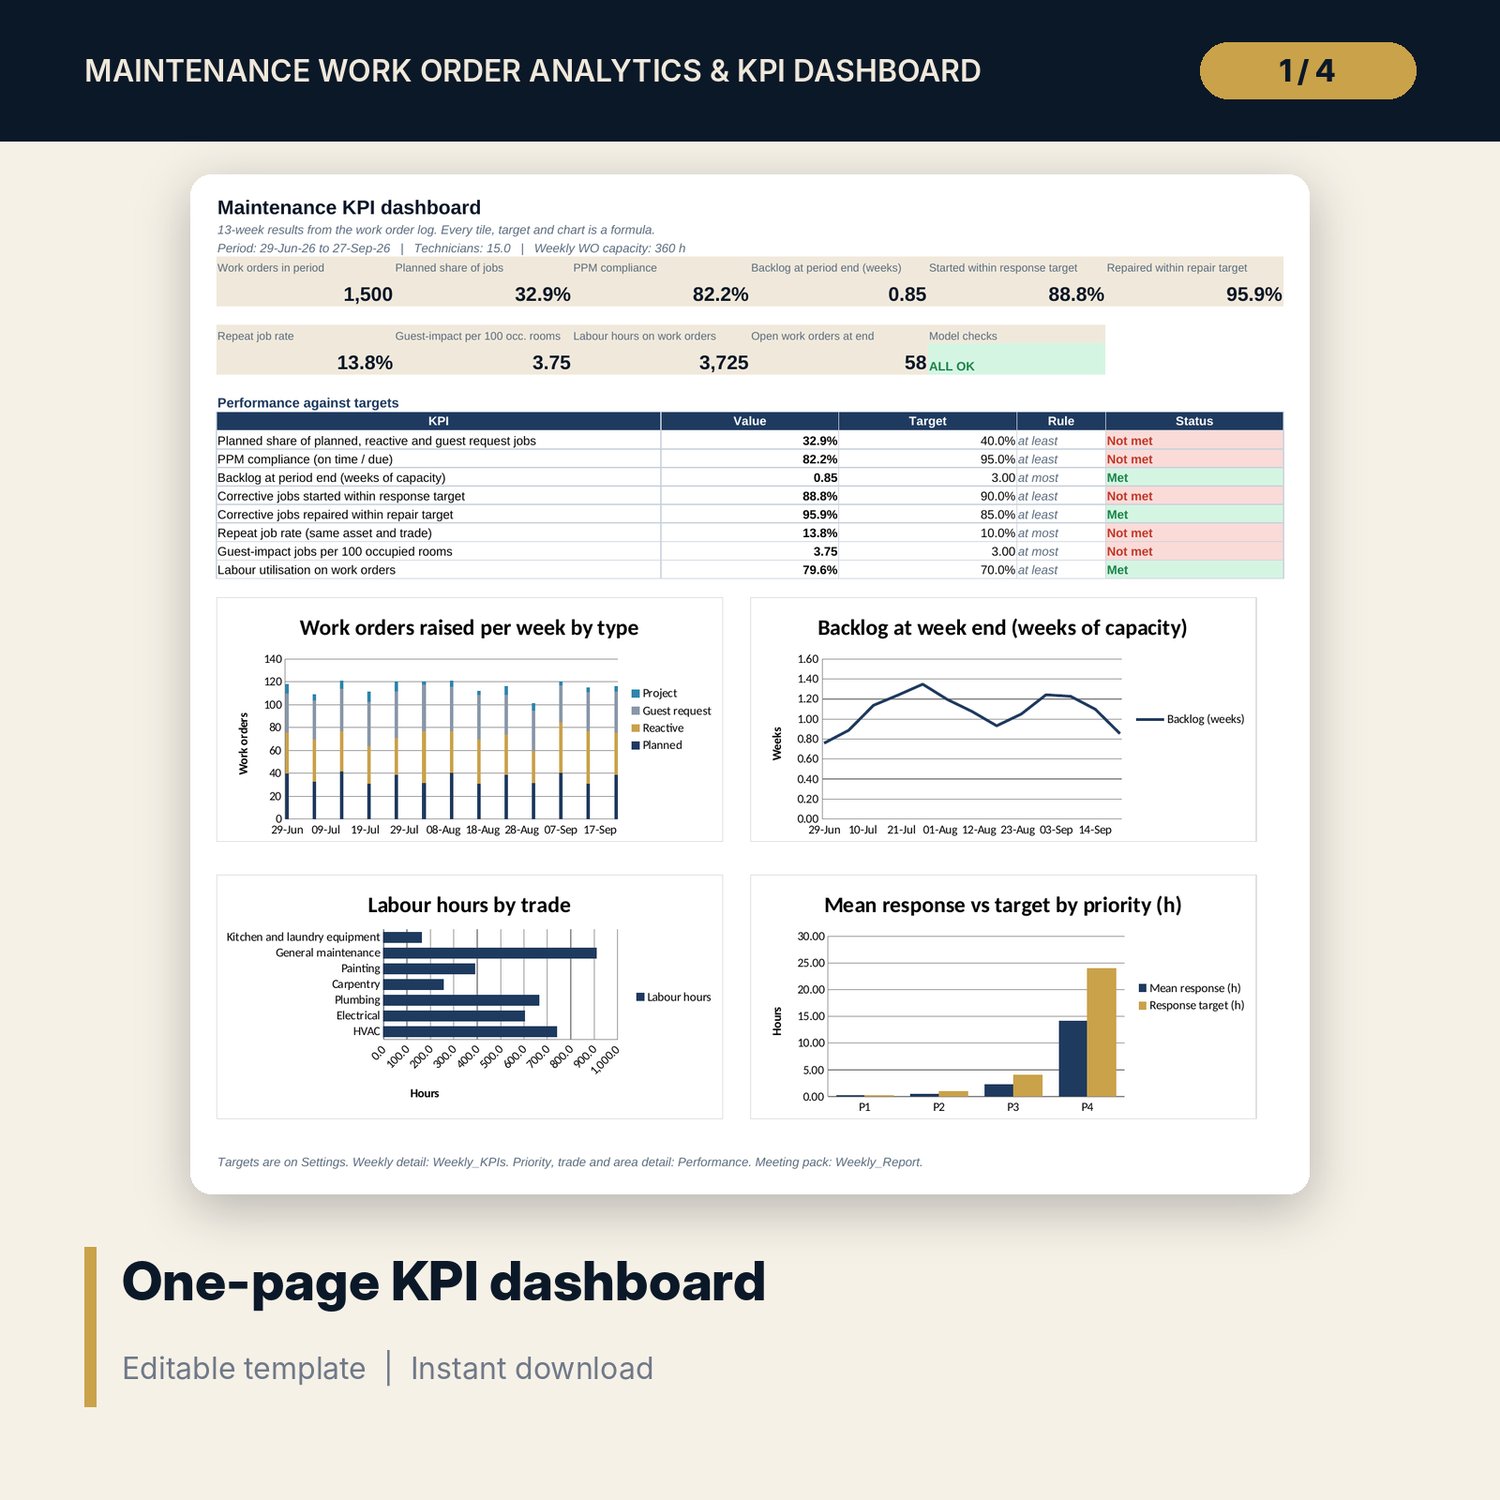
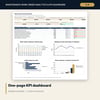
- Dashboard: 10 KPI tiles, a check tile, 8 KPIs against targets and 4 charts, printable on one page.
- README.txt and LICENSE-and-Terms.txt.
How it works
- Enter the period start, technicians by trade, priority targets, weekly occupied room nights and KPI targets on Settings.
- Replace the sample asset register and paste your work orders into Work_Orders.
- Confirm the Checks tab shows ALL OK, then read Weekly_KPIs, Performance and the Dashboard.
- Pick the report week on Weekly_Report, print it for the meeting and record the actions.
Details
- Format: XLSX workbook, one file.
- Language: English.
- Software: Excel 2016 or later, or LibreOffice Calc. No macros, no data tables, no add-ins.
- One 13-week period per file. Save a copy for each quarter.
- Delivery: instant download.
Good to know
- Sample data is illustrative and does not describe any property. Replace it with your own work orders.
- Targets are examples. Set your own engineering standards and verify local requirements for statutory maintenance.
- Not engineering or safety advice. The workbook measures what your records show.
- Single-user license.
FAQ
Can I use the export from my maintenance system?
Yes. Paste or import the columns into Work_Orders. Dates must be real date-times, and each asset ID must exist in the Assets tab, or the Checks tab flags it.
How is a repeat job defined?
A corrective job is a repeat when the same asset had a corrective job for the same trade within the repeat window before it. You set the window in days on Settings.
How is backlog in weeks calculated?
Estimated hours of the jobs still open divided by your weekly work order capacity. Capacity is technicians x paid hours x the share of hours available for work orders.
Can I analyse more than 13 weeks?
Not in one file. The weekly tables hold 13 weeks. Use one copy per quarter and compare the dashboards.
Does it show which assets cost the most time?
Yes. Performance ranks the top 10 assets by corrective jobs and repeat jobs, and Assets shows labour hours for every asset.