



Hotel Lease vs Management vs Franchise Comparison Model: compare hotel operating structures on owner NPV, IRR and risk
Full description
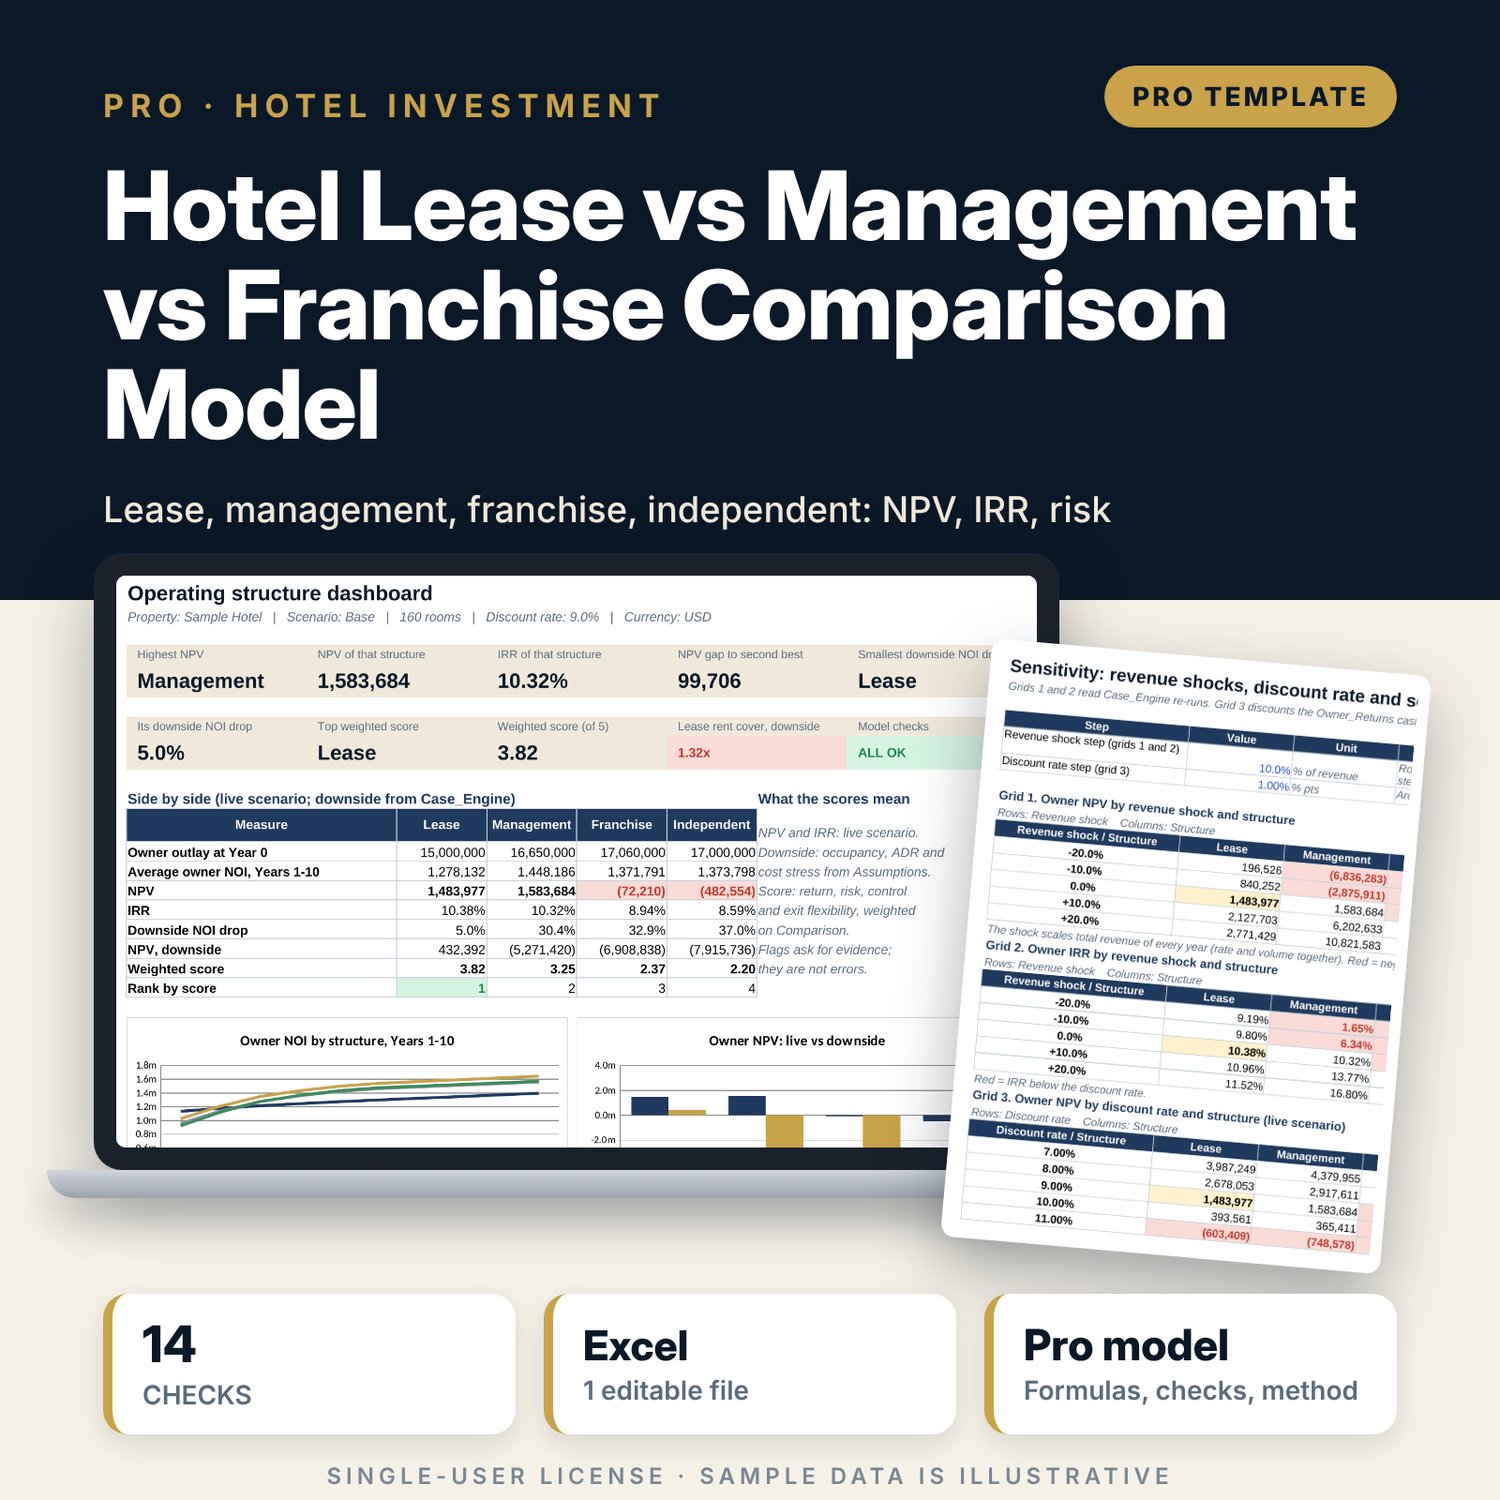
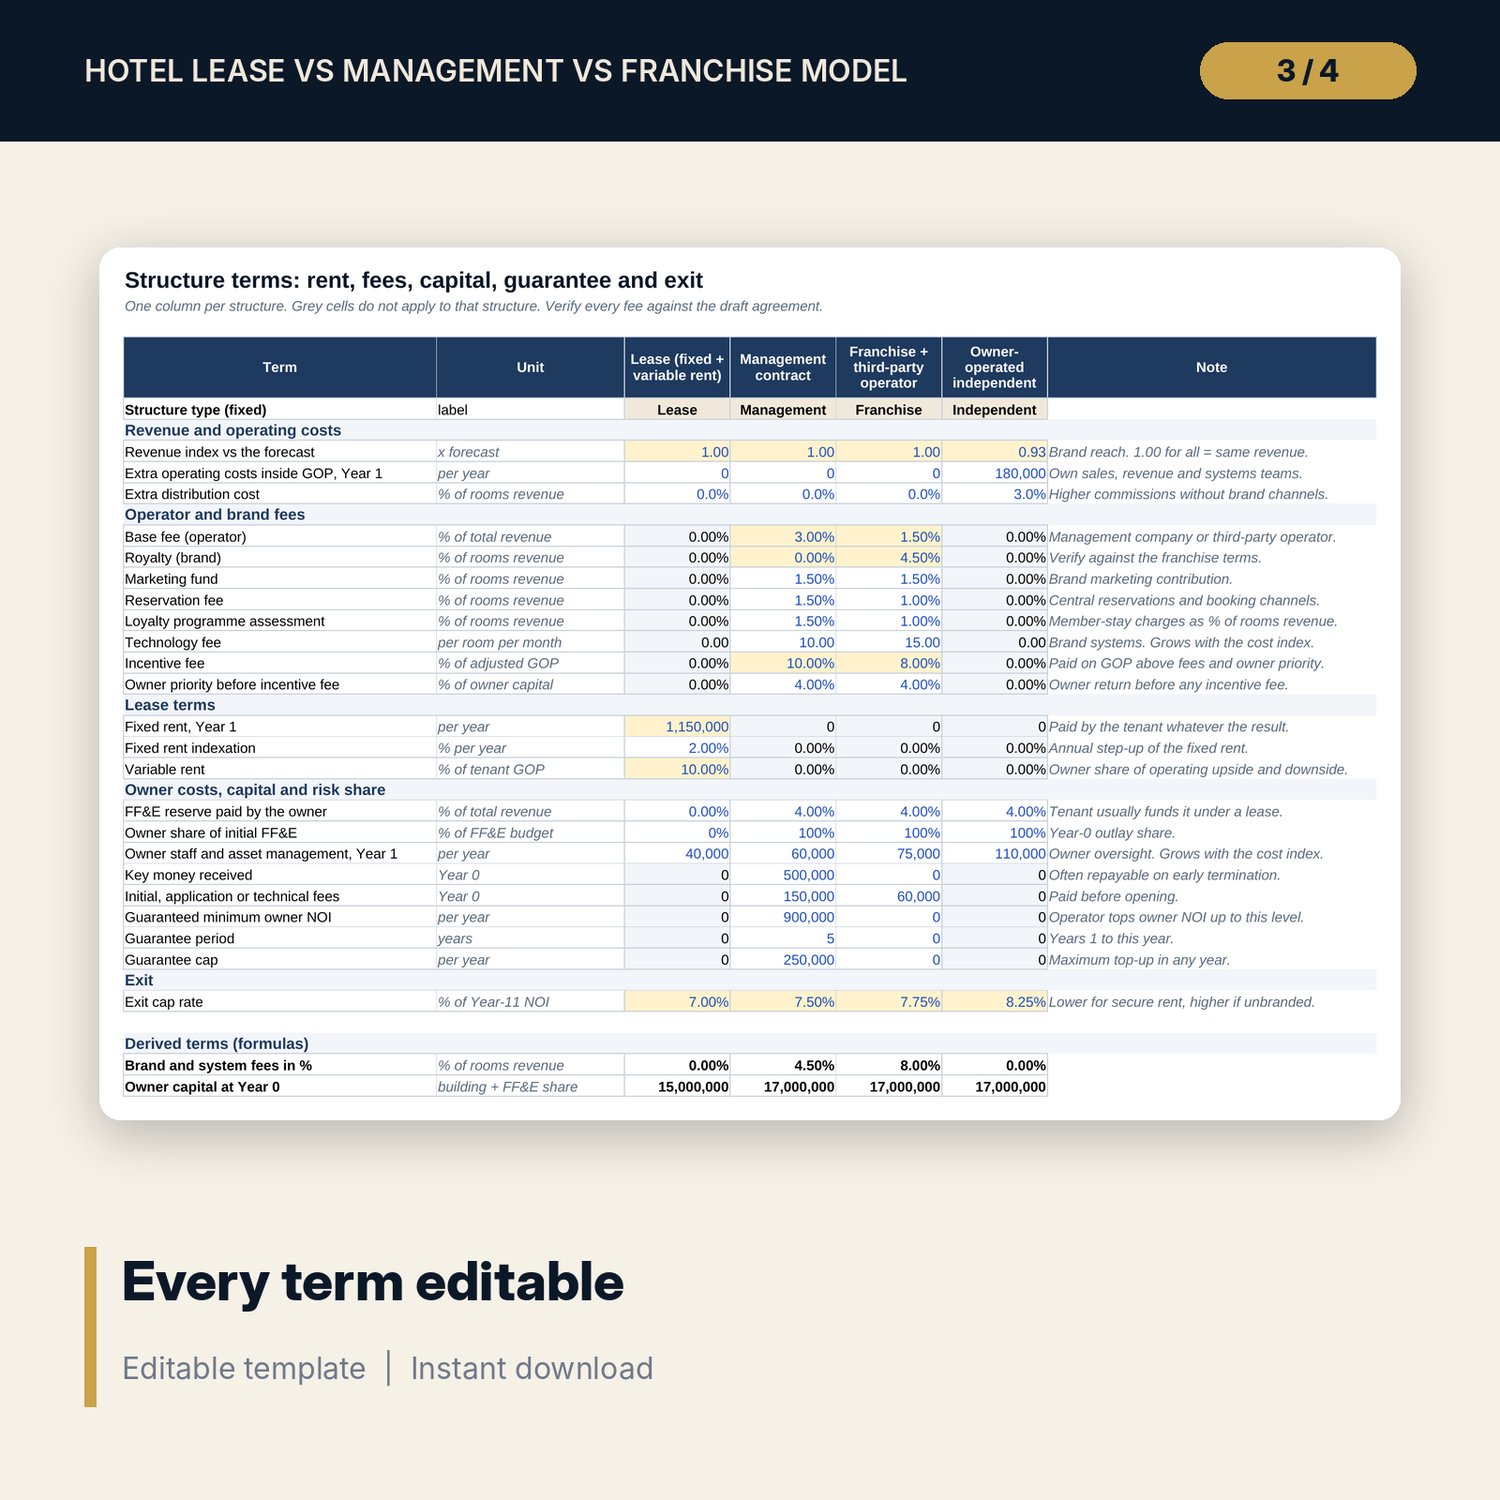
For owners, asset managers, developers and general managers who must choose how a hotel will be operated. One 11-year revenue and cost forecast feeds four structures: a fixed + variable lease, a management contract (base fee, system fees, incentive fee after an owner priority, key money and a capped NOI guarantee), a franchise run by a third-party operator (royalty, marketing, reservation, loyalty and technology fees plus operator fees) and an owner-operated independent hotel (no fees, a lower revenue index and its own sales and distribution costs). For each structure the workbook calculates owner income, owner NOI, Year-0 capital, exit value at its own cap rate, cash flow, NPV, IRR and equity multiple. A one-case-per-row engine re-runs every structure 8 times to measure the downside NOI drop, NPV range and rent cover, and to fill grids by revenue shock and discount rate. A score matrix with editable weights ranks the structures on return, risk, control and exit flexibility.
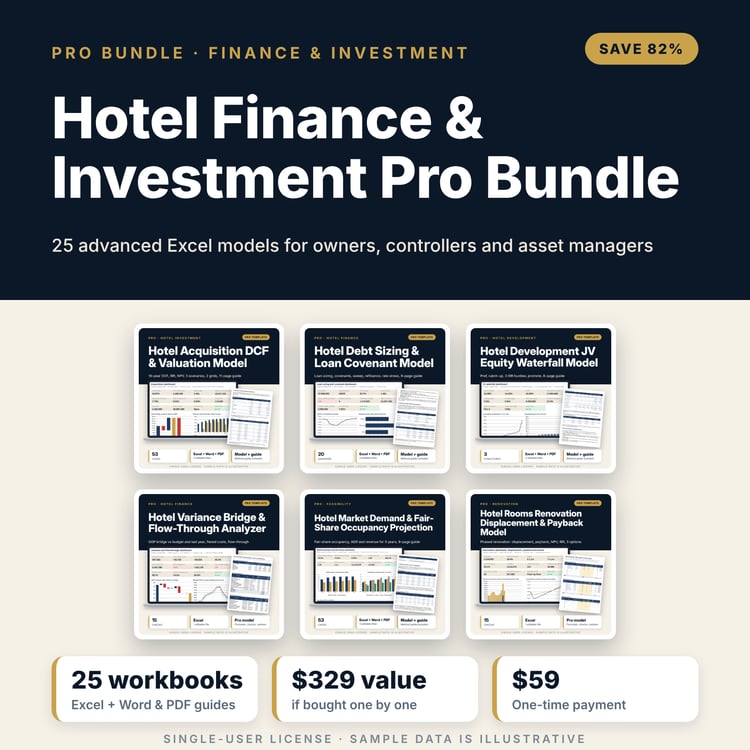
Save with a bundle: this workbook is also in the Hotel Finance & Investment Pro Bundle, 25 workbooks for $59 instead of $329. All 100 Pro workbooks are in the Pro Library for $119, and all 241 templates and workbooks are in the Ultimate Hospitality Library for $149.
What is inside
- Hotel_Lease_Management_Franchise_Comparison.xlsx: 11 tabs, 5,404 formulas, 2 native charts, 14 integrity checks and a Method tab with 16 calculation notes.
- Terms tab with 23 terms for each of the 4 structures, including key money, owner priority, guarantee and exit cap rate.
- Owner_Returns: a full owner P&L and cash flow for each structure, Years 0 to 11 (22 lines per structure).
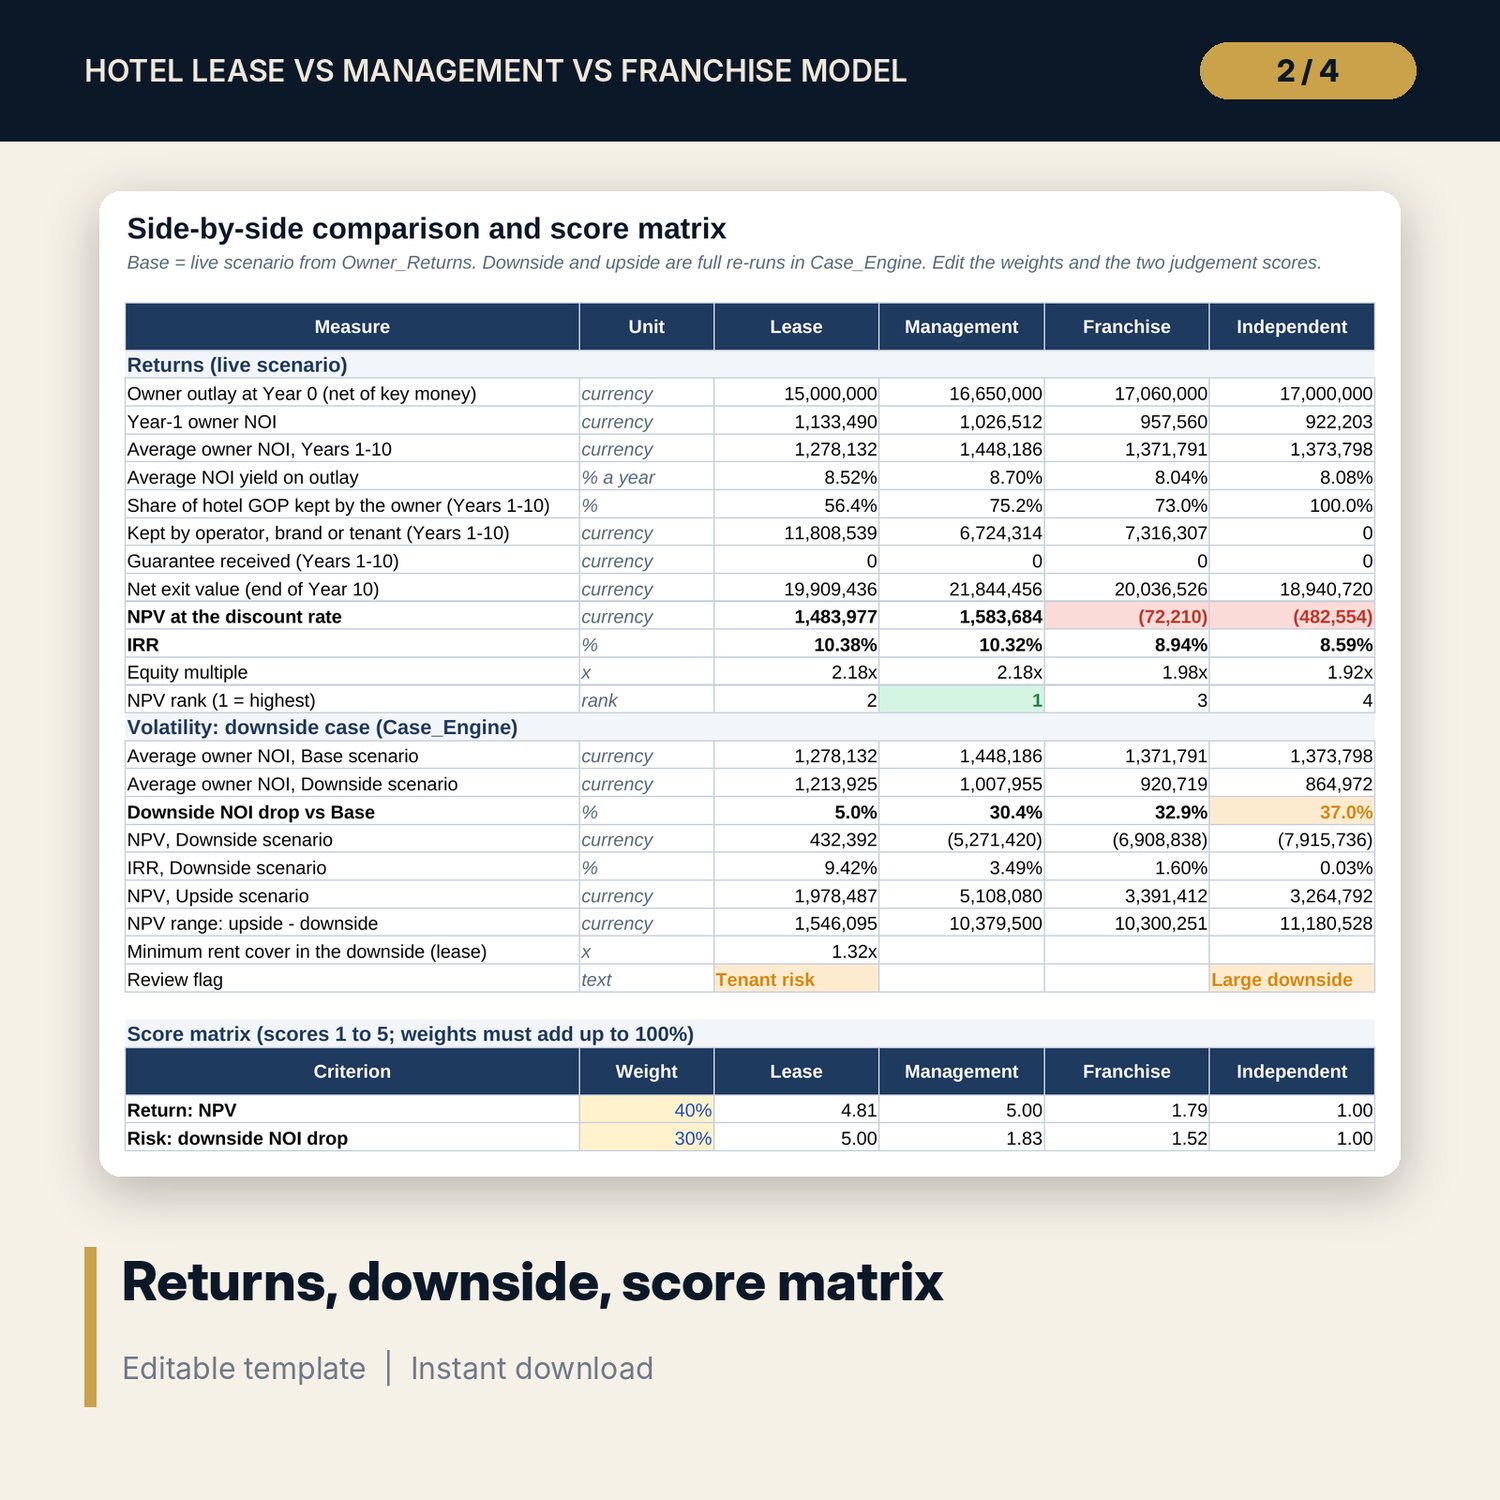
- Comparison: side-by-side returns, downside volatility (NOI drop, downside NPV and IRR, NPV range, rent cover) and a weighted score matrix.
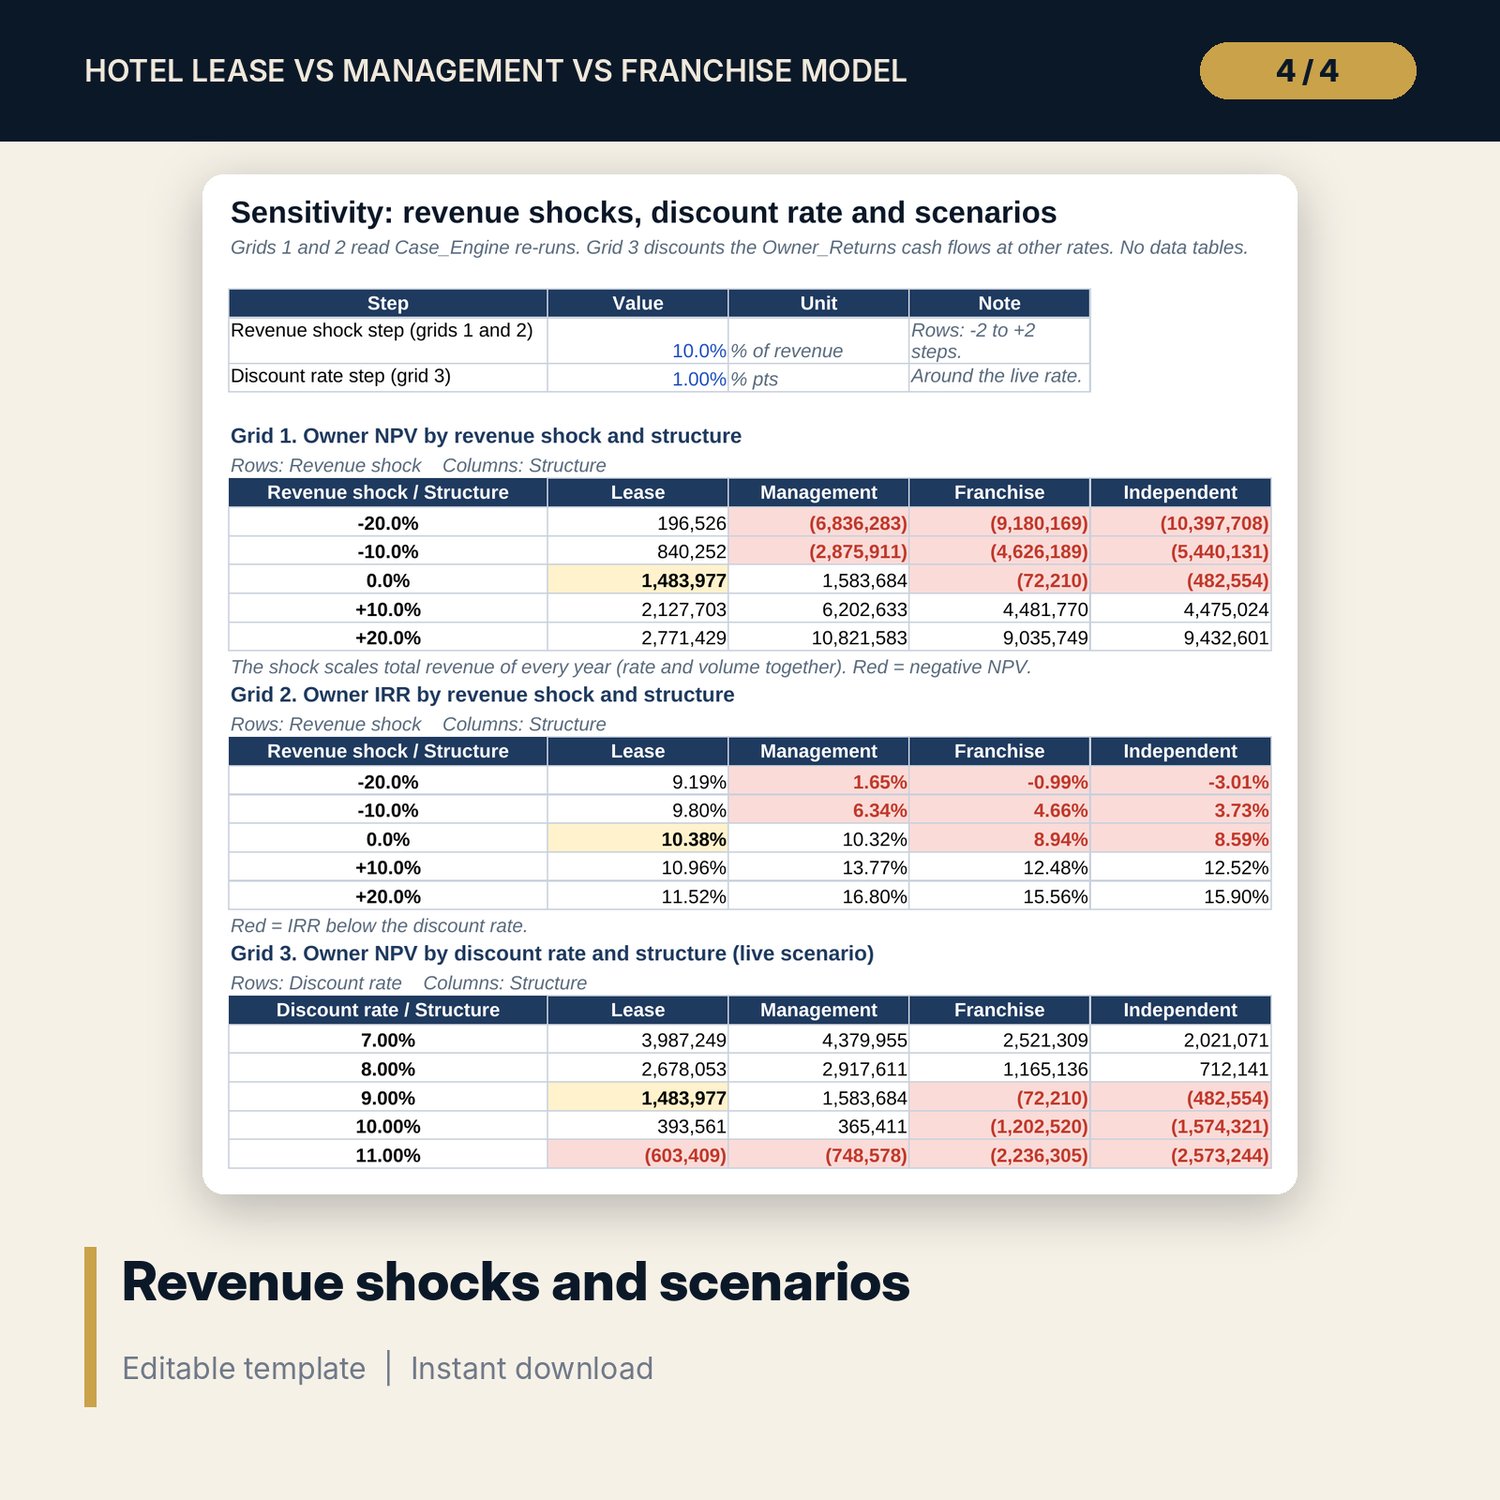
- Sensitivity: NPV and IRR by revenue shock (5 levels x 4 structures), NPV by discount rate, and all 3 scenarios for every structure.
- Case_Engine: 32 complete re-runs of the 10-year model, one per row, with no data tables.
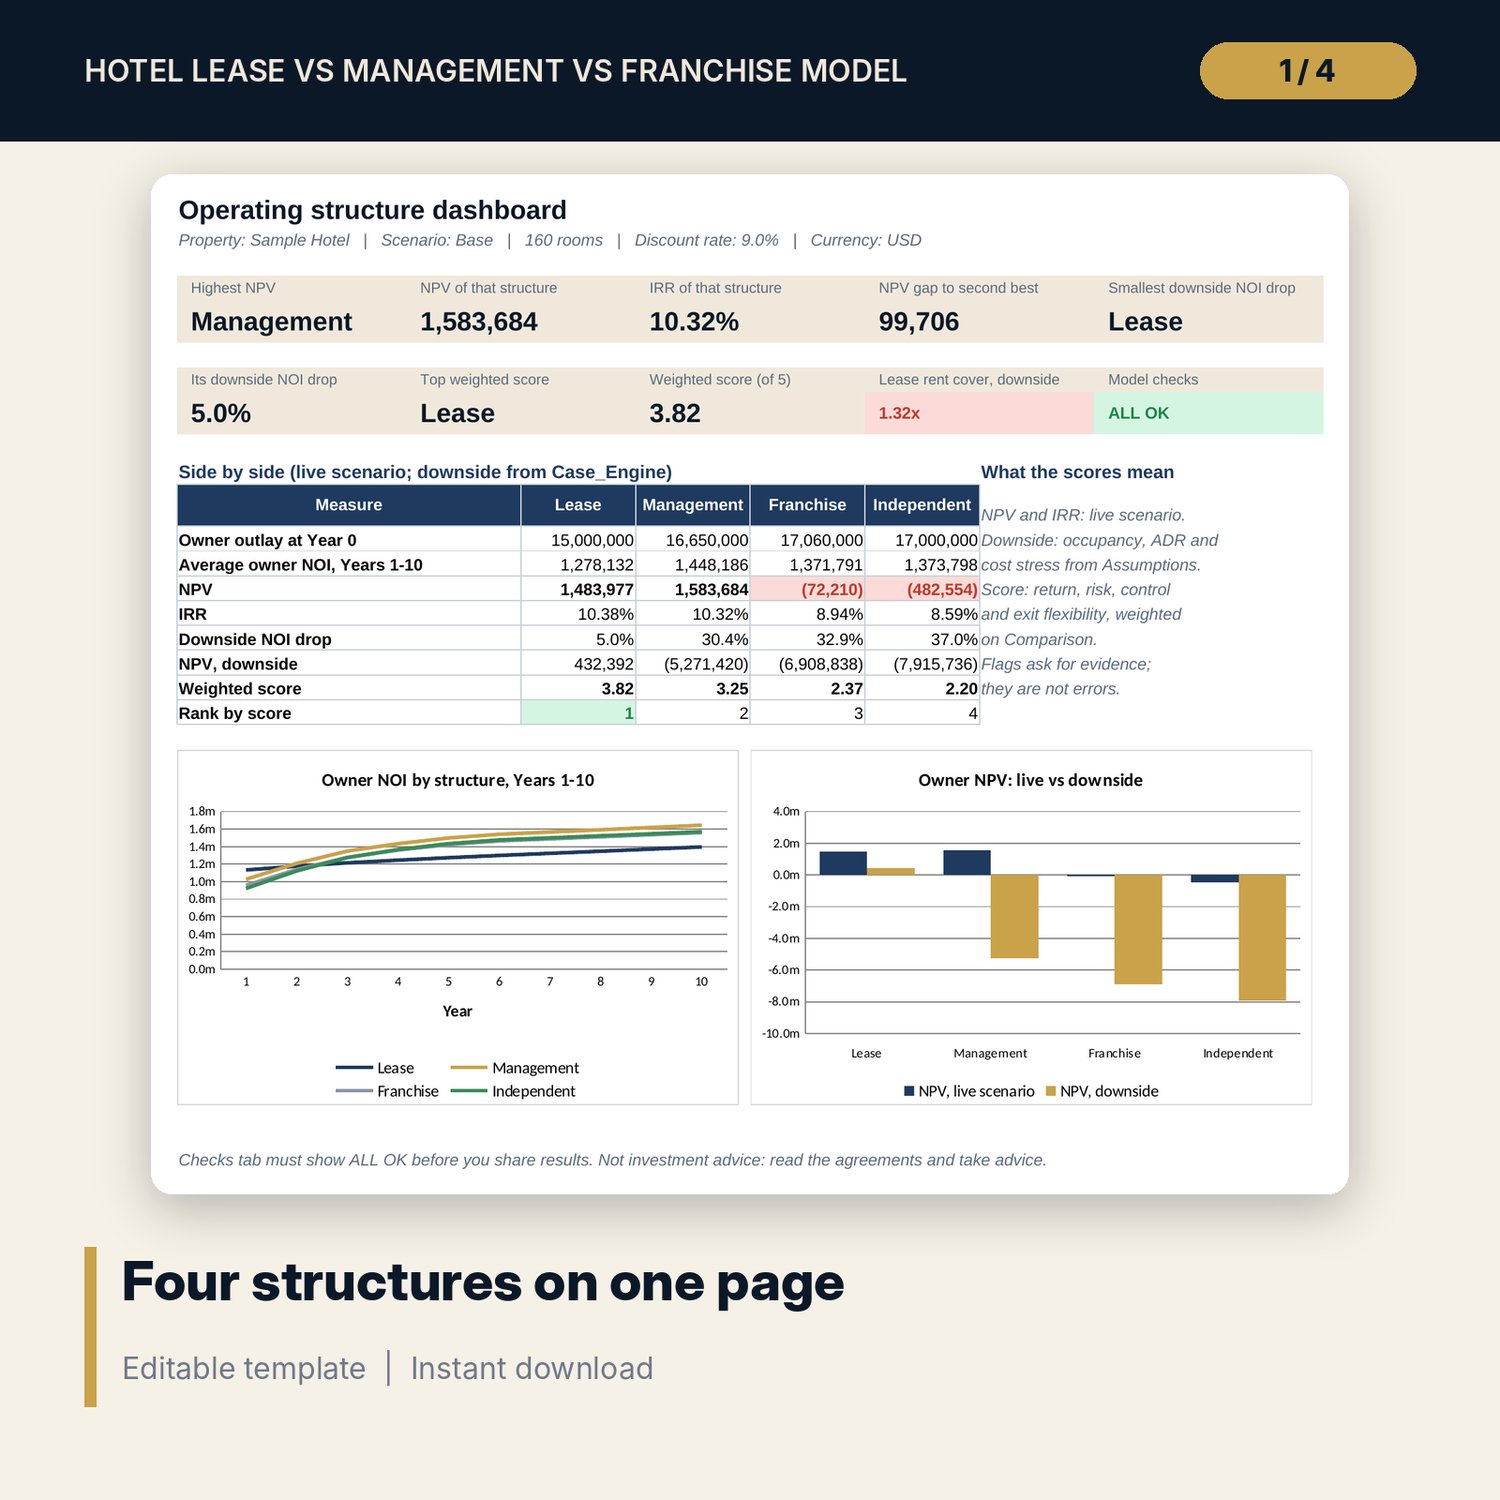
- Dashboard: 9 KPI tiles, a check tile, a side-by-side table, an owner NOI chart and an NPV chart on one page.
- Sample data (illustrative): 160-room hotel, 10-year hold, 3 scenarios.
- README.txt and LICENSE-and-Terms.txt.
How it works
- Enter the hotel forecast, owner charges, capital and discount rate on Assumptions and Forecast.
- Enter the offer for each structure on Terms: rent, fees, key money, guarantee, owner priority and exit cap rate.
- Read owner NOI, NPV and IRR side by side on Comparison and the Dashboard.
- Check the downside NOI drop and the grids, then set the score weights for return, risk, control and exit flexibility.
- Confirm the Checks tab shows ALL OK before you share the results.
Details
- Format: one XLSX workbook, English.
- Software: Excel 2016 or later, or LibreOffice Calc. No macros, no data tables, no add-ins.
- Annual model, 10-year hold plus an exit year, unlevered and before income tax, any currency.
- Delivery: instant download.
Good to know
- Sample data is illustrative. Replace it with your own forecast and the terms you are offered.
- Not investment, legal or tax advice. Fee definitions differ between agreements: verify every term against the draft contract and local requirements.
- The score matrix supports a decision; control and exit scores are your judgement.
- Single-user license.
FAQ
Can I compare two management offers instead of four structures?
Yes. Each column on Terms is a full set of terms. Enter a second management offer in the franchise column and set its royalty to zero.
How is the downside measured?
Every structure is re-run under the Downside scenario (lower occupancy, slower ADR growth, faster cost inflation). The workbook reports the drop in average owner NOI, the downside NPV and IRR, and the lowest rent cover for the lease.
Does it include debt or tax?
No. Cash flows are unlevered and before income tax, so the structures are compared on the same basis. Add financing in your own model.
Why does each structure have its own exit cap rate?
Buyers price secure lease income, a branded managed hotel and an unbranded owner-run hotel differently. Set the rates from your market evidence.
How do I know the formulas are right?
The Checks tab runs 14 tests, including an independent re-run of every structure that must match the main NPV and IRR.