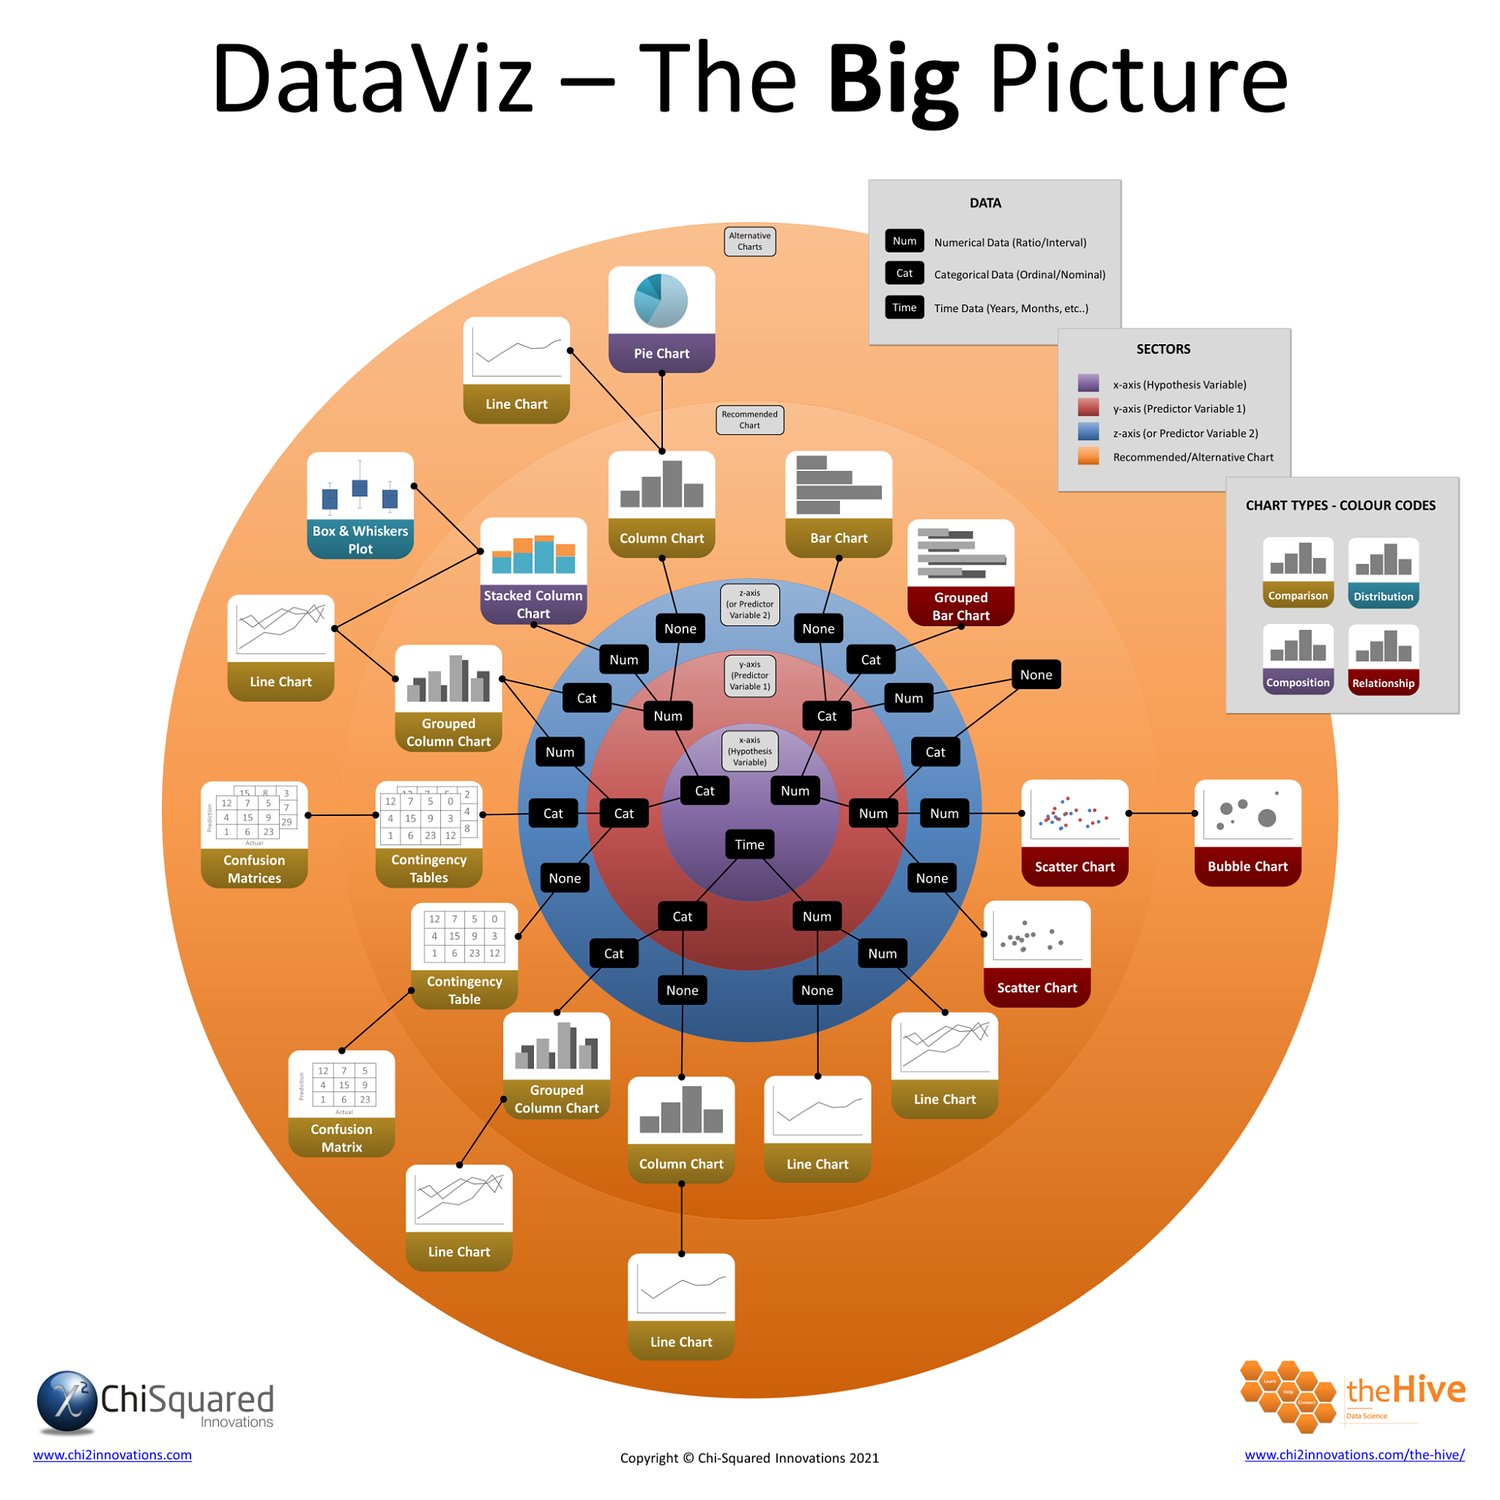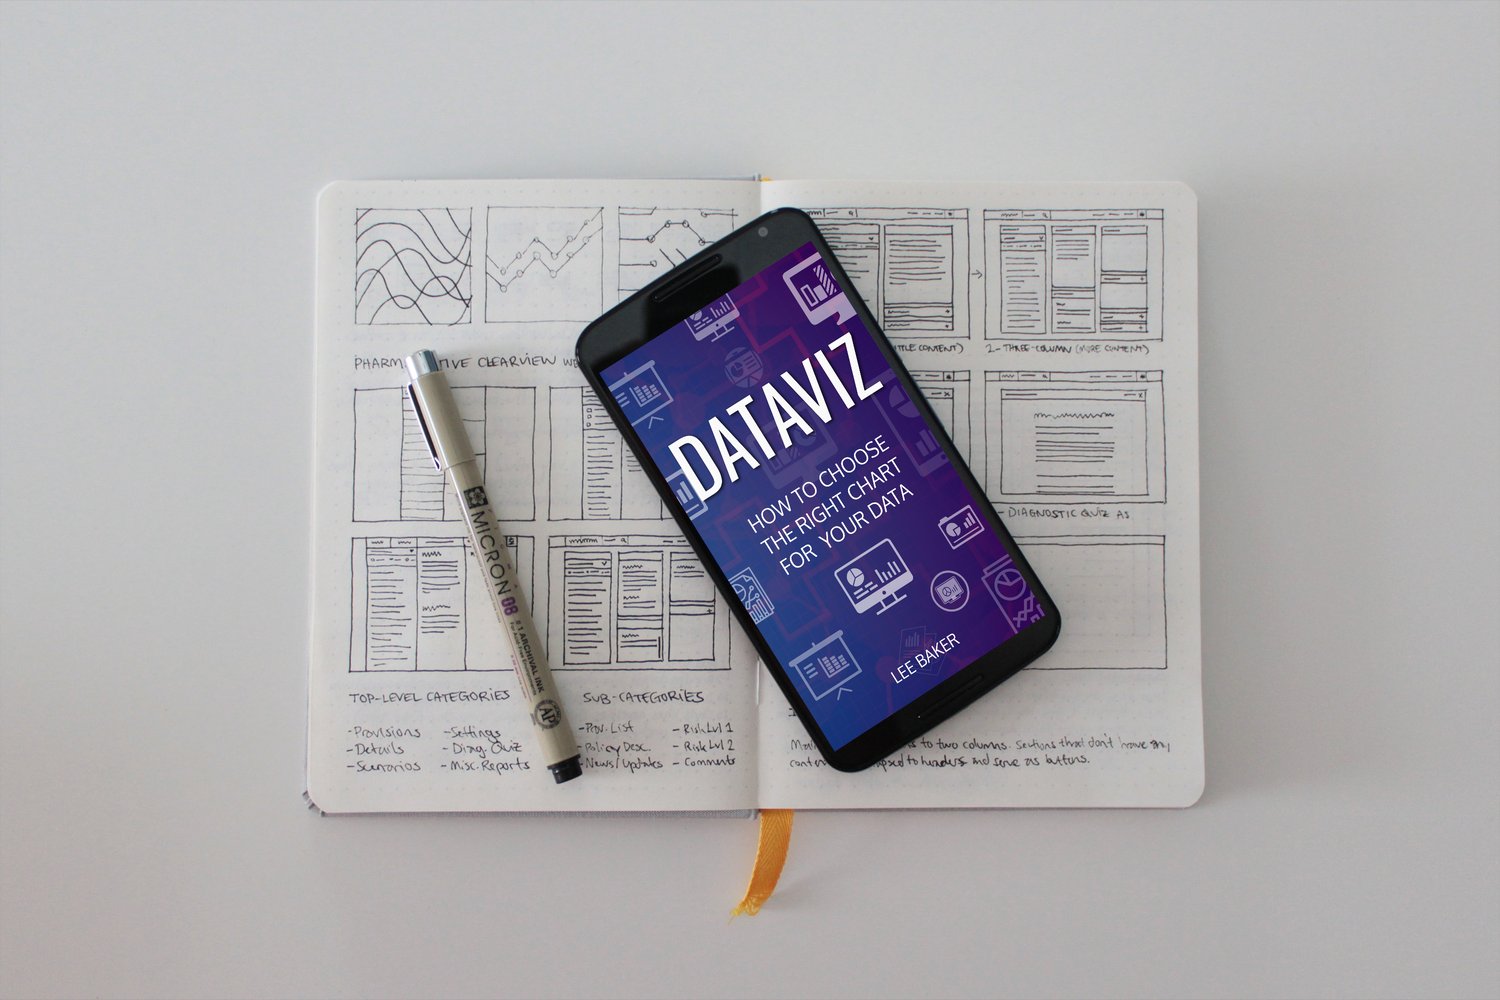


DataViz: How to Choose the Right Chart for Your Data
On Sale
$10.00
$10.00
Discover the world of DataViz.
Get this book, TODAY!