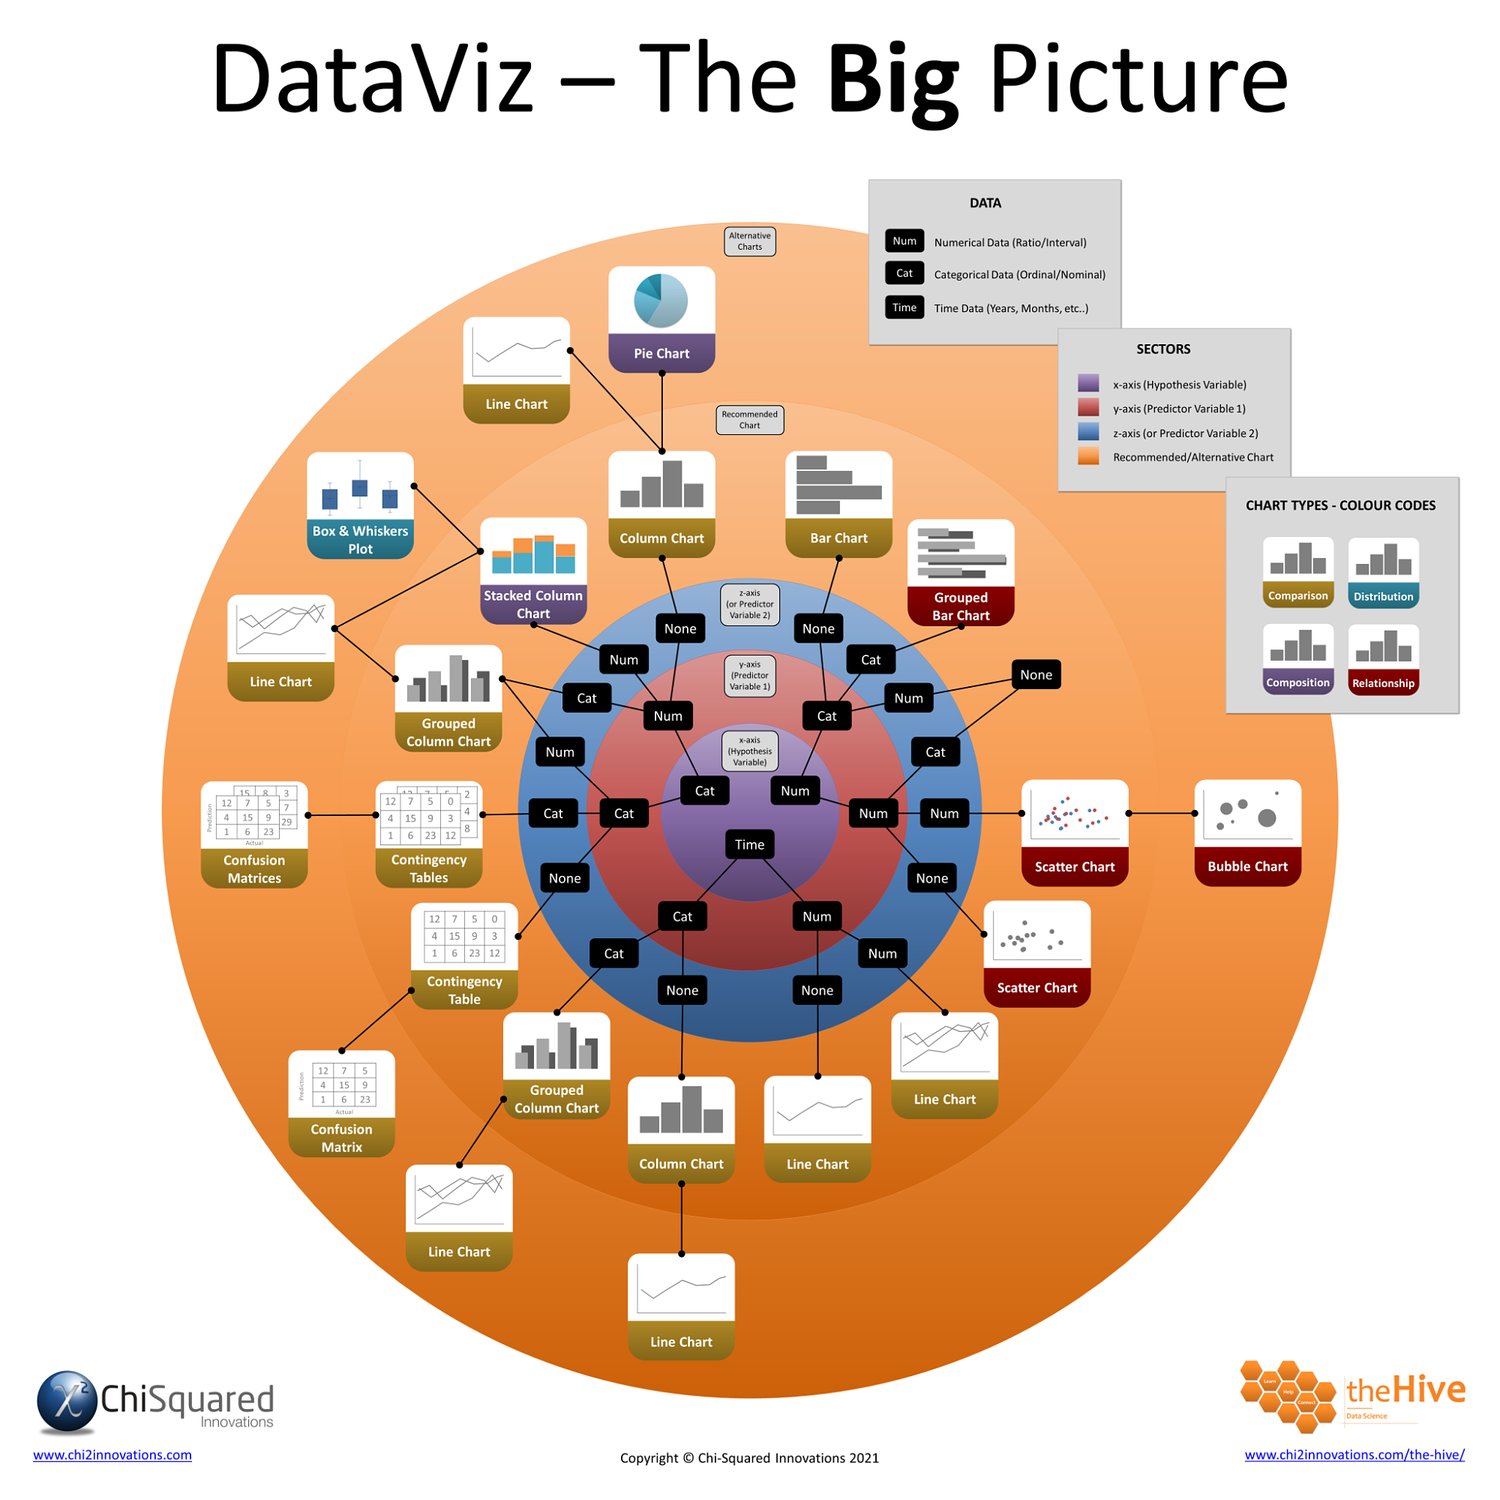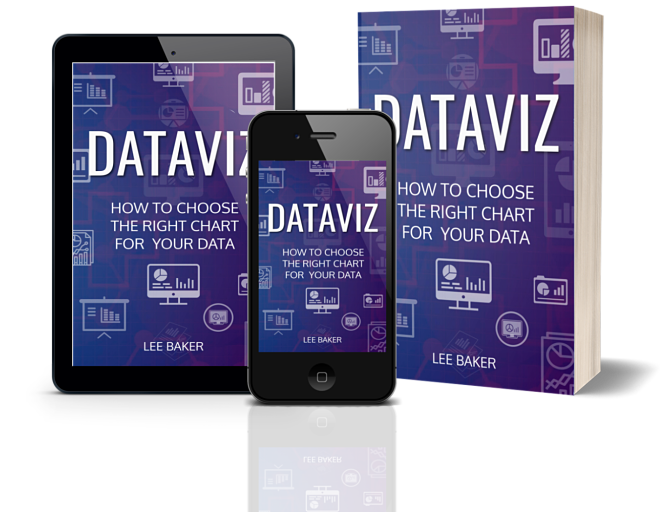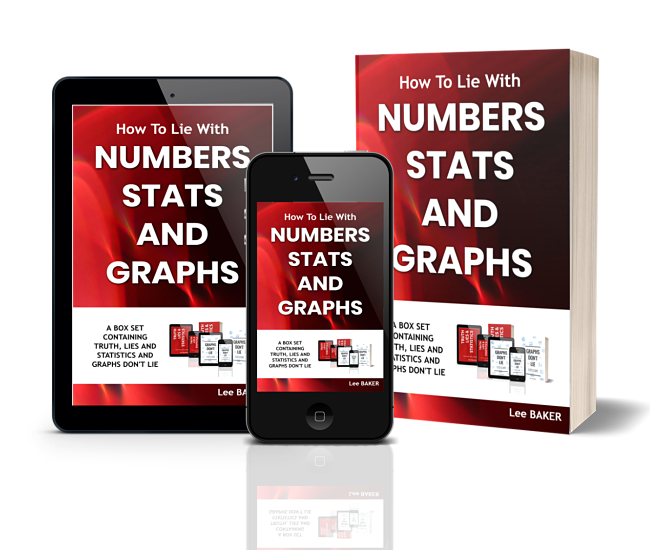


DataViz - The Good, The Bad and The Ugly
On Sale
$30.00
$30.00
⭐⭐⭐⭐⭐
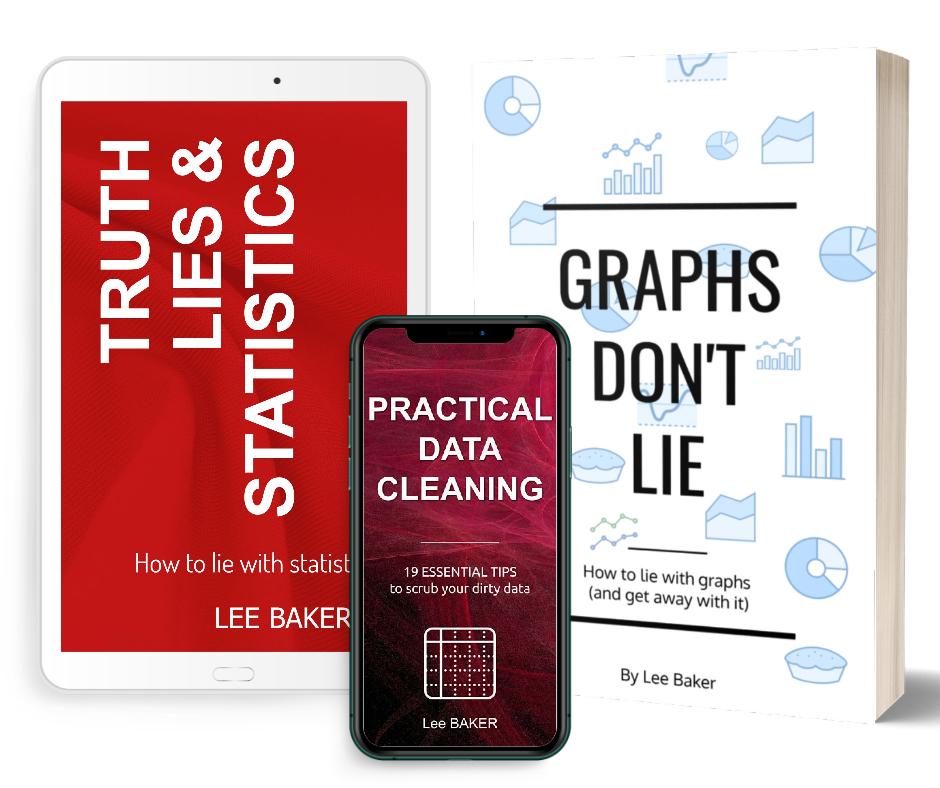
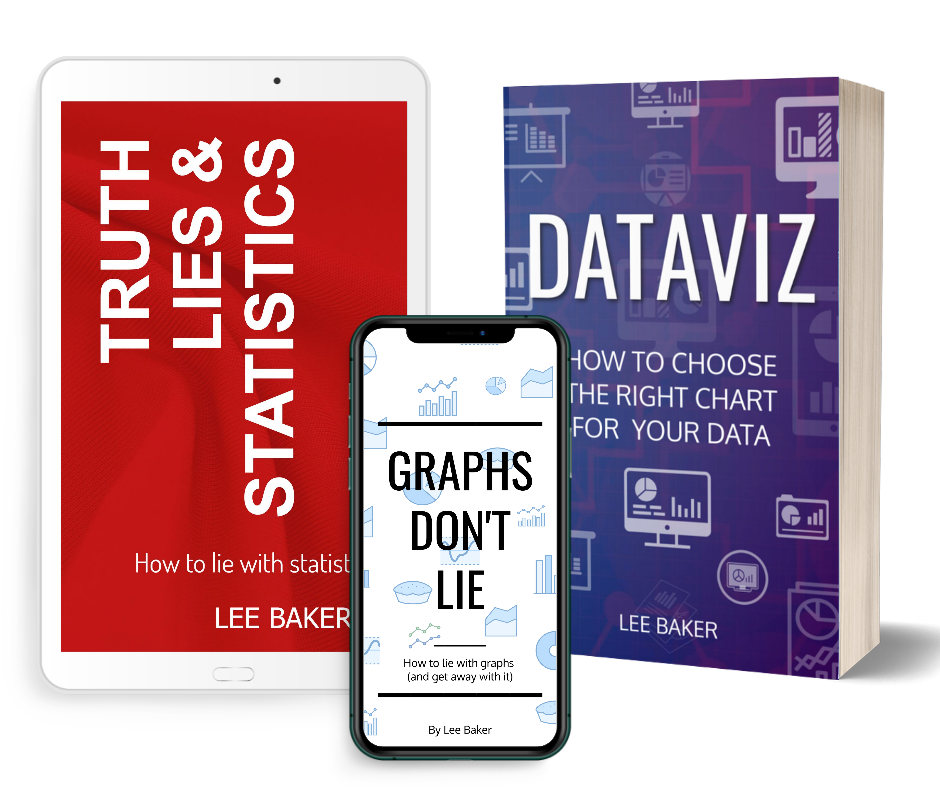
Three Best-Selling Books in One Awesome Bundle:
- DataViz: How to Choose the Right Chart for Your Data
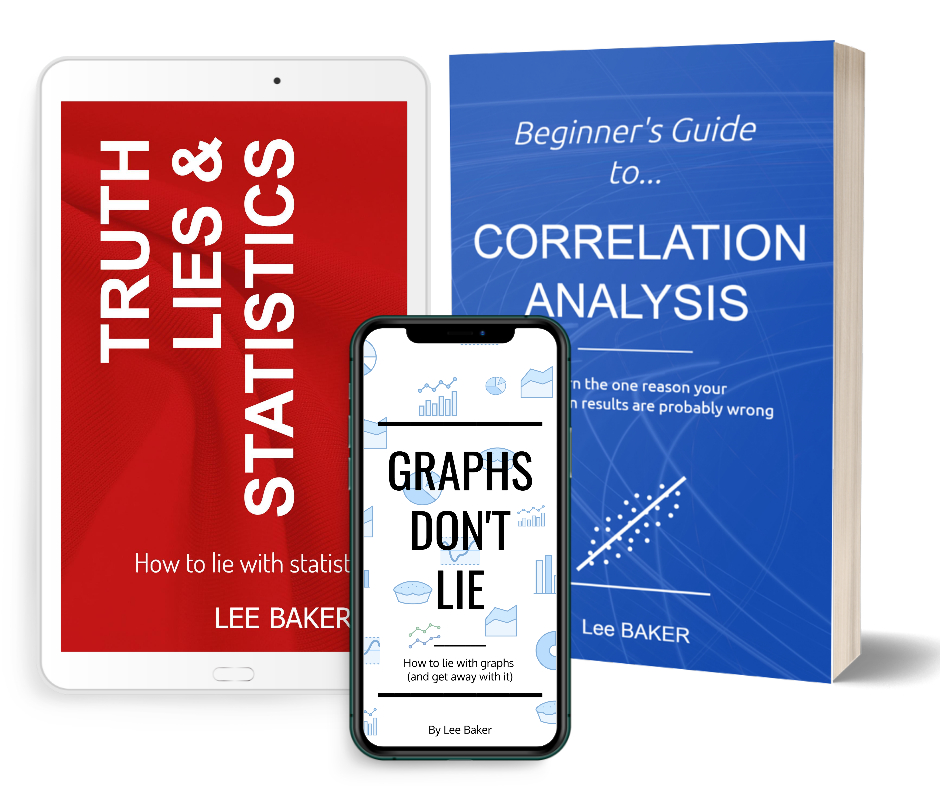
- Truth, Lies & Statistics
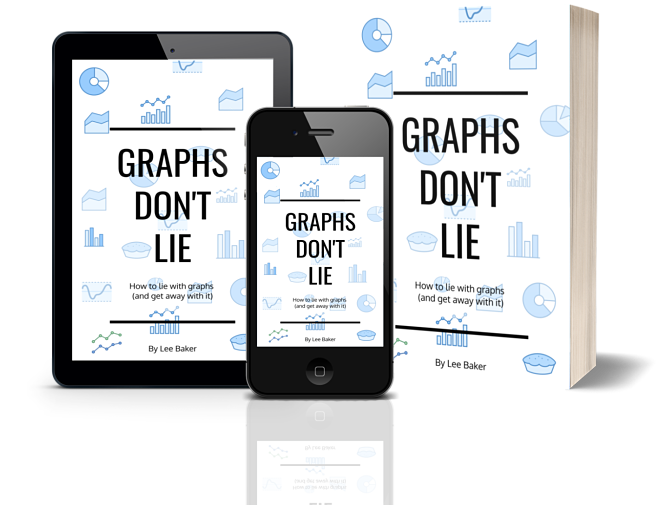
- Graphs Don’t Lie
PLUS - FREE BONUS:
DataViz – The Big Picture, an Ultra-High-Definition flowchart (pdf) that will guarantee that you get the right chart first time, every time!