
Describing Graphs & Trends · B1+ · Up, Down, Peak | No-Prep ESL Academic English Lesson
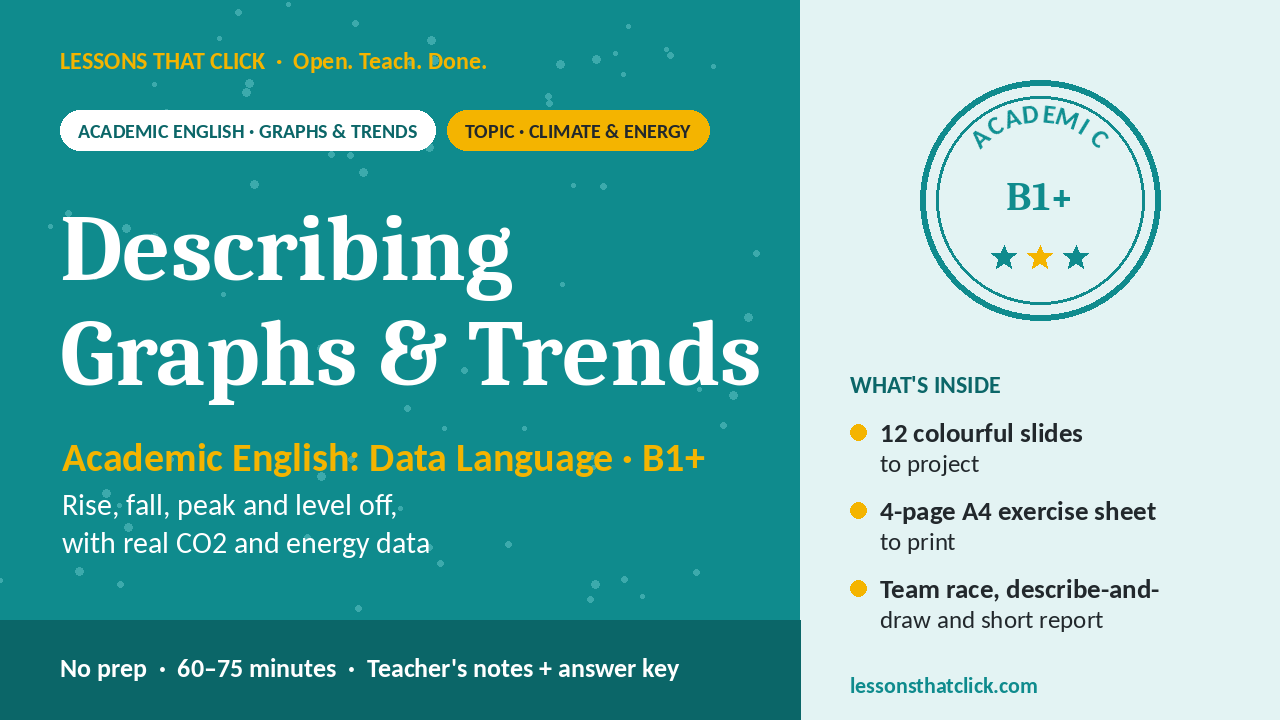
A ready-to-teach B1+ Academic English lesson on describing graphs and trends, built around real data on emissions, electric cars and Arctic sea ice.
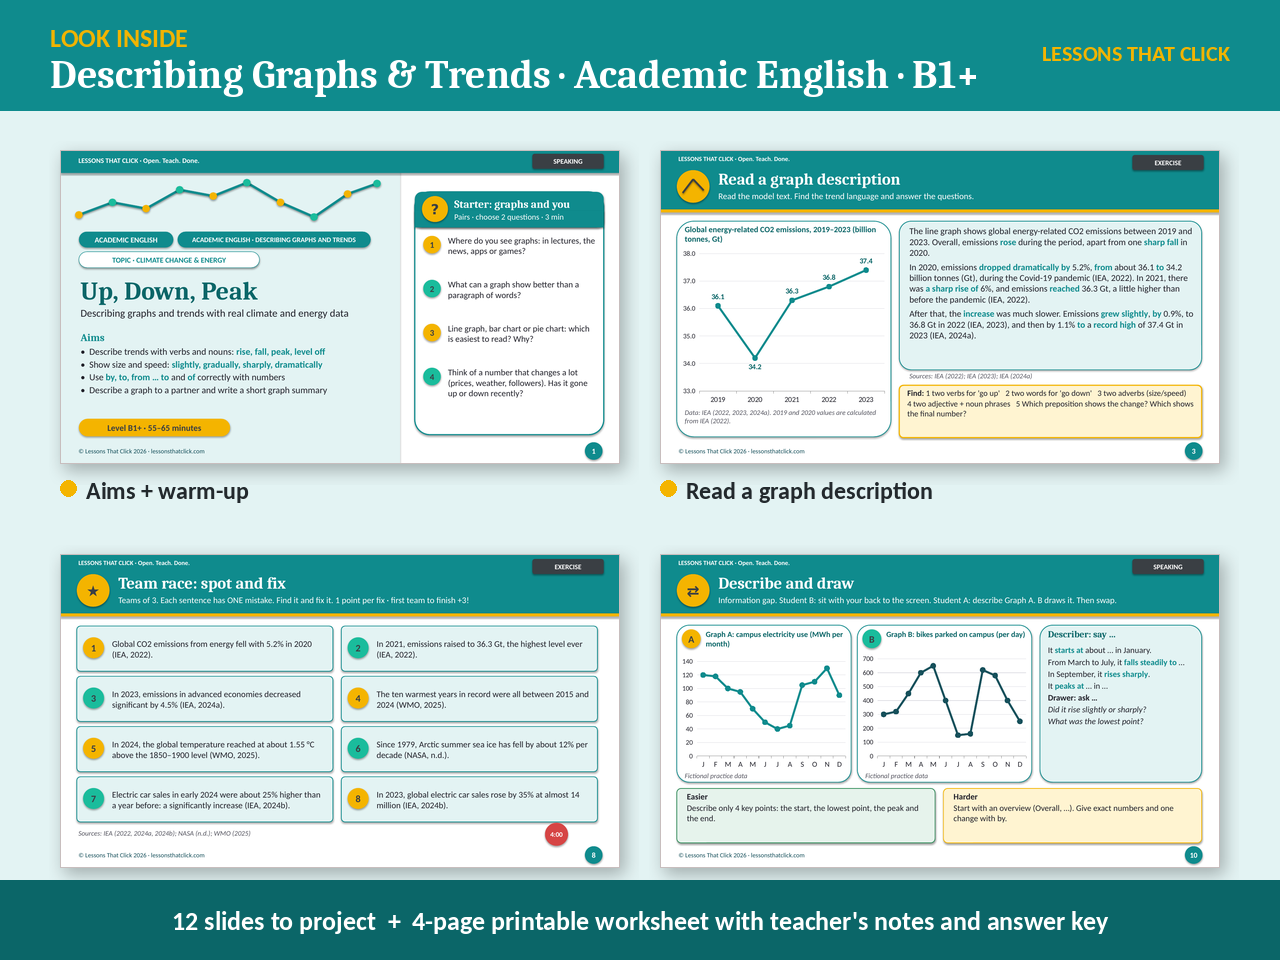
Students predict the shape of three real trends, read a model description and find the trend language. They learn trend verbs and nouns (rise, fall, peak, level off), adverbs and adjectives of size and speed, and the prepositions by, to and from … to, then race in teams, describe and draw each other's graphs in an information gap and write a short academic summary.
What's inside (one PDF):
- 12 colourful slides to project, with answer keys straight after each activity
- 4-page A4 exercise sheet: teacher's notes, answer key and a 2-page student worksheet
- Prediction lead-in, guided discovery, team race, describe-and-draw information gap and mingle
- Easier and Harder options, plus an exit ticket and free homework links
Level: B1+ · Time: 55–65 minutes · Prep: none. Print, project and teach.
Great for EAP, IELTS Writing Task 1 preparation and pre-university students. Data is sourced from the IEA, NASA and other reliable sources, with full references.
Licensed to the purchaser for classroom use. Please do not share or resell.