
SAP Ariba vs. Coupa — Practitioner Success Probability Assessment
Have questions before you buy? Book a free 30-minute call: https://calendly.com/jon-toq/30min
For corporate invoicing and purchase order terms, request an enterprise purchase order.
How To Use This Assessment
This assessment is designed to serve as an independent due diligence reference at any stage of your vendor relationship — before selection, during implementation, or after deployment. Before selection, it documents the structural risk variables that standard analyst reports do not measure, allowing you to build risk mitigation into your evaluation process. During implementation, it provides an evidence-based diagnostic framework when adoption challenges emerge — shifting the conversation from blame to documented pattern recognition. After deployment, it serves as the independent reference that explains why outcomes diverged from expectations, protecting both the decision and the decision-maker with longitudinal evidence. This is not a one-time read. It is a reference document that becomes more valuable the further you are into your vendor relationship.
The Convergence Question: If Two Vendors Arrive at the Same Gap Through Opposite Paths, Why Do They Produce Different Odds?
SAP Ariba and Coupa are the two most widely evaluated platforms in ProcureTech. Every major advisory firm has assessed both. None has published the data required to answer the question practitioners actually need answered: if you deploy either platform in January 2026, what is the mathematical likelihood that your implementation will achieve the business outcomes that justified the investment?
This comparative assessment answers that question using the Hansen Fit Score™ three-stage probability model, validated independently by six AI models through the RAM 2025™ Multimodel Assessment framework.
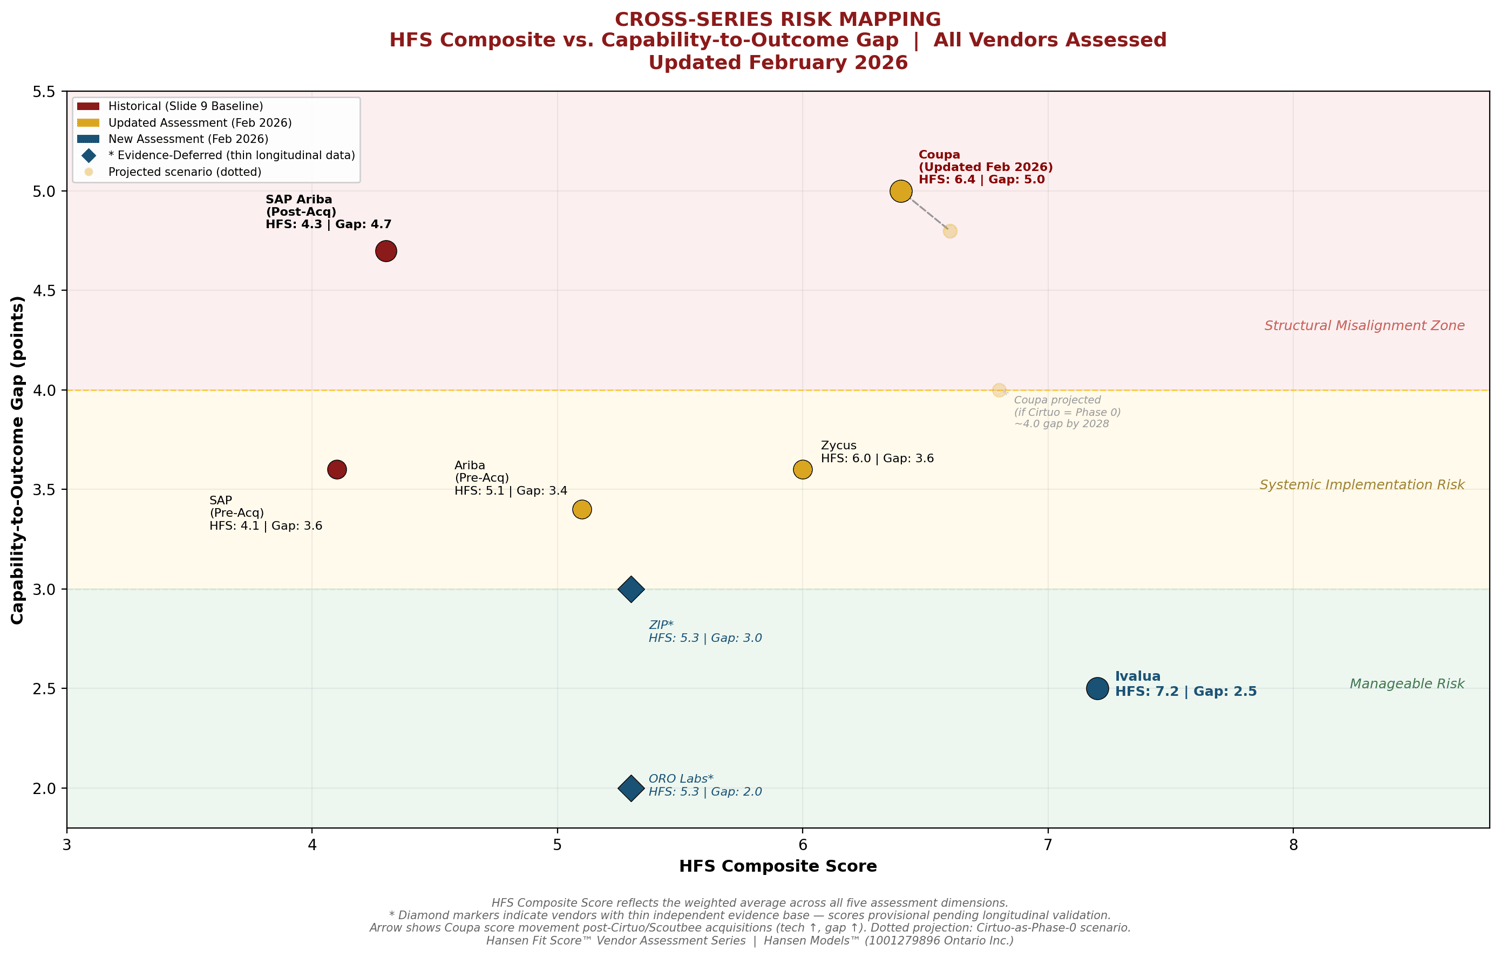
The central finding: both vendors arrive at nearly identical Capability-to-Outcome Gaps — 4.7 points (SAP Ariba) vs. 4.8 points (Coupa) — through completely opposite paths. SAP Ariba's gap widened over time through acquisition-driven complexity. Coupa's gap existed from inception but was masked by revenue growth and analyst validation. Despite similar gaps, the vendors produce meaningfully different success probabilities — and the reason why is the variable no other framework measures.
What's Inside:
- The full three-stage probability model: sector baseline calibration, gap penalty assessment, and readiness accessibility analysis — the stage that produces the decisive separation
- M&A impact analysis tracing how specific acquisitions moved specific HFS dimensions for both vendors — and why $30 billion in cumulative ProcureTech M&A investment barely moved the industry failure rate
- RAM 2025™ multimodel consensus with all six model estimates — directional finding unanimous across every model
- SAP Ariba replatforming risk analysis: what deploying on a declared-obsolete codebase means for January 2026 practitioners
- Coupa Cirtuo integration assessment: the difference between acquiring methodology and absorbing a feature
- Ownership and incentive structure analysis: enterprise DNA vs. PE optimization pressure
- Cross-series comparison across the complete HFS Vendor Assessment Series (Zycus, Coupa, Ariba, SAP, SAP Ariba)
- Practitioner decision framework by organizational readiness band — what the numbers mean for your specific HFS level
- Advisory ecosystem failure documentation: what five major frameworks measure and what none of them do
Methodology:
RAM 2025™ multimodel validation using six independent AI models. Evidence base: 318+ Procurement Insights archive posts spanning 2007–2026, two completed HFS Vendor Assessments (SAP Ariba: 14 pages, three phases; Coupa: 6 pages, five ownership phases), and publicly available data. 100% vendor-neutral — no vendor interviews, no demos, no sponsorship.
Who This Is For:
- Procurement leaders evaluating SAP Ariba, Coupa, or both
- Organizations currently implementing either platform who want to understand their probability position
- CPOs and CFOs making vendor selection decisions and seeking outcome-correlated assessment rather than capability scoring
- Consultants and advisors who need the comparative data their current frameworks don't produce
- Anyone asking the question the advisory ecosystem hasn't answered: what are my actual odds?
The ROI:
If a failed implementation costs $3M and neither vendor crosses 50% success probability, your risk exposure is $1.5M–$2.4M. This report costs 0.07% of that risk — and tells you exactly which readiness variables determine whether you land on the success side or the failure side.
Hansen Models (1001279896 Ontario Inc.) — Practitioner Performance Analysis & Vendor Reconciliation Exposed. Explainable. Repeatable.
Have questions before you buy? Book a free 30-minute call: https://calendly.com/jon-toq/30min