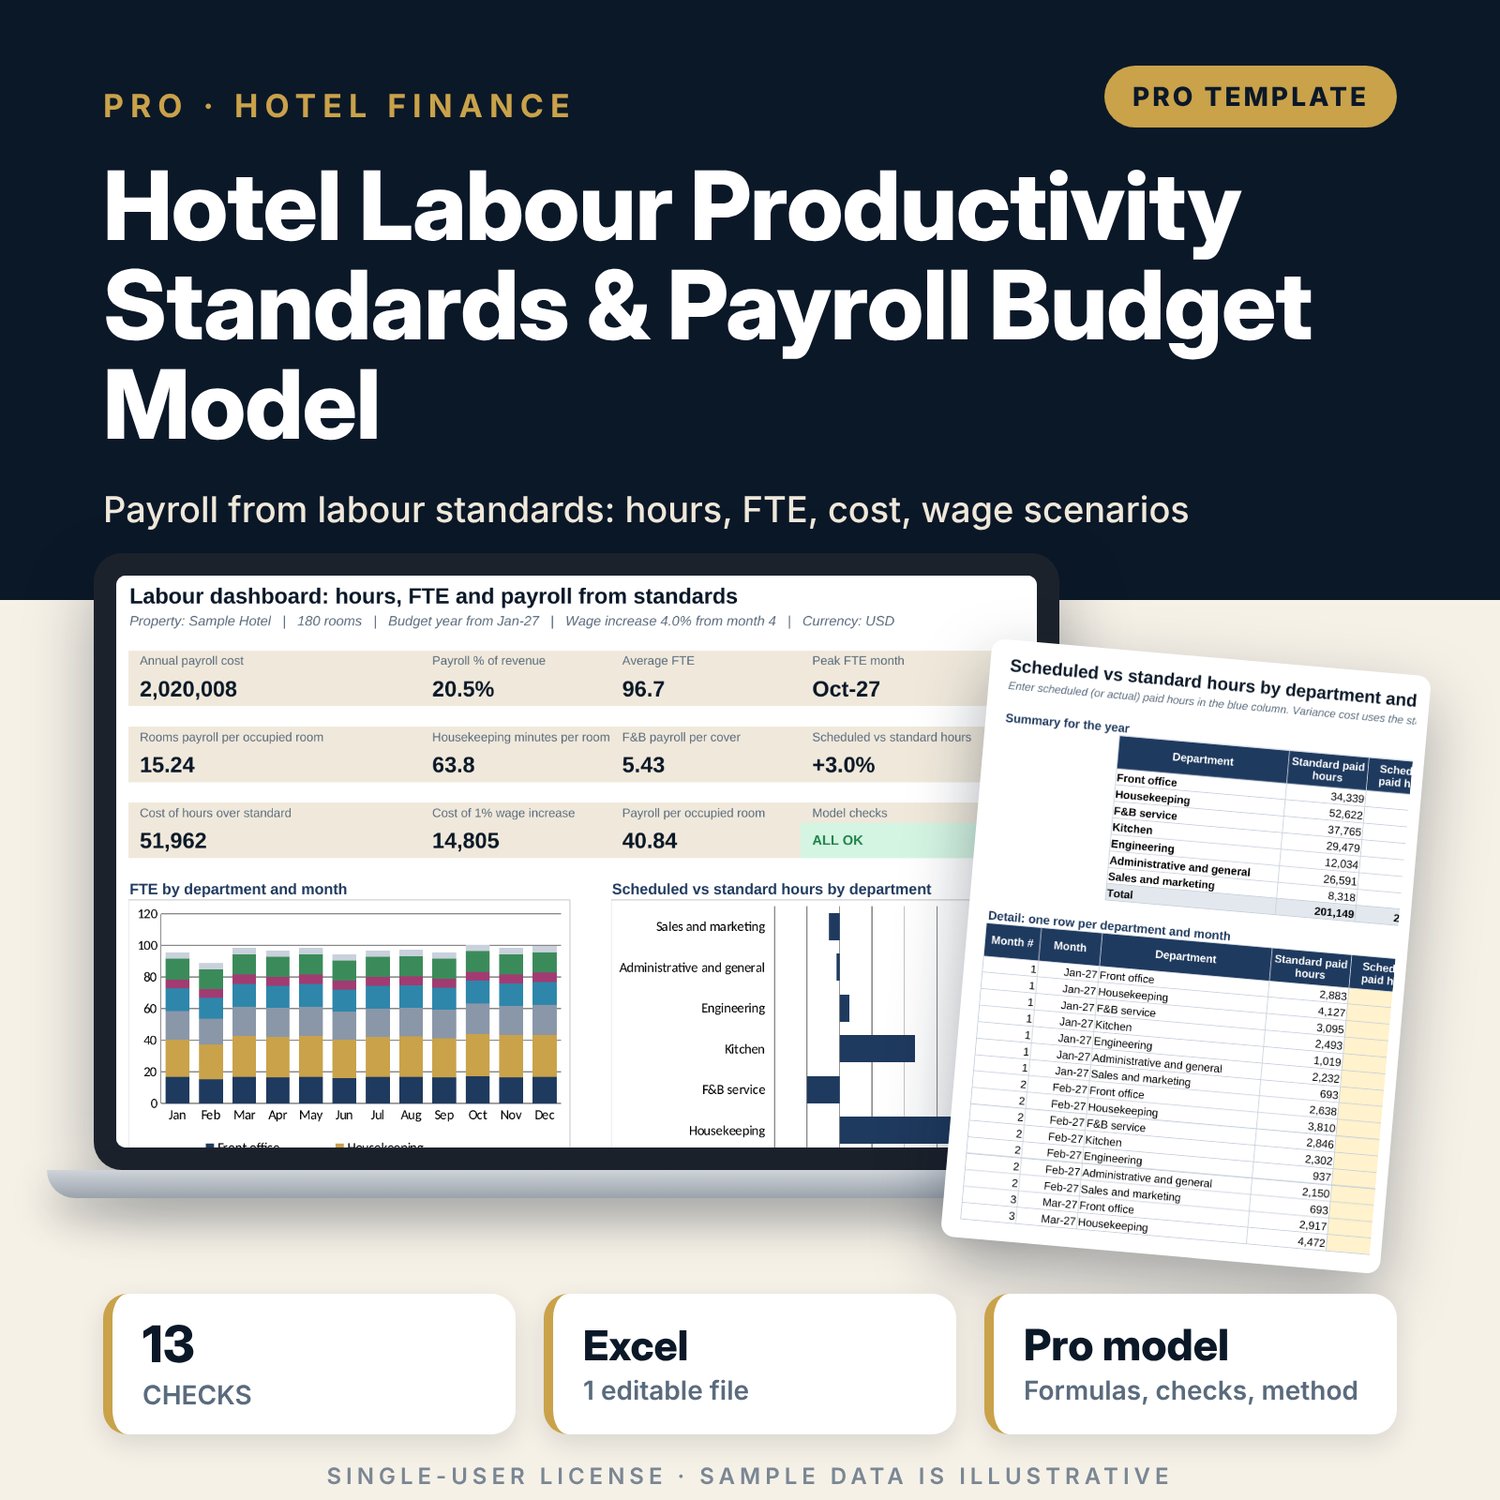
Hotel Labour Productivity Standards & Payroll Budget Model: Build the hotel payroll budget from labour standards, not last year
Full description
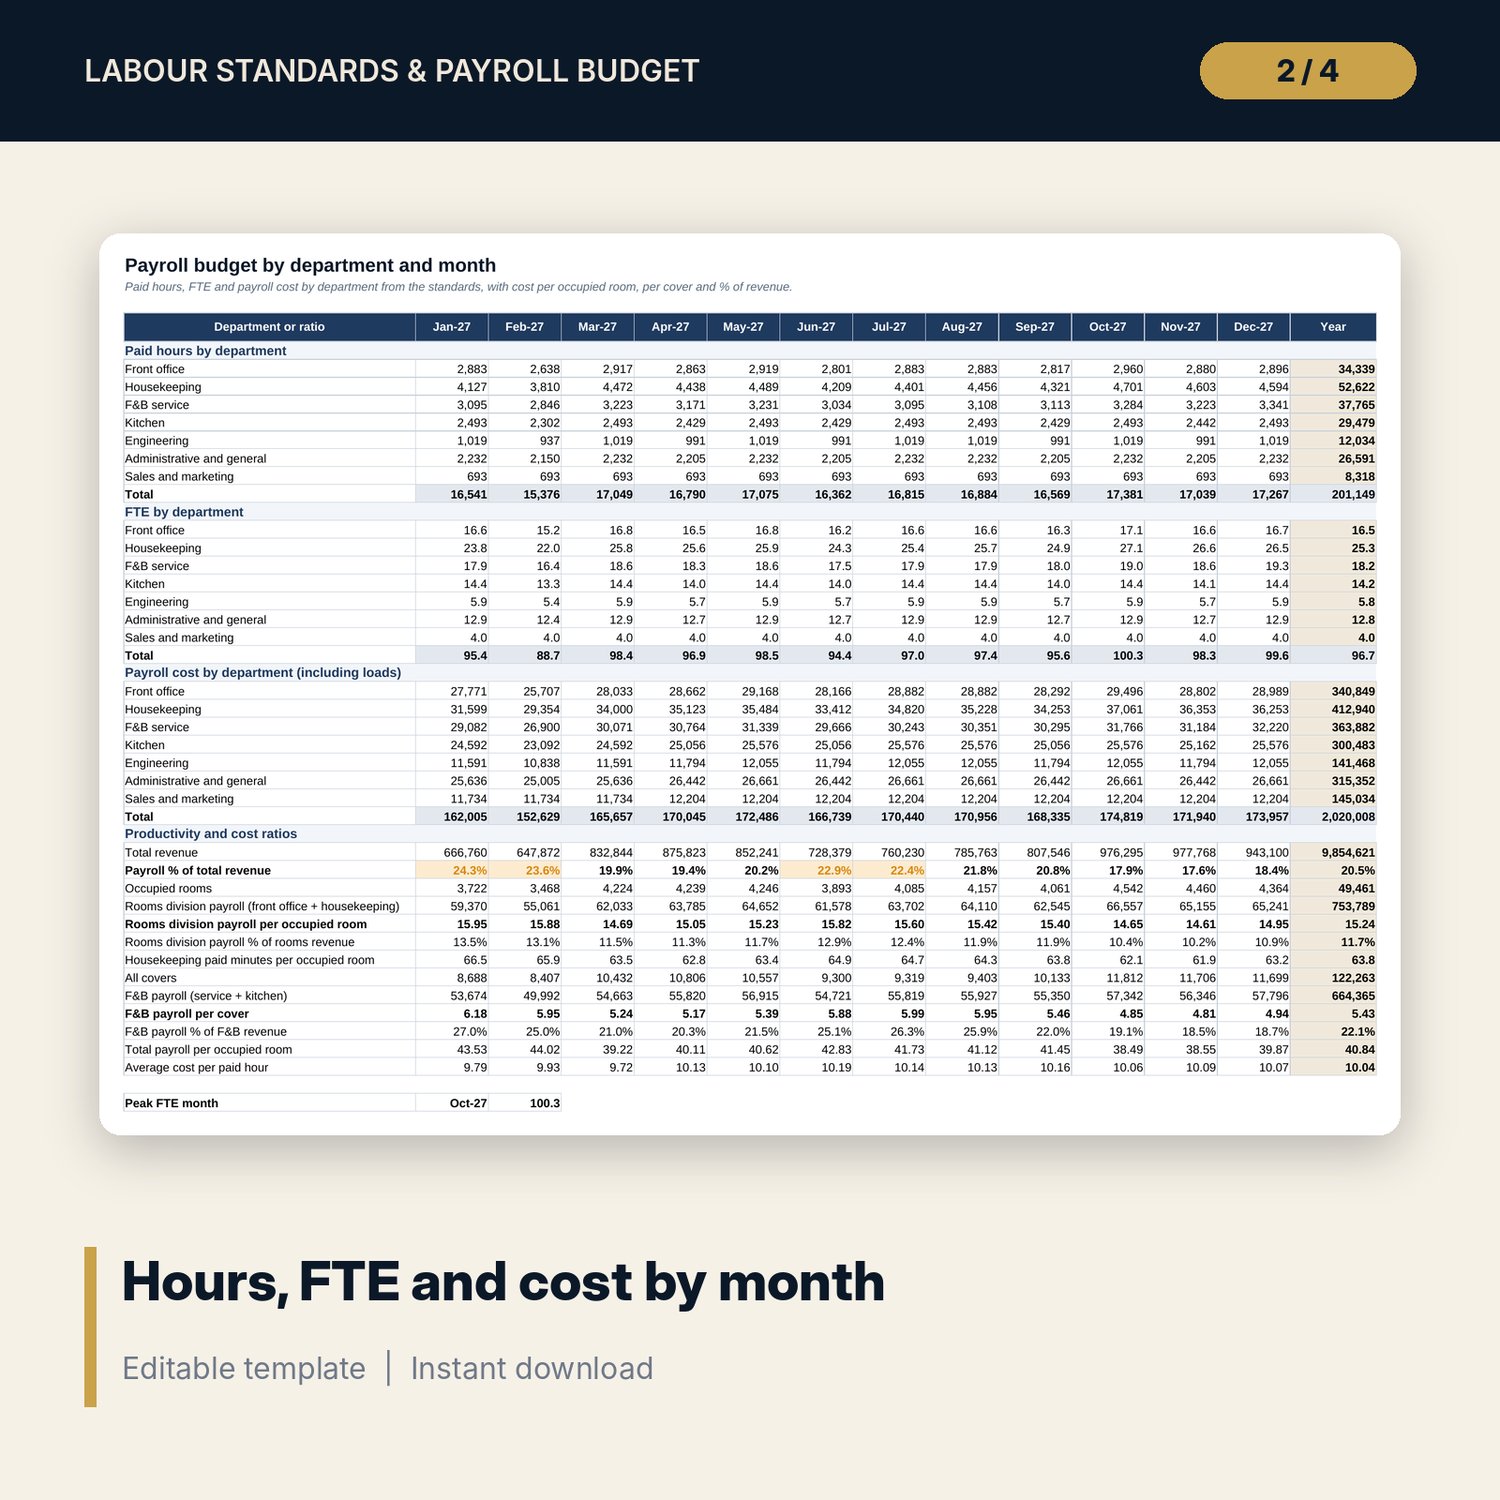
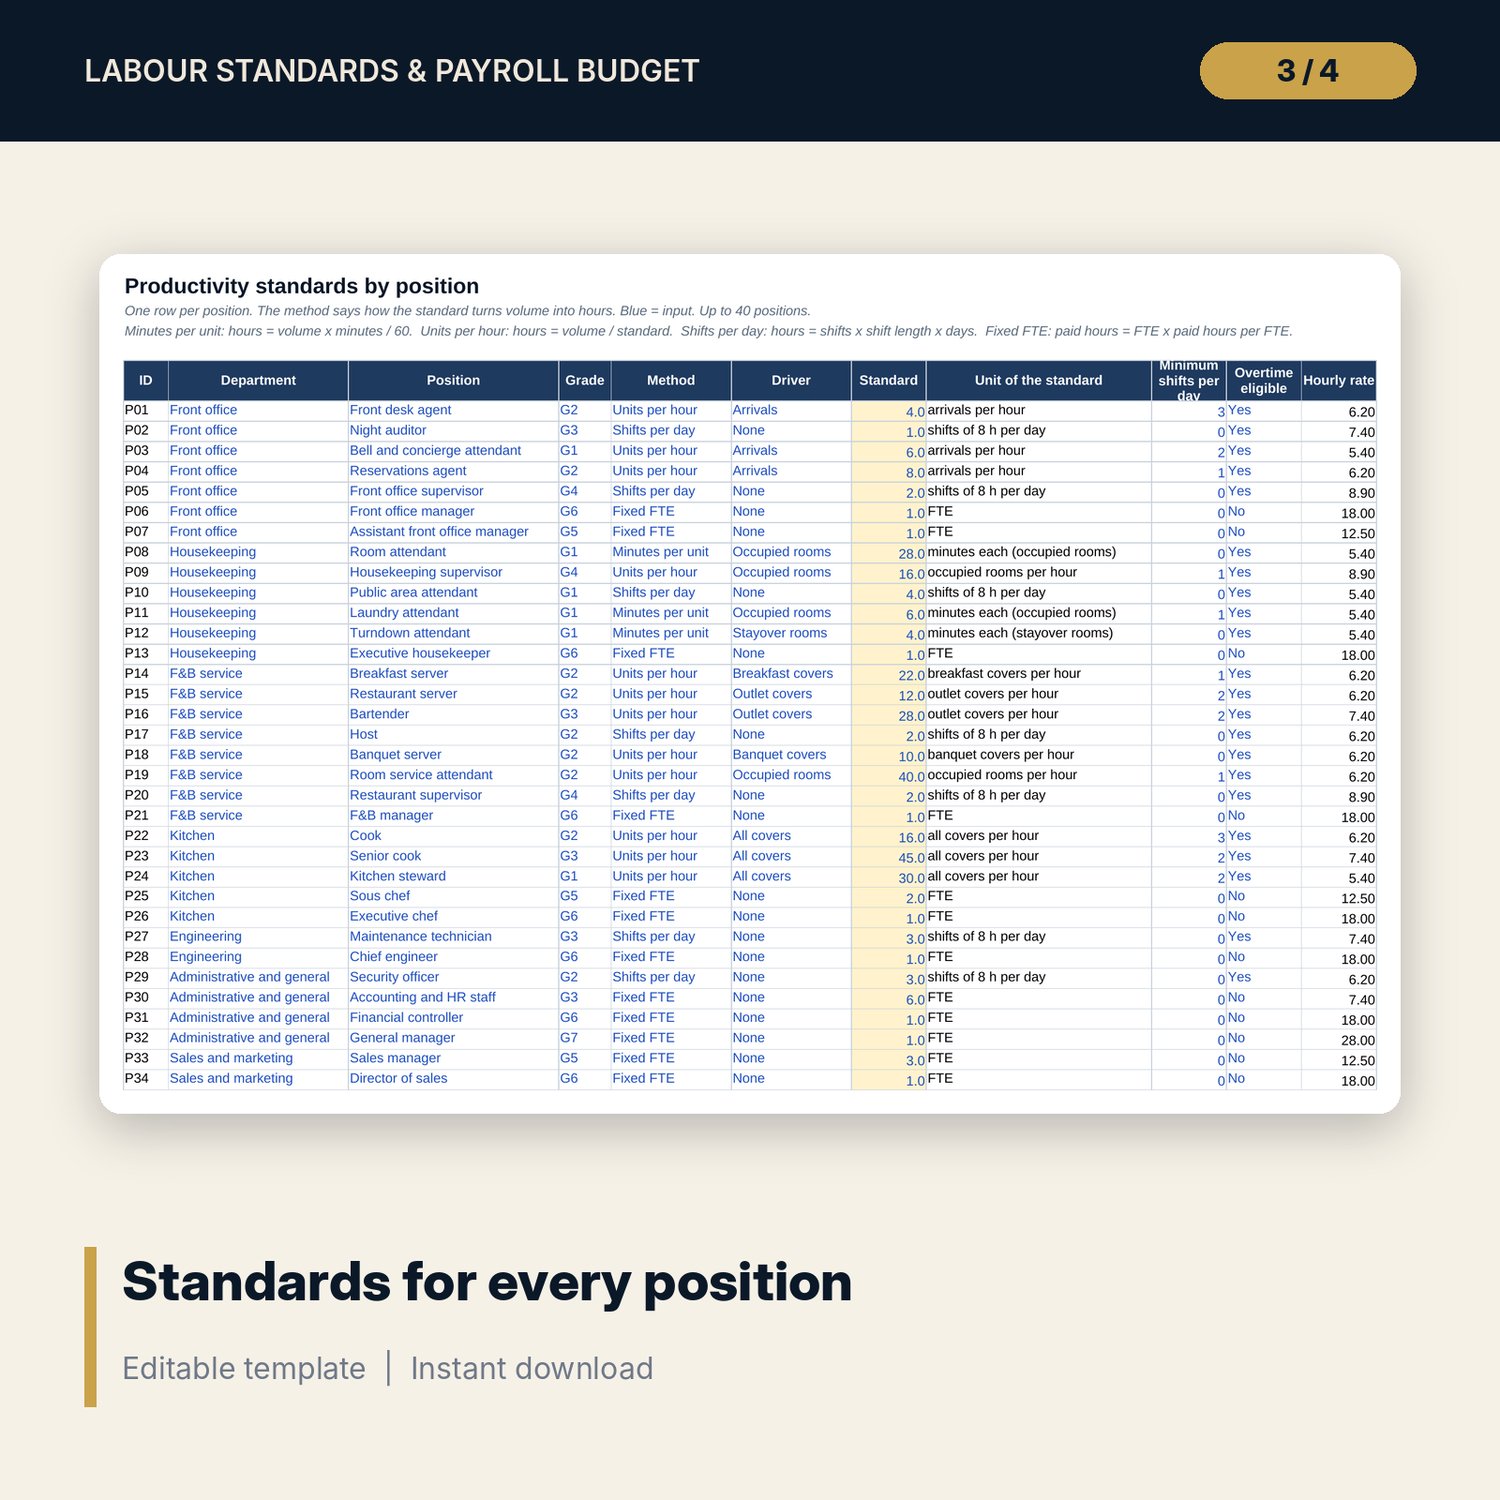
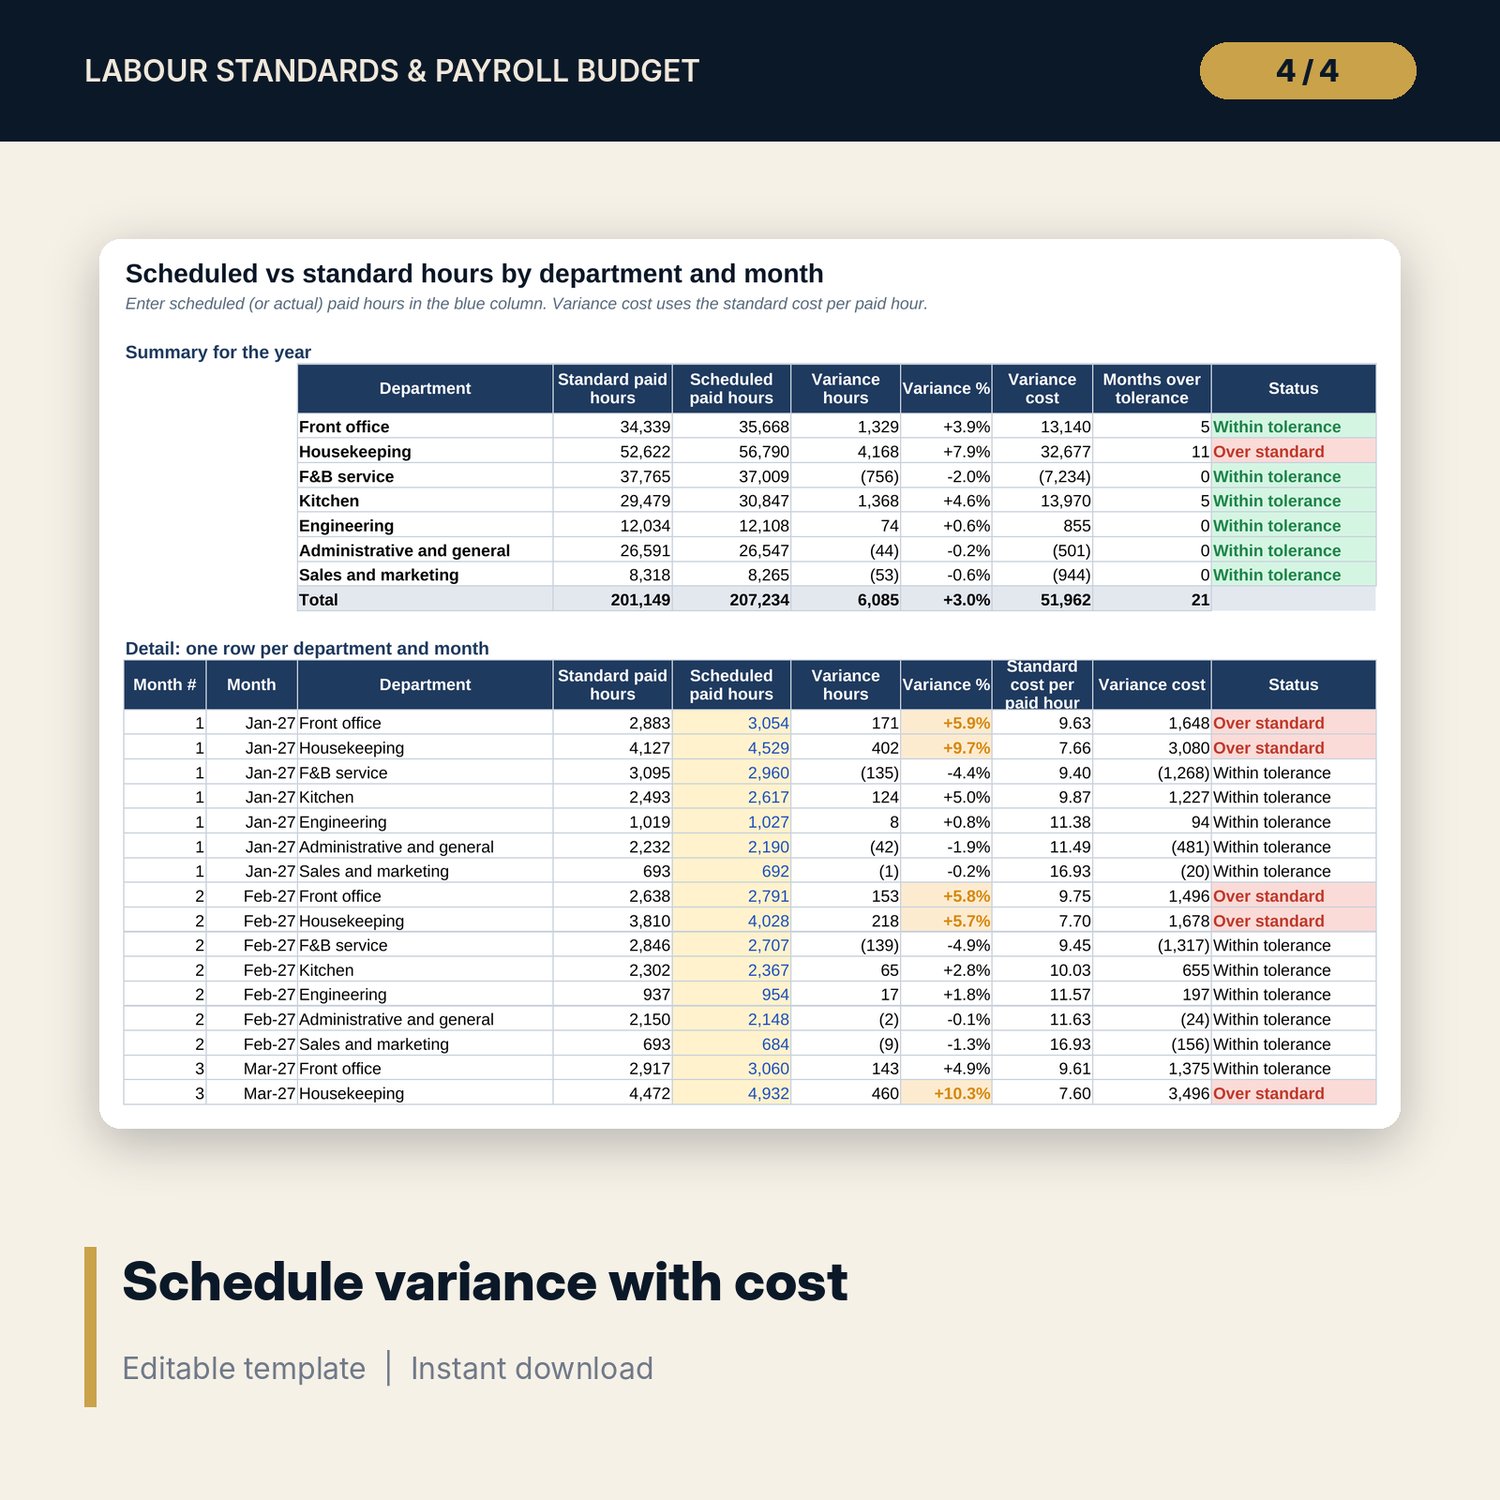
For general managers, financial controllers, HR managers and department heads who must defend the payroll budget line by line. Instead of adding a percentage to last year, each position gets a standard: minutes per occupied room for room attendants, check-ins per agent hour at the front desk, covers per server hour in the restaurant, shifts per day for posts that must be covered, and fixed management positions. The workbook turns your monthly volume forecast into workload hours, applies minimum cover, converts productive hours into paid hours with your non-productive share, then into FTE and cost with grade rates, overtime, the wage increase month and benefits and statutory load. Results: paid hours, FTE and payroll by department and month, rooms division payroll per occupied room, F&B payroll per cover, payroll % of revenue, wage increase scenarios from 0% to 10% priced exactly, and a scheduled vs standard hours variance with cost and status.
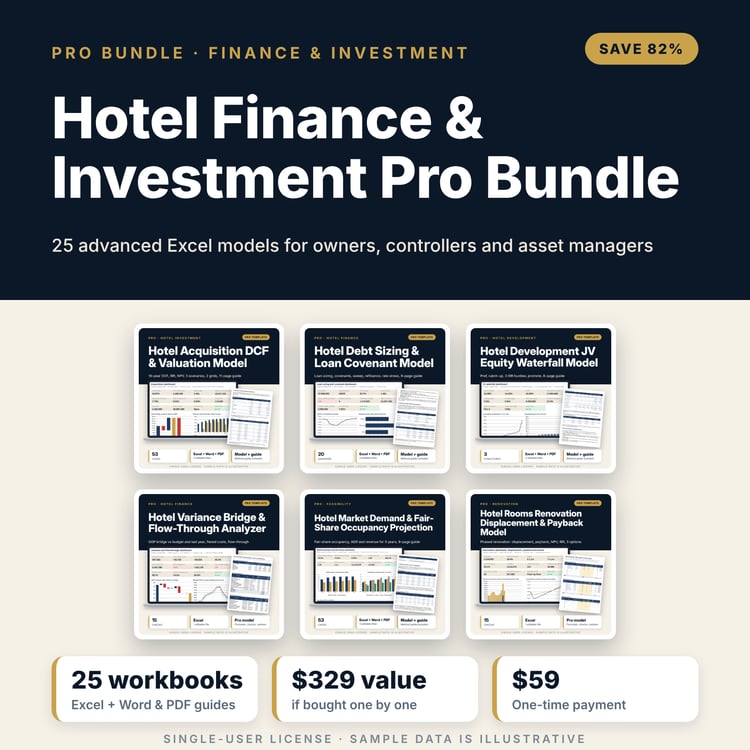
Save with a bundle: this workbook is also in the Hotel Finance & Investment Pro Bundle, 25 workbooks for $59 instead of $329. All 100 Pro workbooks are in the Pro Library for $119, and all 241 templates and workbooks are in the Ultimate Hospitality Library for $149.
What is inside
- Hotel_Labour_Standards_Payroll_Budget.xlsx: 11 tabs, 4,705 formulas, 3 native charts, 17 drop-down and input rules, 13 integrity checks, a Method tab with 14 calculation notes.
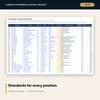
- Standards tab with 34 sample positions in 7 departments, 4 standard methods and 6 spare rows; 7 pay grades with spare rows.
- Volume_Forecast: 12 months of occupied rooms, arrivals, departures, stayovers, breakfast, outlet and banquet covers and revenue.
- Labour_Engine: for every position and month, five visible steps from workload hours to payroll cost (40 x 12 x 5 cells).
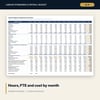
- Payroll_Budget: paid hours, FTE and cost by department and month plus 13 productivity and cost ratios and the peak FTE month.
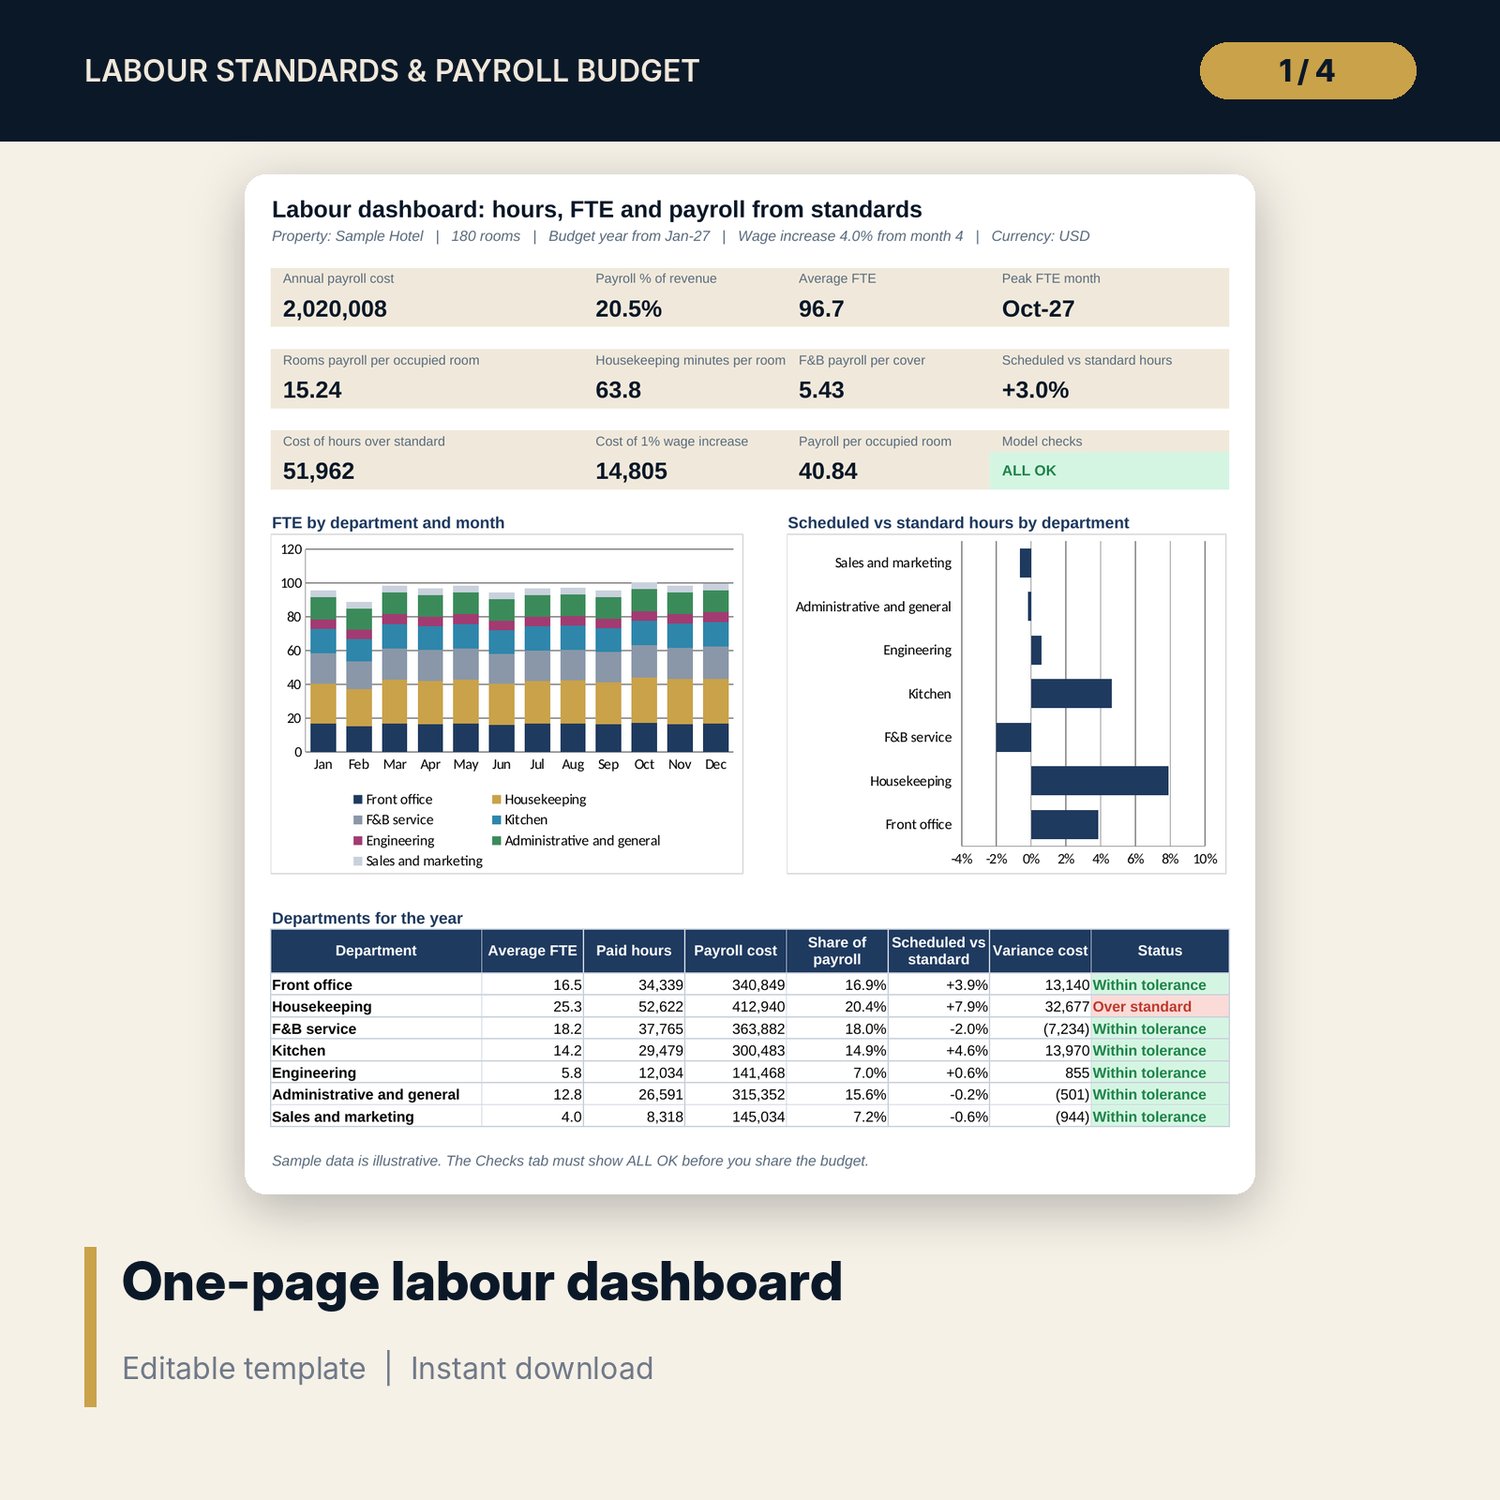
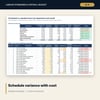
- Schedule_Variance: 84 department-month rows of scheduled vs standard hours with variance cost and status.
- Wage_Scenarios: payroll at 0% to 10% increase, a 5 x 5 grid of load and increase, and a chart.
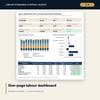
- Dashboard: 11 KPI tiles, a check tile, FTE by department and variance charts and a department table, printable on one page.
- README.txt and LICENSE-and-Terms.txt.
How it works
- Set paid hours per FTE, shift length, non-productive share, overtime, loads, wage increase and grade rates.
- Enter occupancy, length of stay, guests per room, covers and ADR by month.
- List each position with its method, volume driver, standard and minimum shifts per day.
- Read hours, FTE, payroll, cost per occupied room, cost per cover and payroll % of revenue; test pay rises.
- Each month, enter scheduled or actual paid hours and review the variance against standard.
Details
- Format: one .xlsx workbook, English.
- Software: Excel 2016 or later, or LibreOffice Calc 7 or later.
- No macros, no data tables, no array formulas, no add-ins.
- 12 months, any currency.
- Delivery: instant download.
Good to know
- Sample data and standards are illustrative. Measure your own standards before you rely on them.
- Not legal or HR advice. Verify local requirements for minimum wages, working hours, overtime and statutory charges.
- The model sizes paid hours from monthly volumes. Daily and hourly rosters still need a scheduling tool or a roster sheet.
- Single-user license.
FAQ
Why build payroll from standards instead of last year?
Last year's payroll carries last year's inefficiencies. Standards tie hours to volume, so the budget moves when occupancy or covers move and every post can be explained.
What if a post must be covered even when it is quiet?
Each position has a minimum number of shifts per day. The model takes the higher of the workload hours and that minimum, and shades the months where the minimum applies.
How are leave and training handled?
A non-productive share converts productive hours into paid hours, so annual leave, holidays, sickness and training are funded.
Can I test different pay rises?
Yes. Wage_Scenarios prices 0% to 10% exactly from the same hours, with payroll % of revenue for each, and a grid against the benefits load.
How do I use it during the year?
Enter scheduled or actual paid hours by department each month. The variance tab shows hours and cost over or under standard with a status.