
16S Microbiome Analysis Starter Workflow (R / Phyloseq)
Got QIIME2 feature table and taxonomy and don't know where to start?
Skip the tedious setup and stop rebuilding your bioinformatics workflows from scratch!
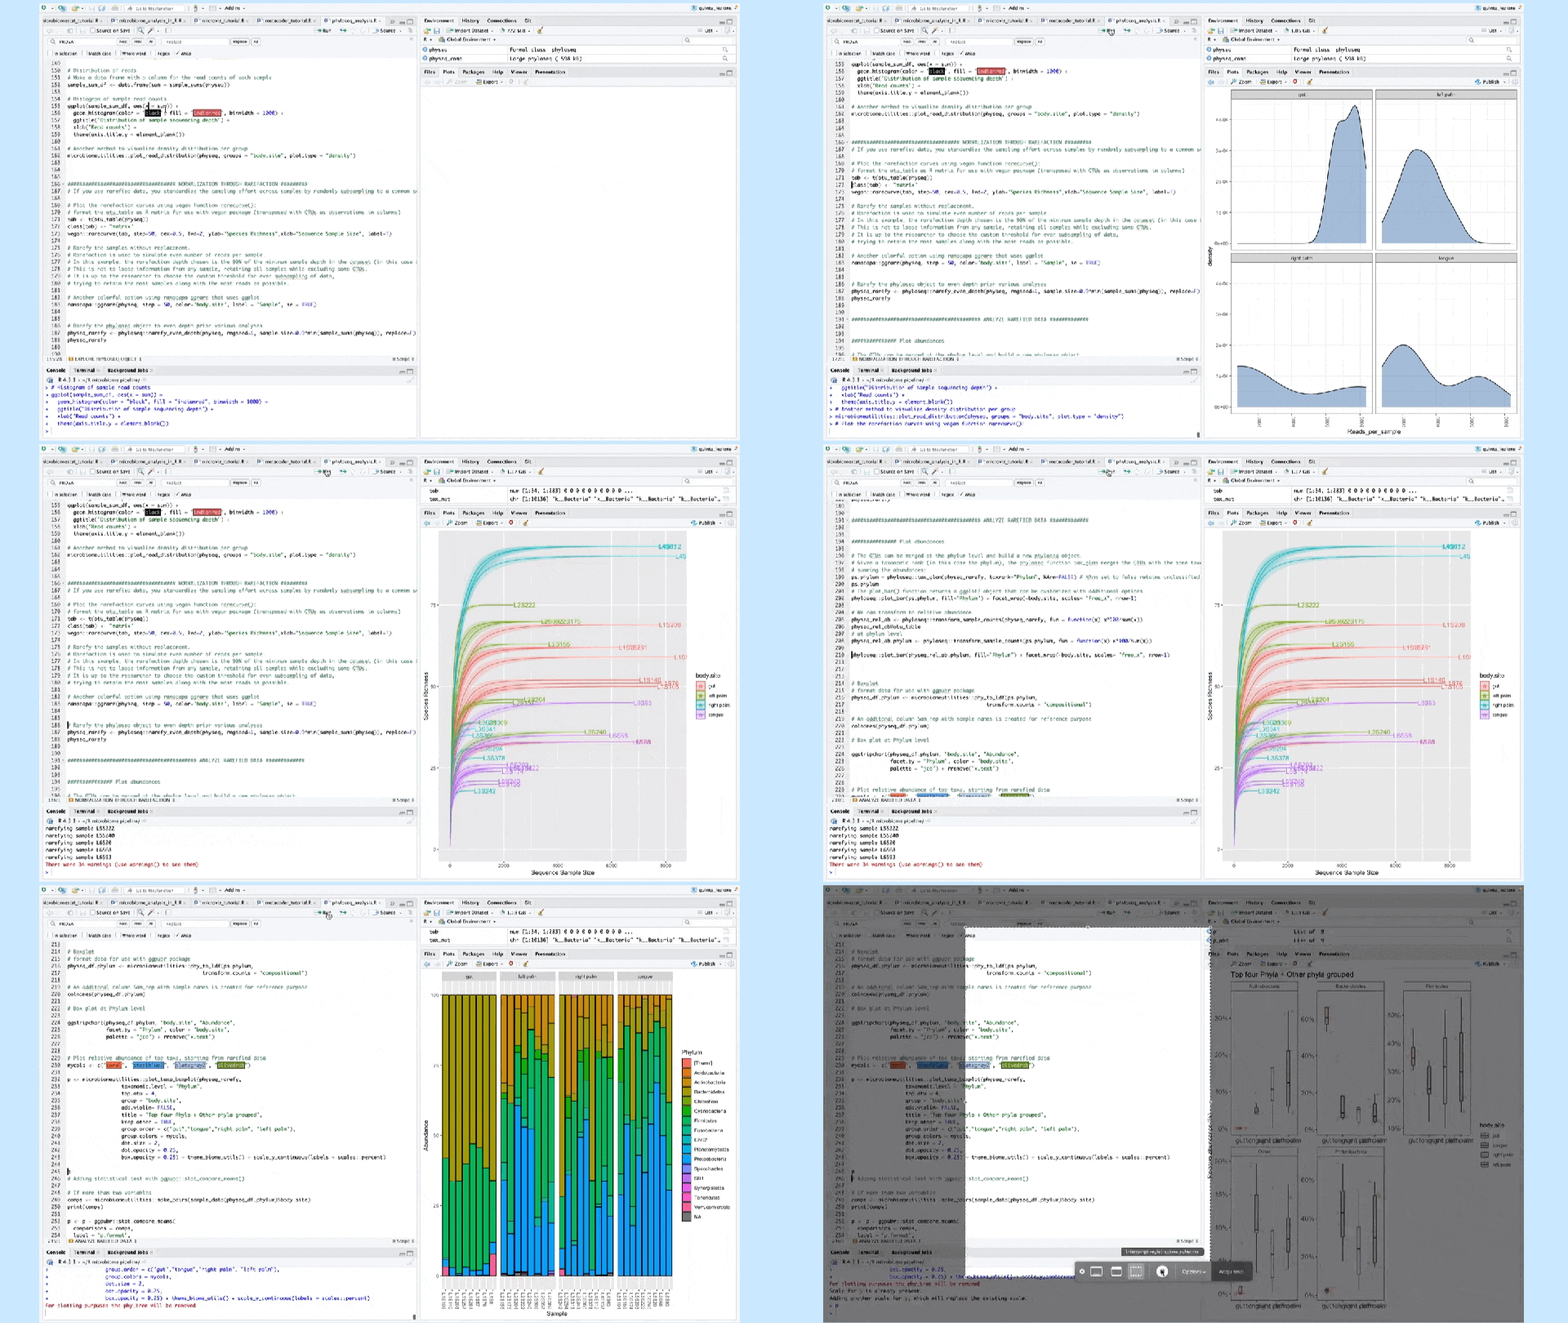
This isn’t a "black-box" package—it’s a single, clean, and fully commented `.R` file designed to be executed in RStudio.
It also comes with a separate text guide explaining every single step.
You keep 100% control over your data, with full freedom to customize every plot, test, or theme.
📌 Note: This is a professional R-programming resource (Source Code). It is not a tool for Raw FASTQ processing, denoising, or OTU picking—this pipeline starts directly at the feature table.
Accepted input file format of feature table, taxonomy, metadata and (optional) phylogenetic tree:
- QIIME2 .qza
- or .csv/.tsv
📦 What You Get Inside the Download:
The Master R Script: Complete downstream data analysis and visualization workflow, from phyloseq object construction to advanced statistical analysis.
Detailed Text Guide: A separate step-by-step documentation explaining every single chunk of code.
Example Materials & Methods: Ready-to-adapt manuscript text with references, ready to drop into your paper.
The Outputs: By running the script with the provided workflow, you can generate 33+ high-quality figures, 5 exported CSV tables, and 8 auto-applied statistical tests.
Here is exactly what the script does:
🔹 Foolproof Setup: It automatically handles dependency installation and only requires you to set 3 basic parameters (your working folder, input files, and your comparison group variable).
🔹 Input Flexibility: You can import .qza files directly from QIIME2 (via qiime2R), or, if you have standard .csv files (feature table, taxonomy, metadata), you just switch the option to "csv" and it loads everything from plain text.
🔹 Publication-Ready Graphics: All downstream analyses share a unified, elegant ggplot2 theme to ensure consistent and coherent visuals throughout the entire project.
Analyses included (with integrated statistics):
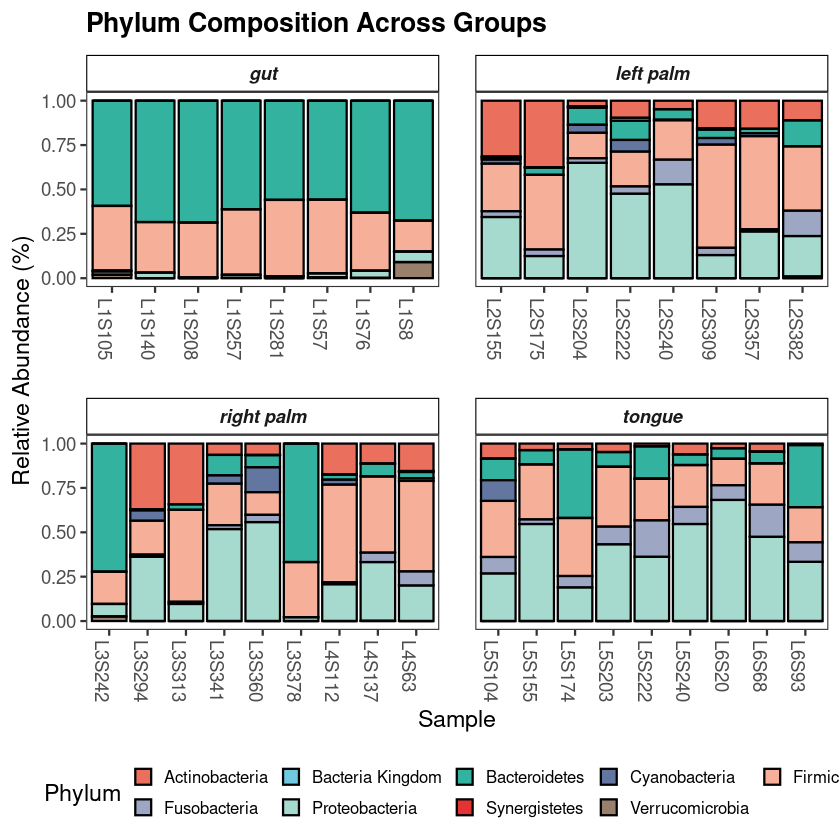
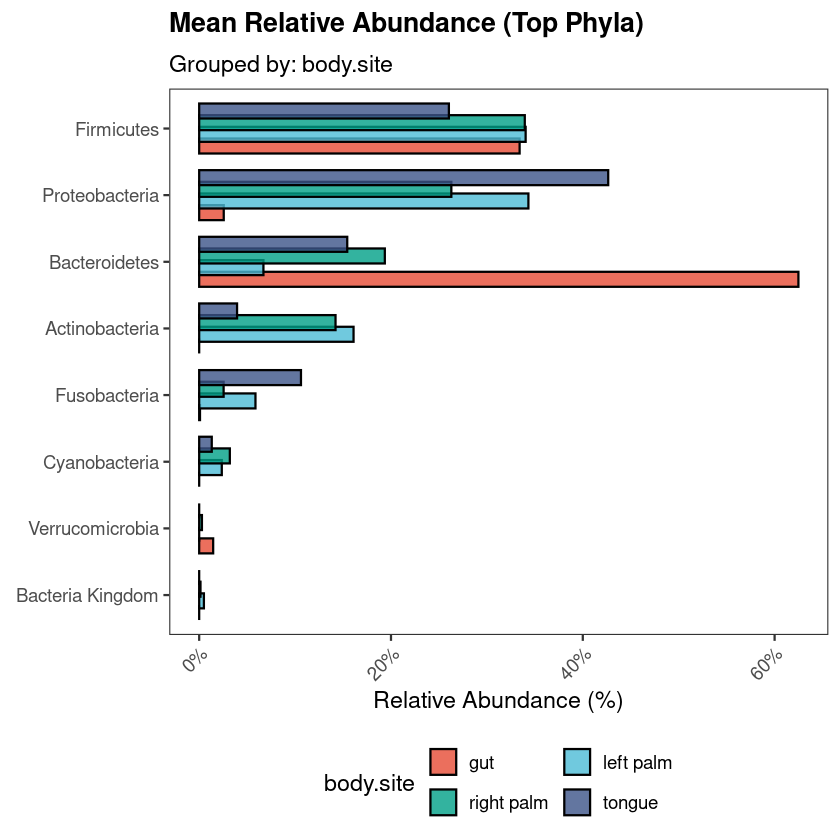
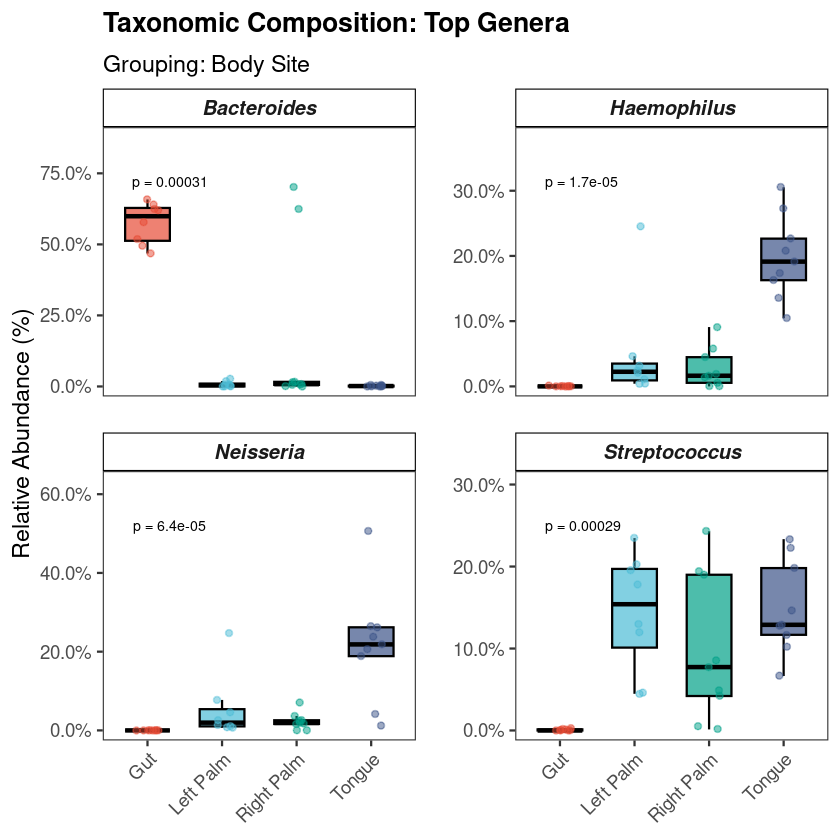
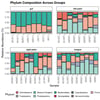
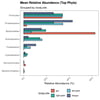
📊 Taxonomic profiling (classic abundance bar plots).
📉 Rarefaction curves.
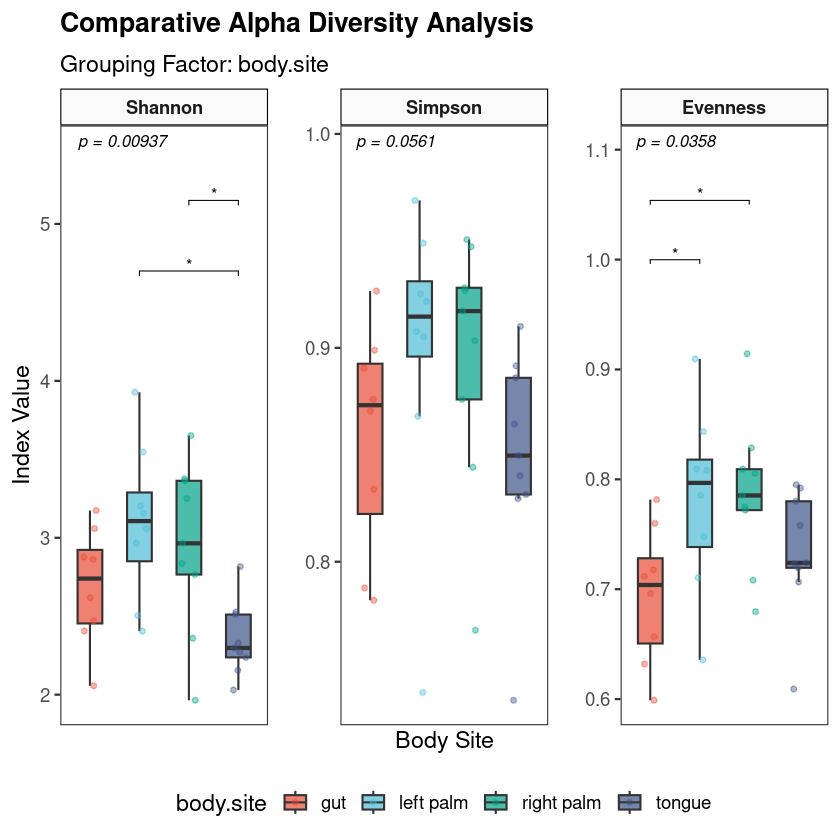
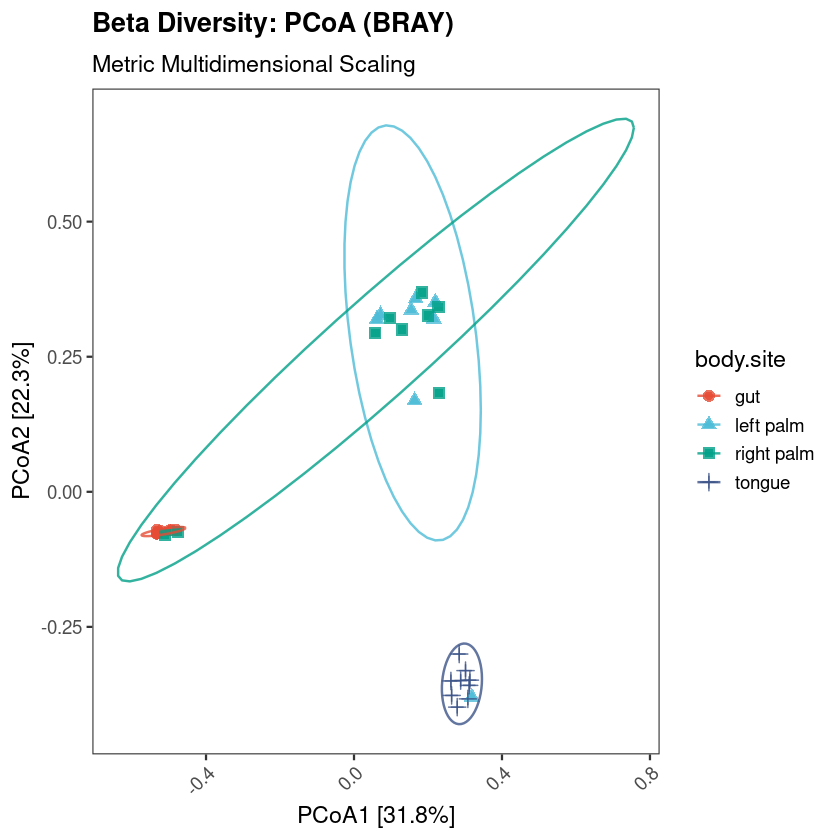
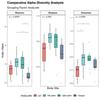
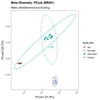
🧬 Alpha & Beta Diversity (with built-in statistical testing).
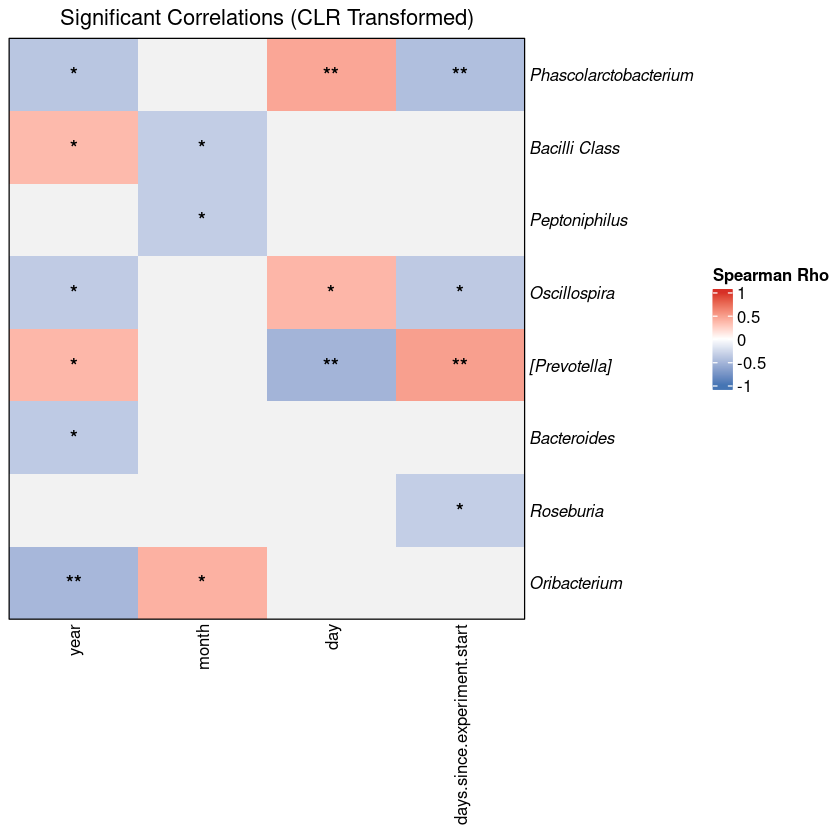
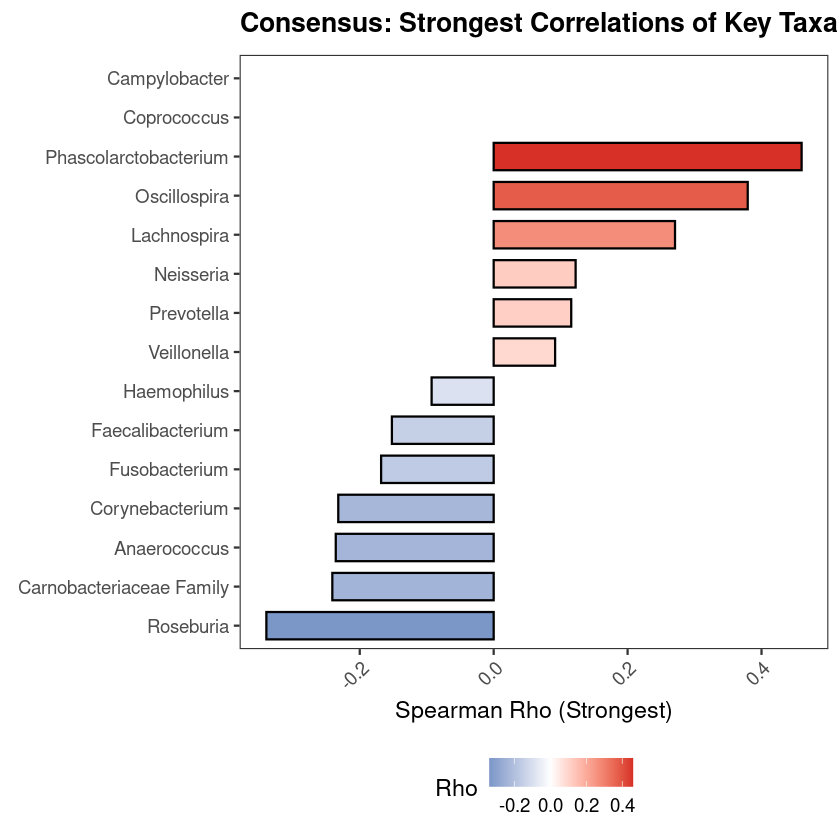
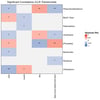
🔗 Metadata/microbial feature correlation analyses.
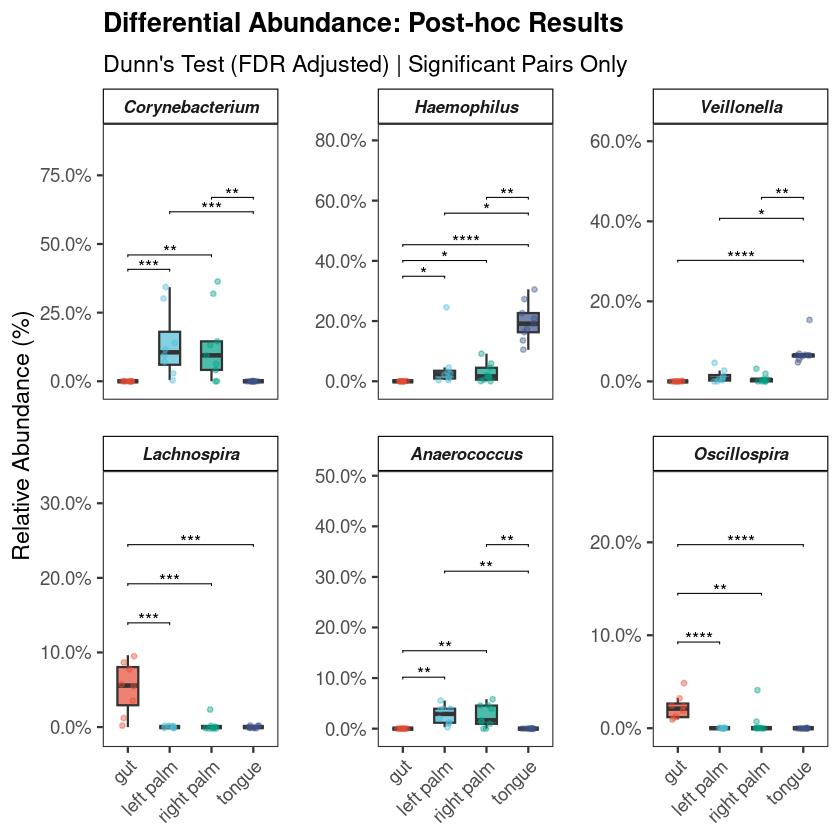
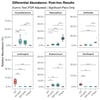
🧪 Exploratory differential abundance testing.
Basic Info:
Every block of code (chunk) is visually isolated with clear spacing and text dividers, and commented line-by-line explaining what it does and why.
Once you set your initial variables, you just hit "Run" one chunk at a time and follow the pipeline.
- Section 0: Installs every library it needs on the first pass (phyloseq, qiime2R, microViz, vegan, microbiome, ggplot2, rstatix..)
- Configuration section: The whole script keys off three variables.
```R
MY_WORKING_DIR <- "path/to/your/project/folder"
MY_SAMPLE_ID <- "sample_name" # sample ID column
MY_GROUP_VAR <- "Treatment" # grouping column
```
Then pick ONE import option: QIIME2 .qza artifacts, or plain CSV.
You can easily customize or tweak any plot or test whenever you need to.
🛠️ Why choose it?
This workflow provides a structured baseline you can reuse across projects, while keeping full transparency over each analytical step.
- Fully editable R source code (no black-box steps)
- Structured workflow from import to statistical analysis
- Coherent style, high-quality plots: All downstream analyses share a unified, elegant `ggplot2` theme to ensure consistent and coherent visuals throughout your entire analysis.
1. Phyloseq Object Construction: Seamless import from QIIME2 (.qza) or plain CSV/TSV inputs (Feature Table, Taxonomy, Metadata, and optional Tree).
2. Data Normalization: Built-in options for rarefaction and Central Log-Ratio (CLR) transformation.
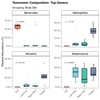
3. Microbial Profiling: Taxonomic barplots and boxplots.
4. Alpha Diversity: Shannon, Simpson indices with automatic group comparisons (Kruskal-Wallis / Wilcoxon).
5. Beta Diversity: PCoA / NMDS ordination plots using Bray-Curtis and UniFrac distances.
6. Robust Statistical Testing: Automated PERMANOVA (`adonis2`) and PERMDISP to validate your clusters.
7. Explorative Biomarker Module: Logistic regression paired with ROC/AUC analysis for predictive features.
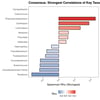
8. Environmental Integration: Taxa–Metadata Correlation Heatmaps to link microbial abundance with clinical/environmental metadata.
Requirements & download
R ≥ 4.2 From cran.r-project.org. Older versions may clash with Bioconductor packages.
RStudio — recommended Not required, but the section-by-section structure is built for it.
Internet — first run only Section 0 installs ~20 packages. 15–30 min on a clean setup.
Preprocessed 16S data Feature table + taxonomy + metadata, as .qza or CSV/TSV.
IMPORTANT: This is a professional R-programming resource (Source Code). Access is immediate; therefore, all sales are final and non-refundable.
Files included in your download:
LICENSE.txt (1 kb)
microbiome-workflow.pdf (22 kb)
microbiome-phyloseq-workflow.r (66 kb)
Statistical_Software_and_Bioinformatics_Packages.txt (4 kb)
Statistical Methods Summary.txt (2 kb)
README.txt (13 kb)