

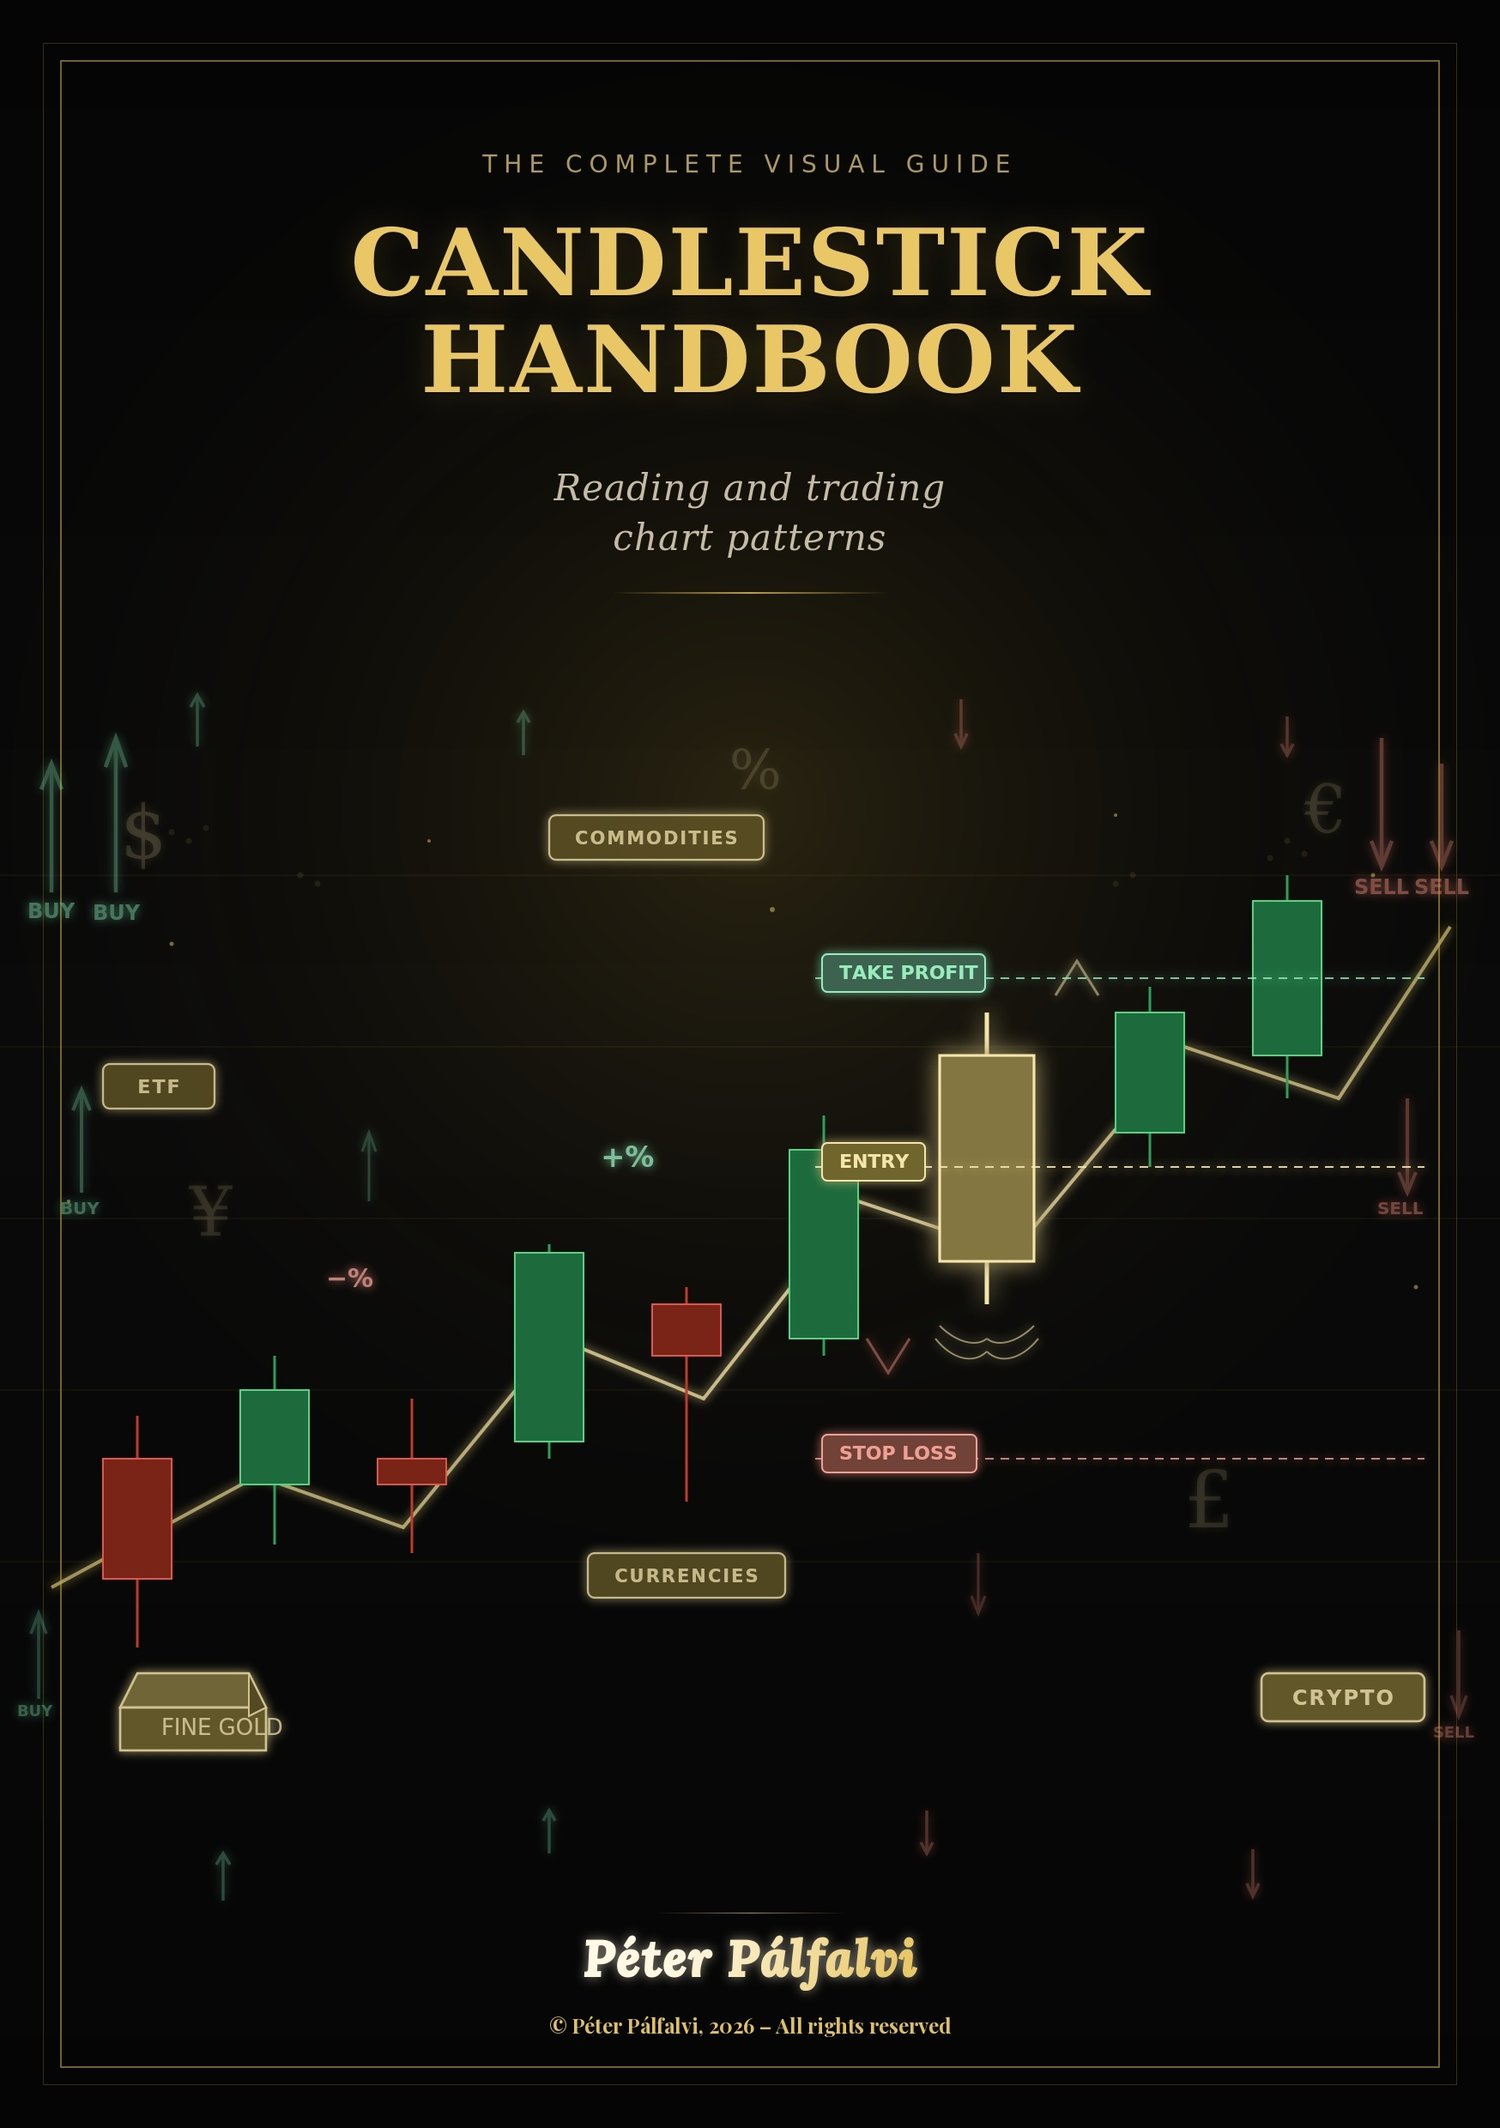



Candlestick handbook - Reading and trading chart patterns
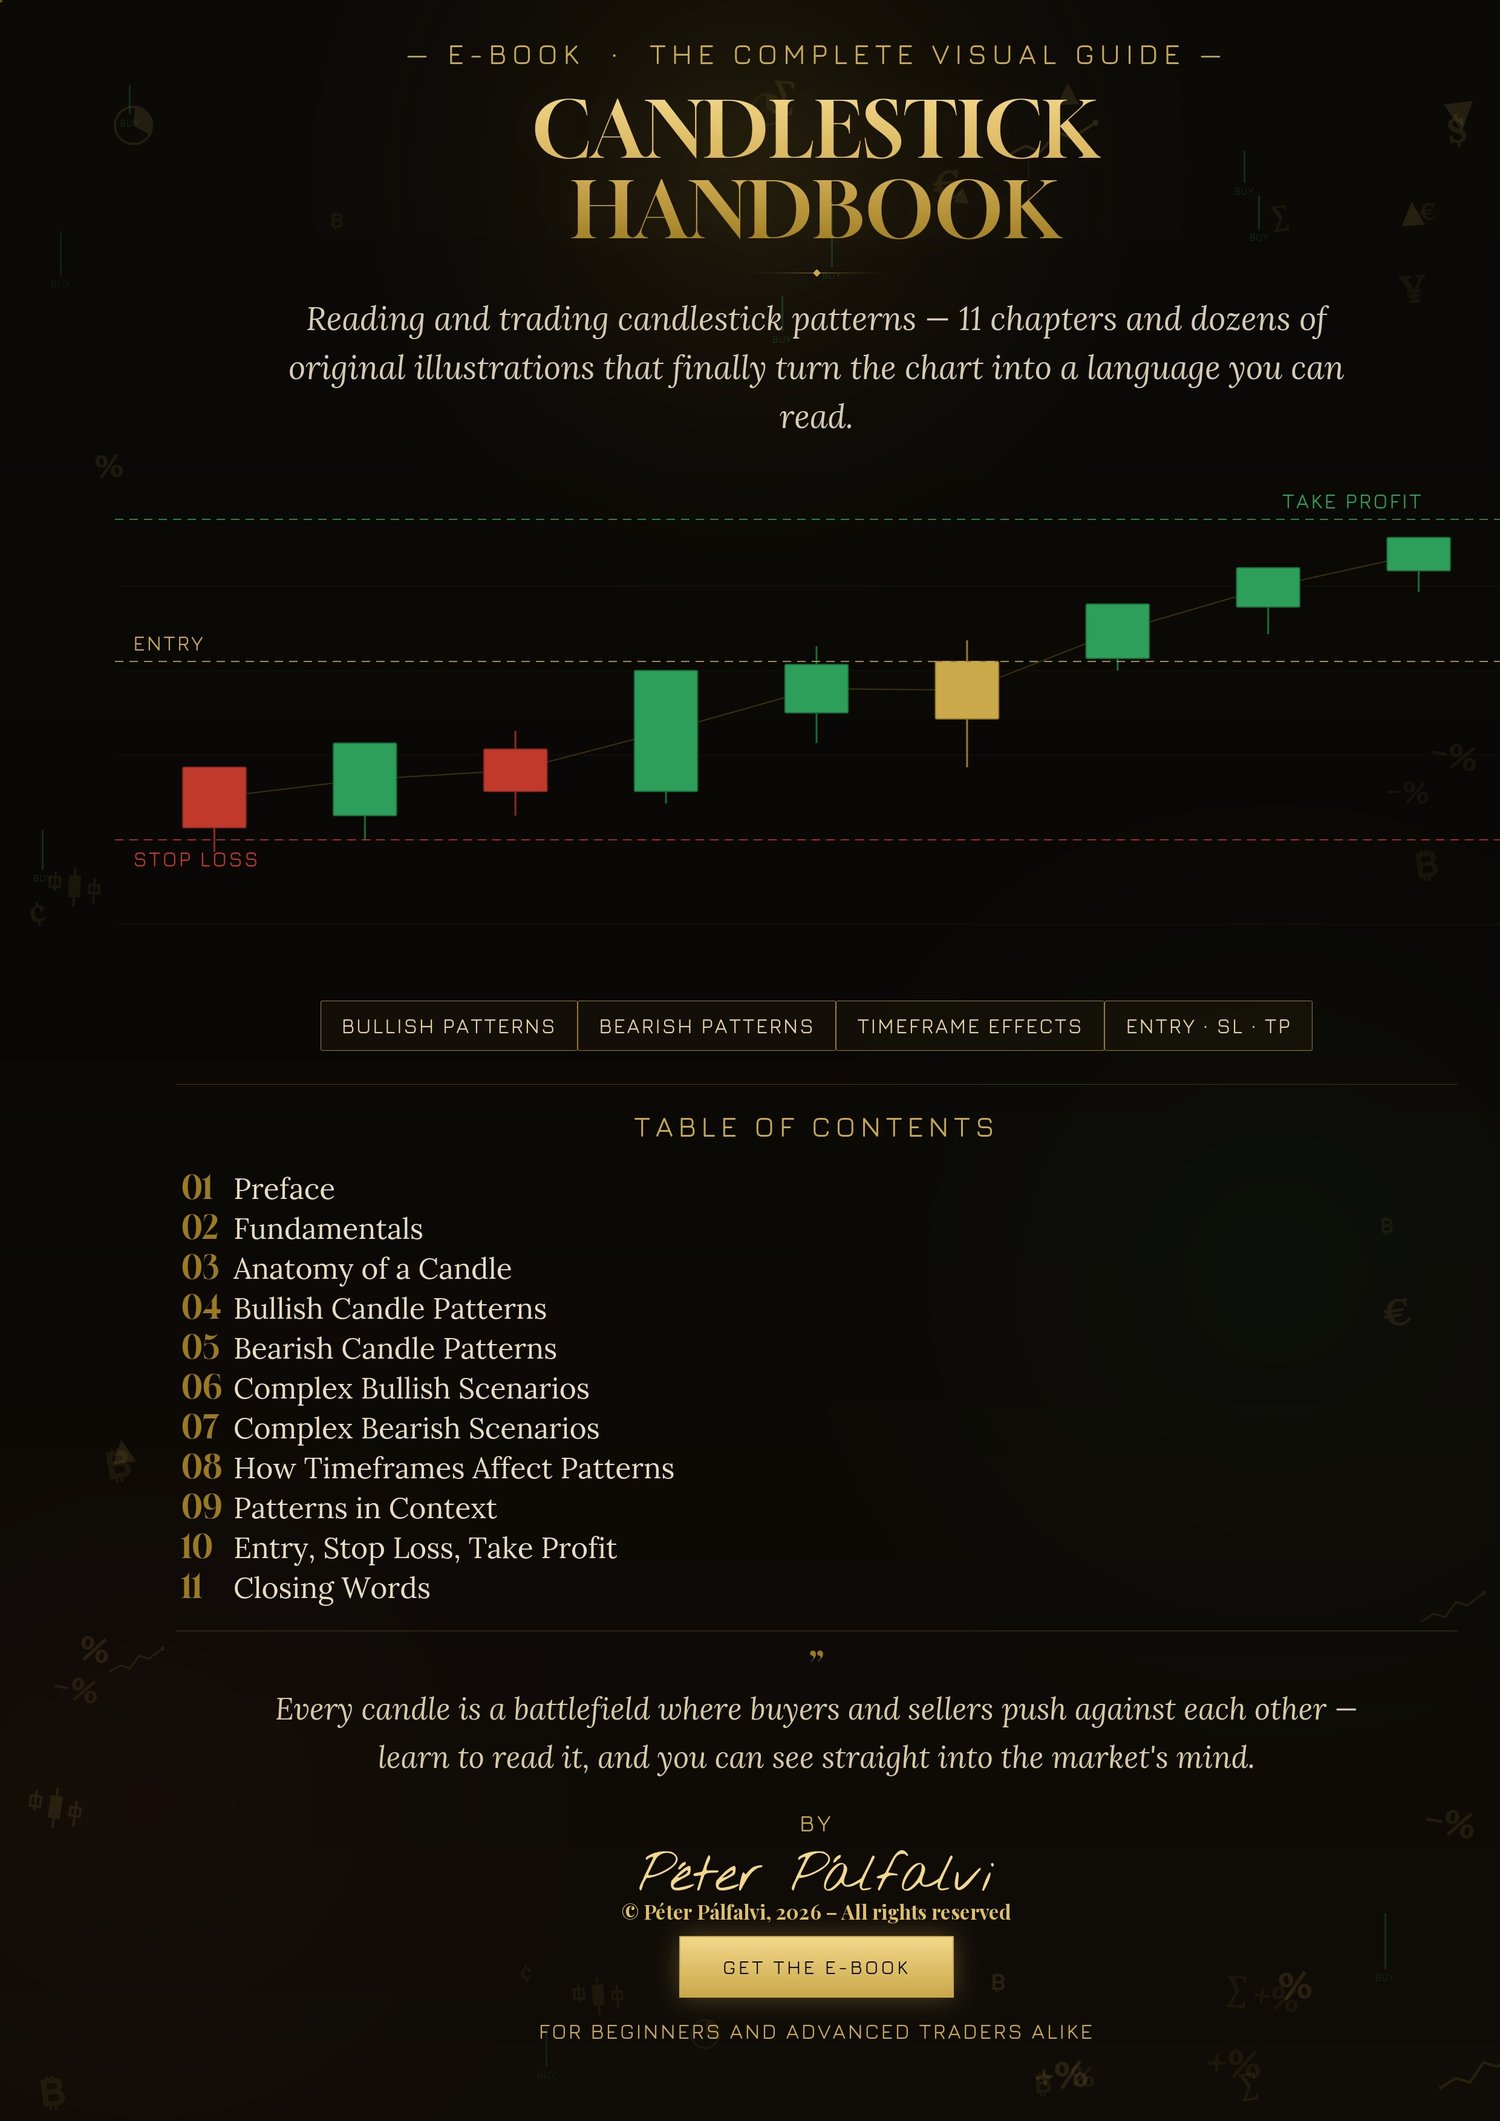
When we first look at a live stock chart, the flickering red and green bars can seem like chaos. To the beginner, this is a world of noise — to the professional, it's an open book. The Candlestick handbook teaches you that language.
Across 11 chapters, the book walks you from the fundamentals through candle anatomy to simple and complex bullish/bearish formations, then shows how these patterns behave across different timeframes (from 1-minute to weekly charts) and how to read them in the context of trend and support/resistance. The final chapter offers a practical guide to Entry, Stop Loss, and Take Profit, along with risk management.
This isn't a crystal ball — because no such thing exists — it's a statistical edge that helps you become a more disciplined, deliberate trader.
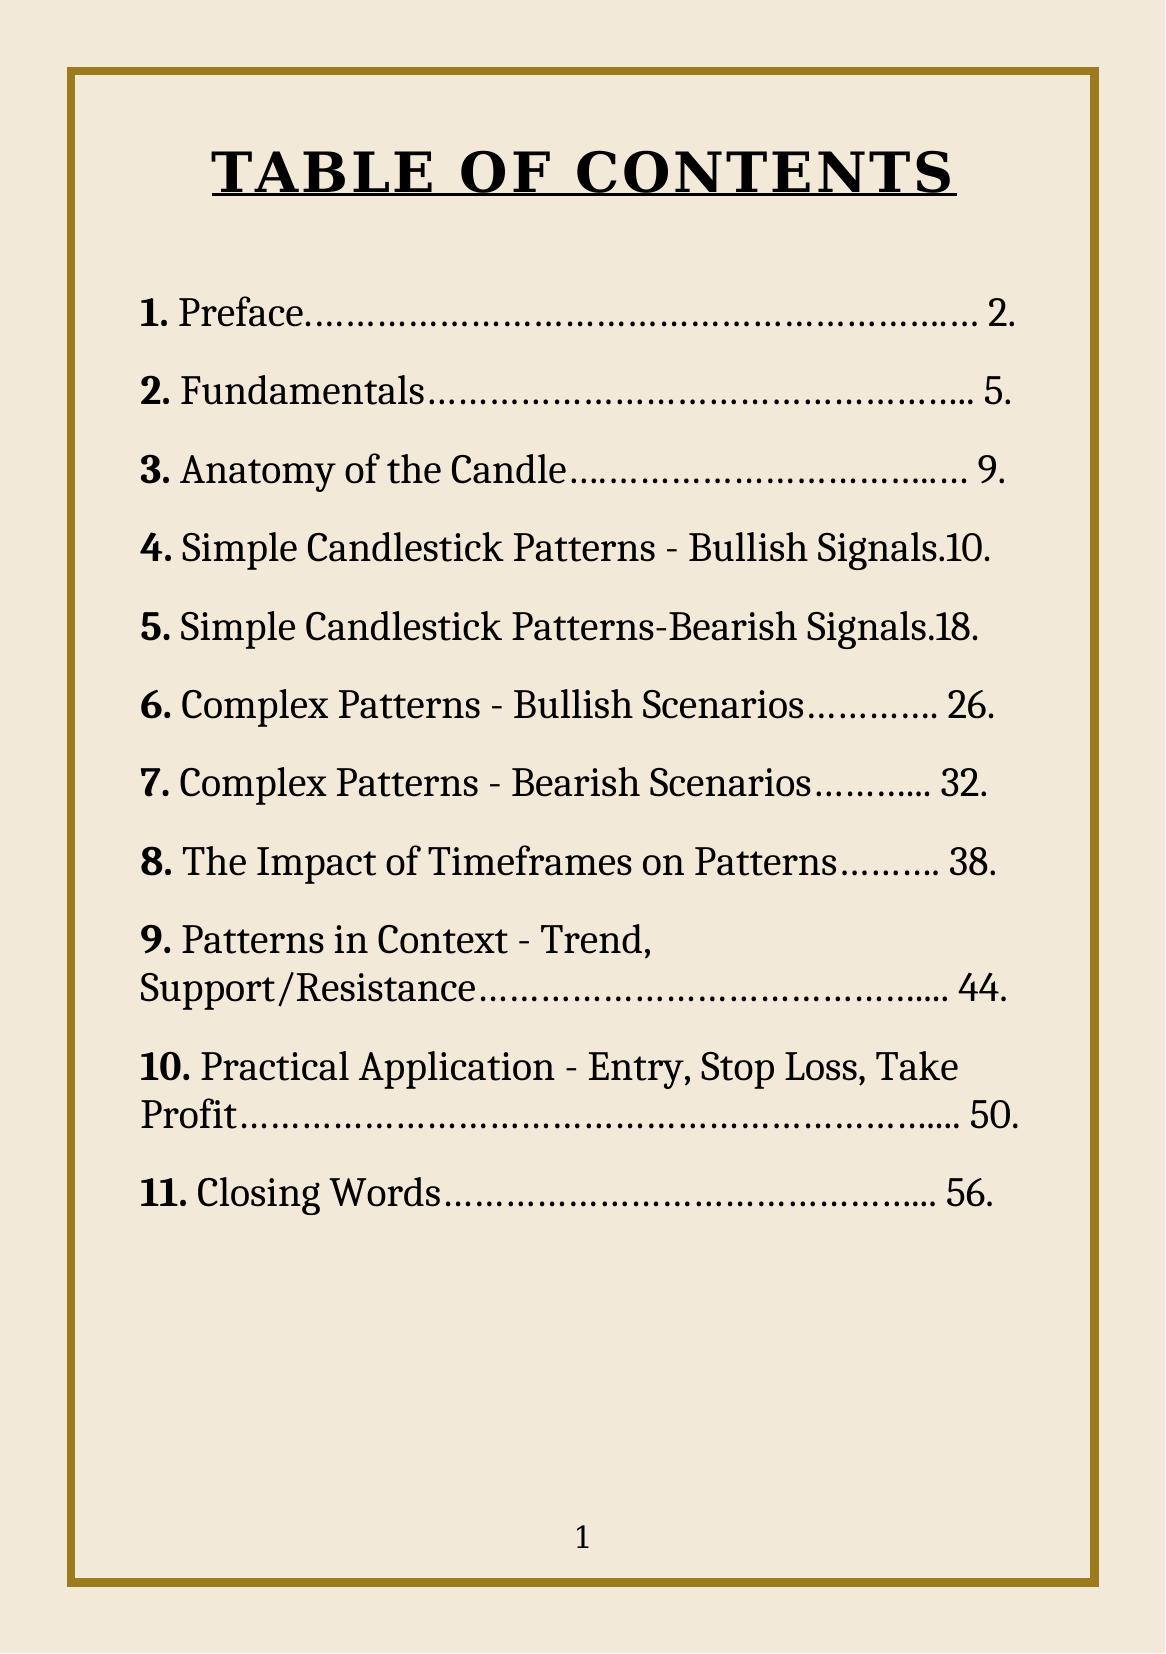
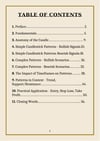
TABLE OF CONTENTS
1. Preface.…………………………………………………….… 2.
2. Fundamentals…………………………………………….. 5.
3. Anatomy of the Candle….…………………………..… 9.
4. Simple Candlestick Patterns - Bullish Signals.10.
5. Simple Candlestick Patterns-Bearish Signals.18.
6. Complex Patterns - Bullish Scenarios…………. 26.
7. Complex Patterns - Bearish Scenarios………... 32.
8. The Impact of Timeframes on Patterns………. 38.
9. Patterns in Context - Trend, Support/Resistance…………………………………….... 44.
10. Practical Application - Entry, Stop Loss, Take Profit………………………………………………………….... 50.
11. Closing Words………………………………………... 56.