
Water Consumption Analytics & Leak Detection Toolkit: sub-meter balance, night flow and leak log for hotels
Full description
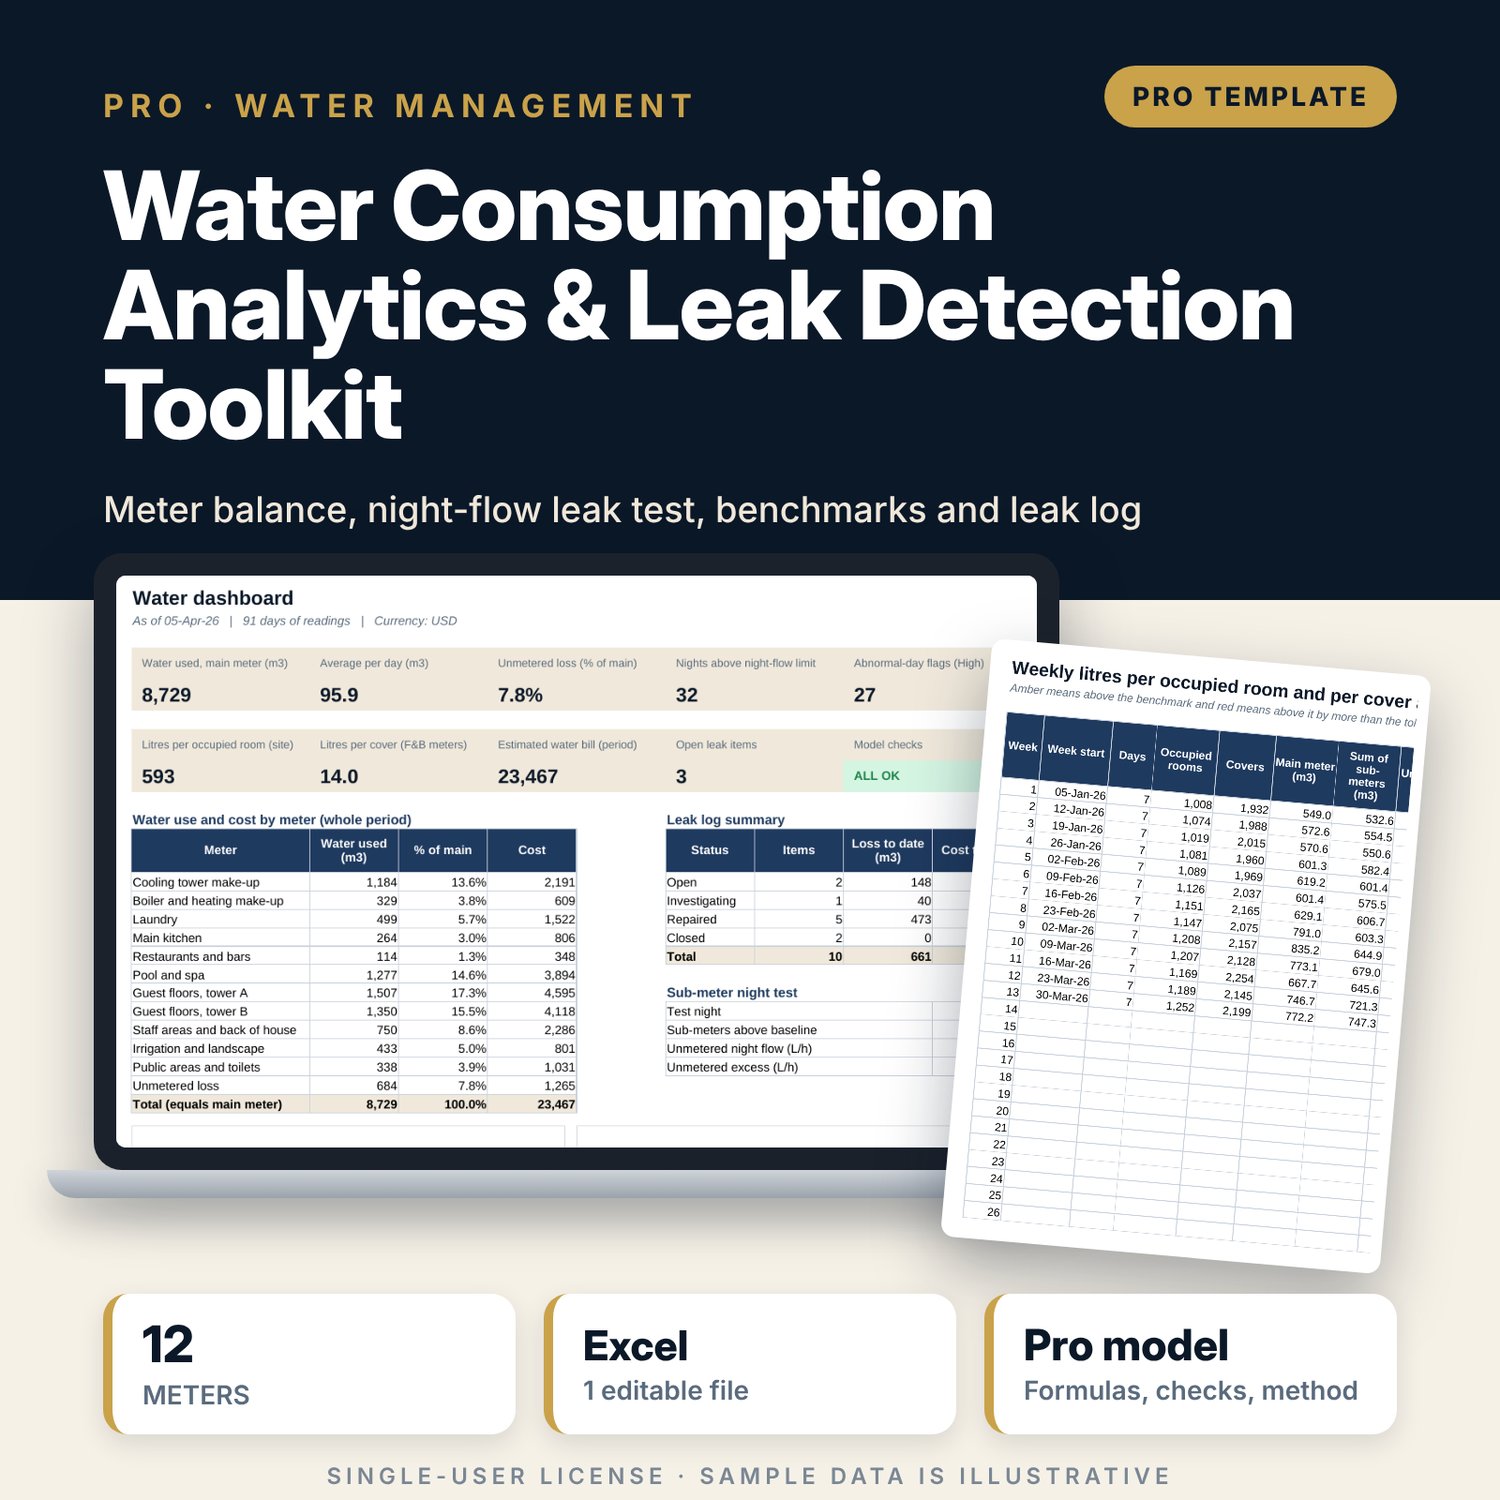
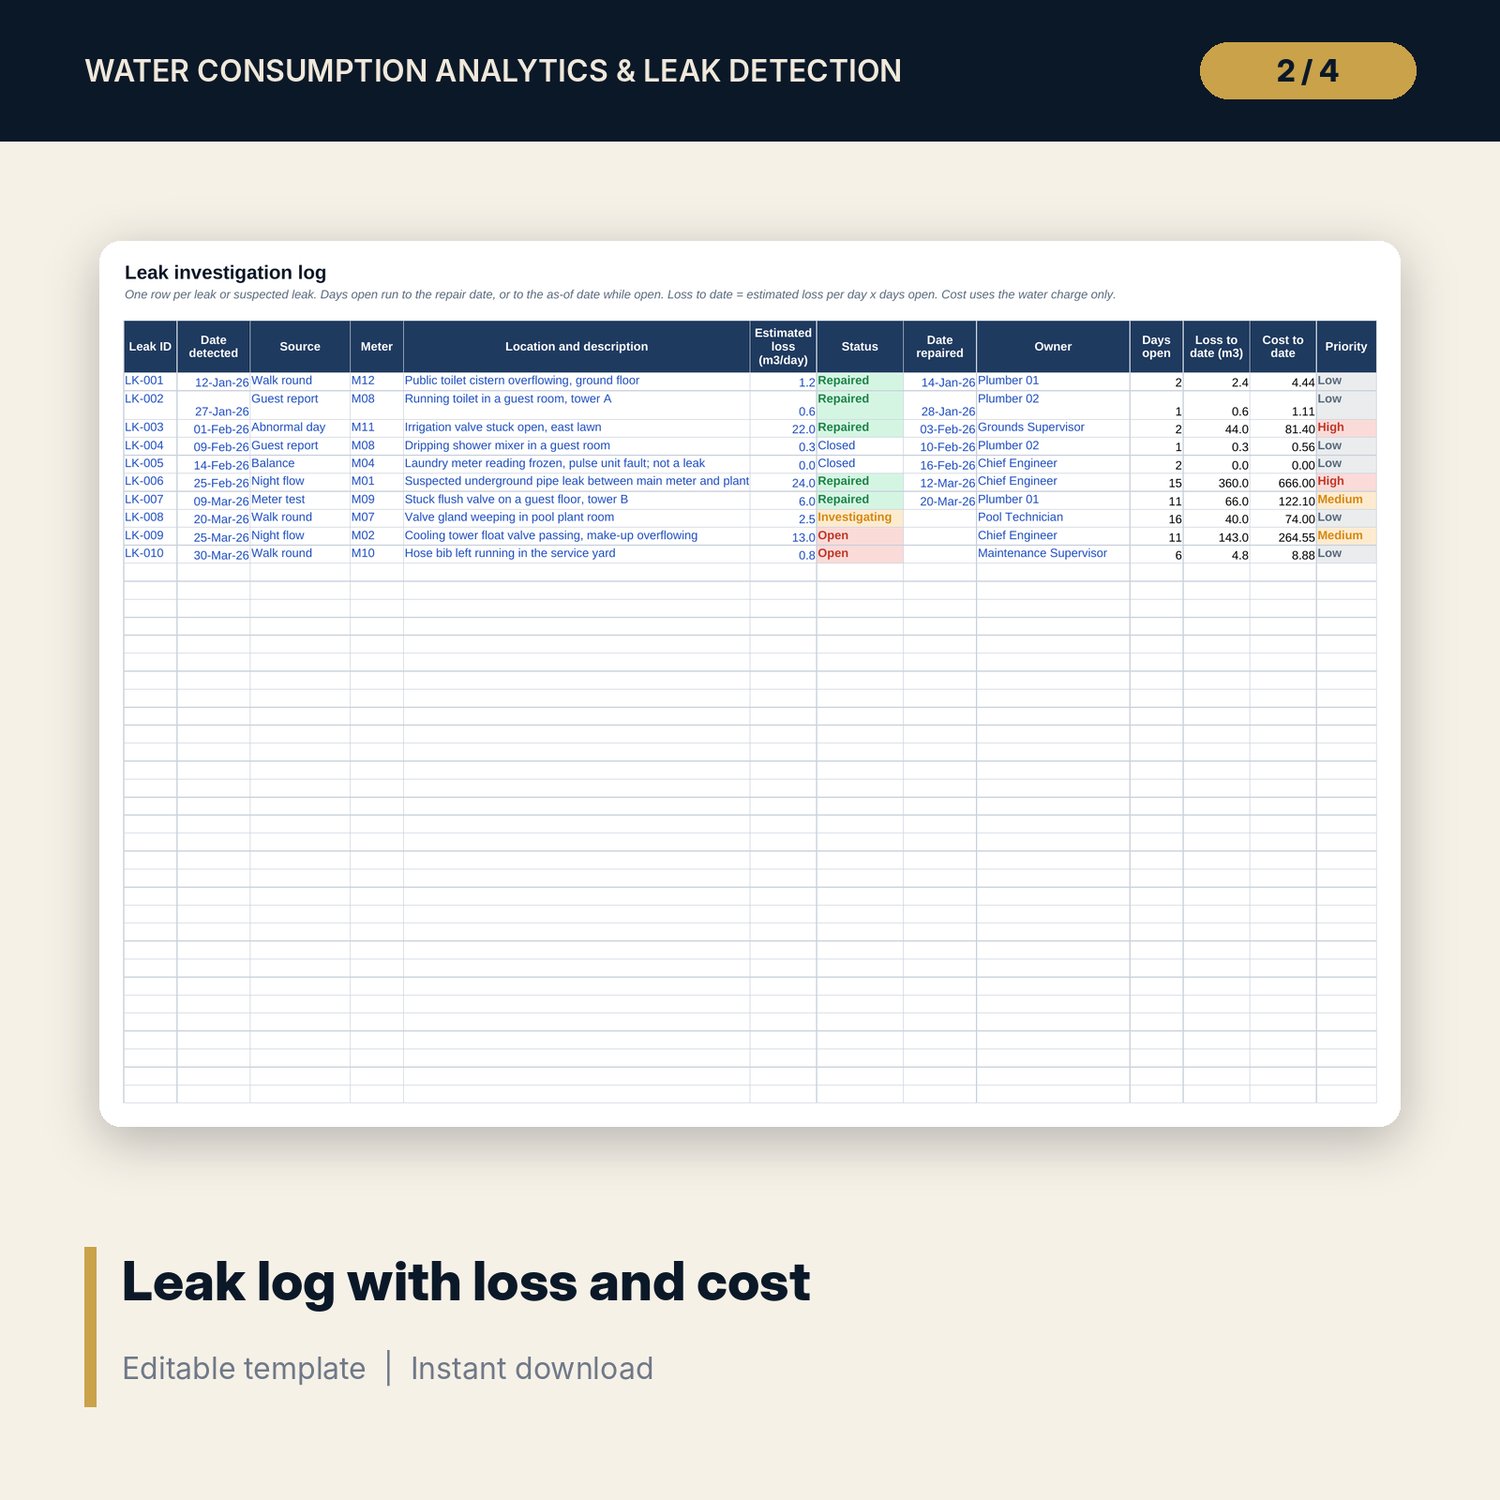
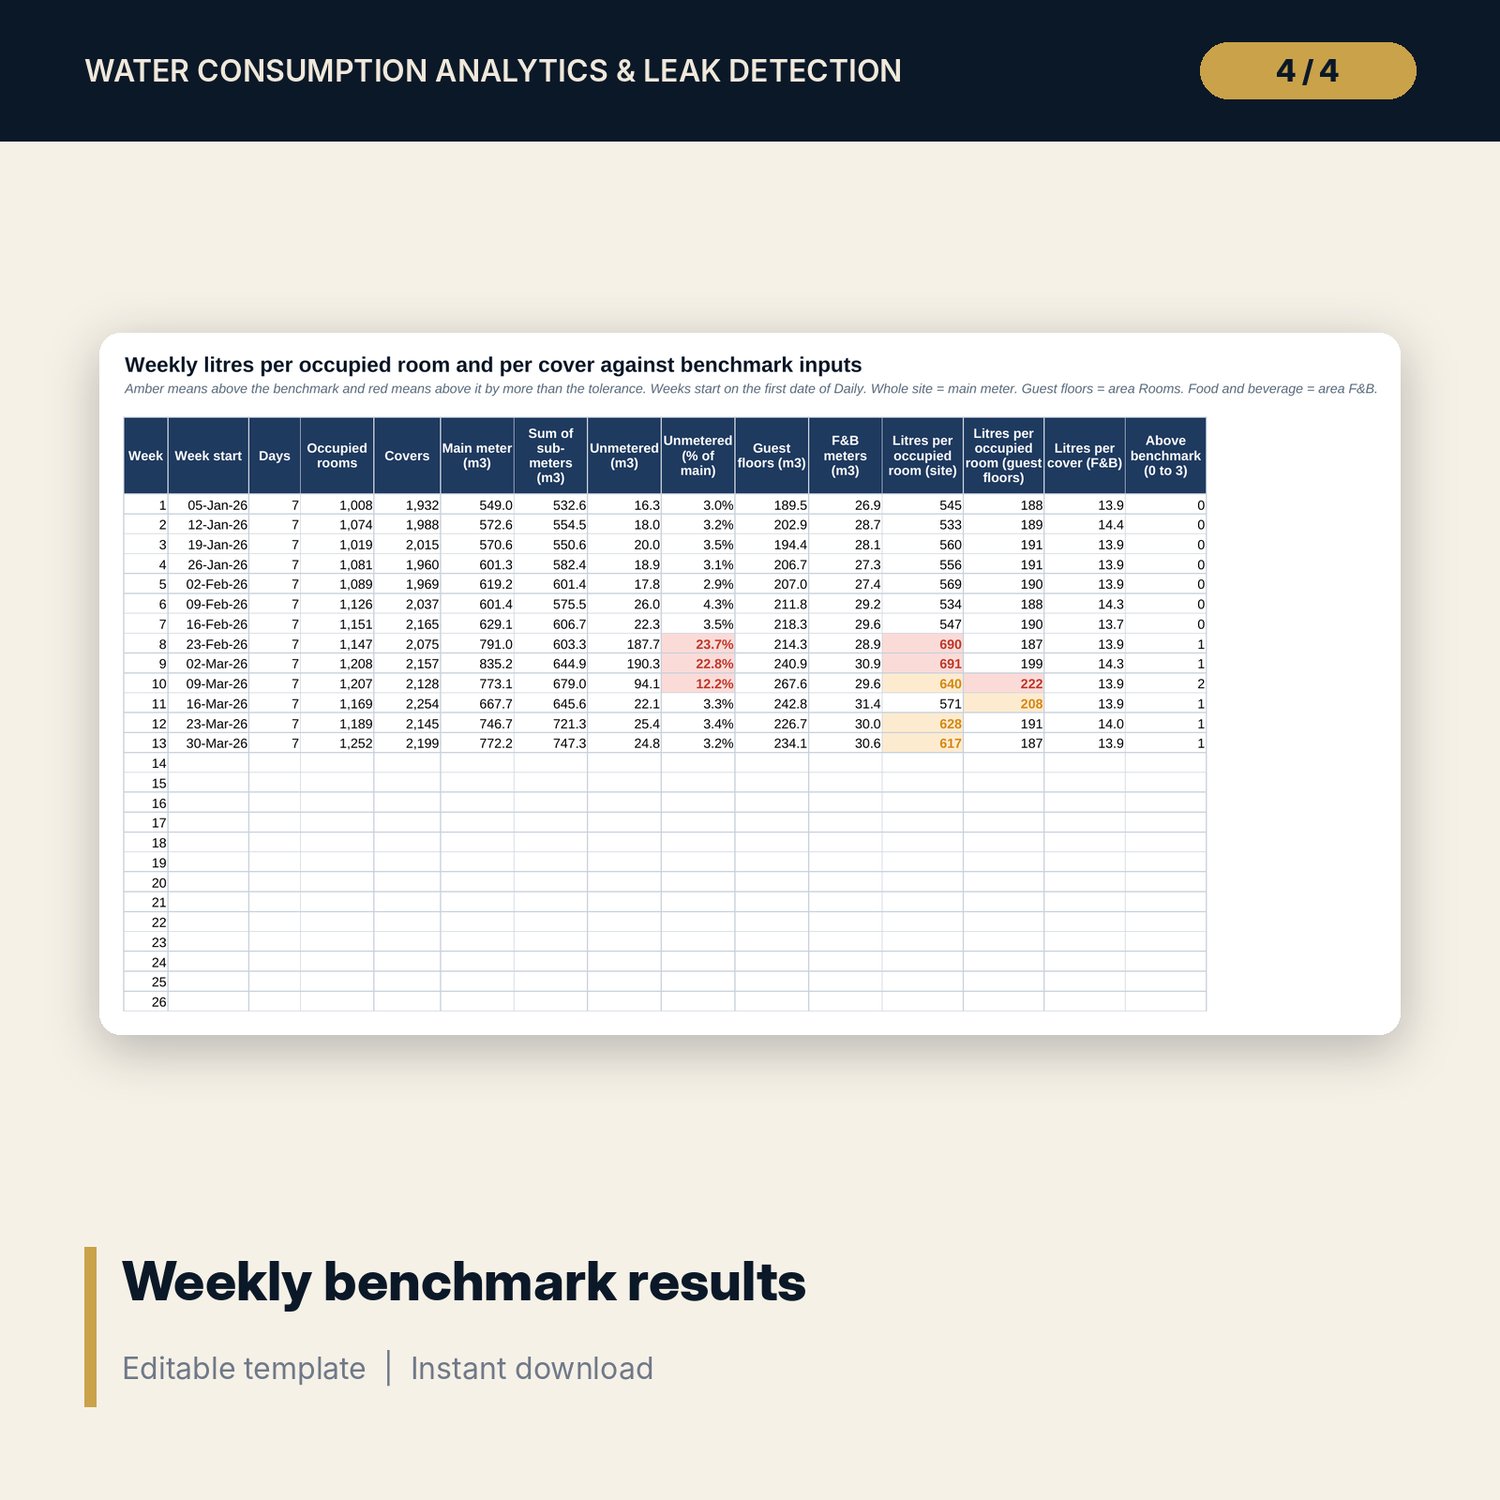
For chief engineers, hotel general managers, resort operations managers and sustainability leads who need to know where the water goes and when a leak starts. Enter a daily reading for each of 12 meters (main, cooling tower, boiler, laundry, kitchen, restaurants, pool, two guest floor towers, staff areas, irrigation and public areas) with occupied rooms and covers. The workbook calculates use per meter, unmetered loss as the main meter minus the sum of the sub-meters, and abnormal days from a rolling mean plus K standard deviations (K = 2 by default). It tests night flow on the main meter and on every sub-meter, compares litres per occupied room and per cover with benchmark inputs you set, prices each meter, and keeps a leak investigation log with days open, loss and cost to date.
Save with a bundle: this workbook is also in the Hotel Engineering & MEP Pro Bundle, 25 workbooks for $59 instead of $319. All 100 Pro workbooks are in the Pro Library for $119, and all 241 templates and workbooks are in the Ultimate Hospitality Library for $149.
What is inside
- Water_Consumption_Leak_Detection_Toolkit.xlsx: 12 tabs, 10,506 formulas, 4 native charts, 11 data validation rules, 15 integrity checks and a Method tab with 17 calculation notes.
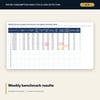
- Sample data (illustrative): 12 meters, 91 days of readings (1,104 meter readings with rooms and covers), 91 nights of night-flow readings, a sub-meter night test, 10 leak log entries and 13 weeks of benchmark results.
- Room for 182 days of readings, 182 nights, 26 weeks and 40 leak log rows, with formulas already in place.
- Abnormal tab: High and Low flags for every meter and day, plus a one-meter explorer that shows the rolling mean, SD and limits.
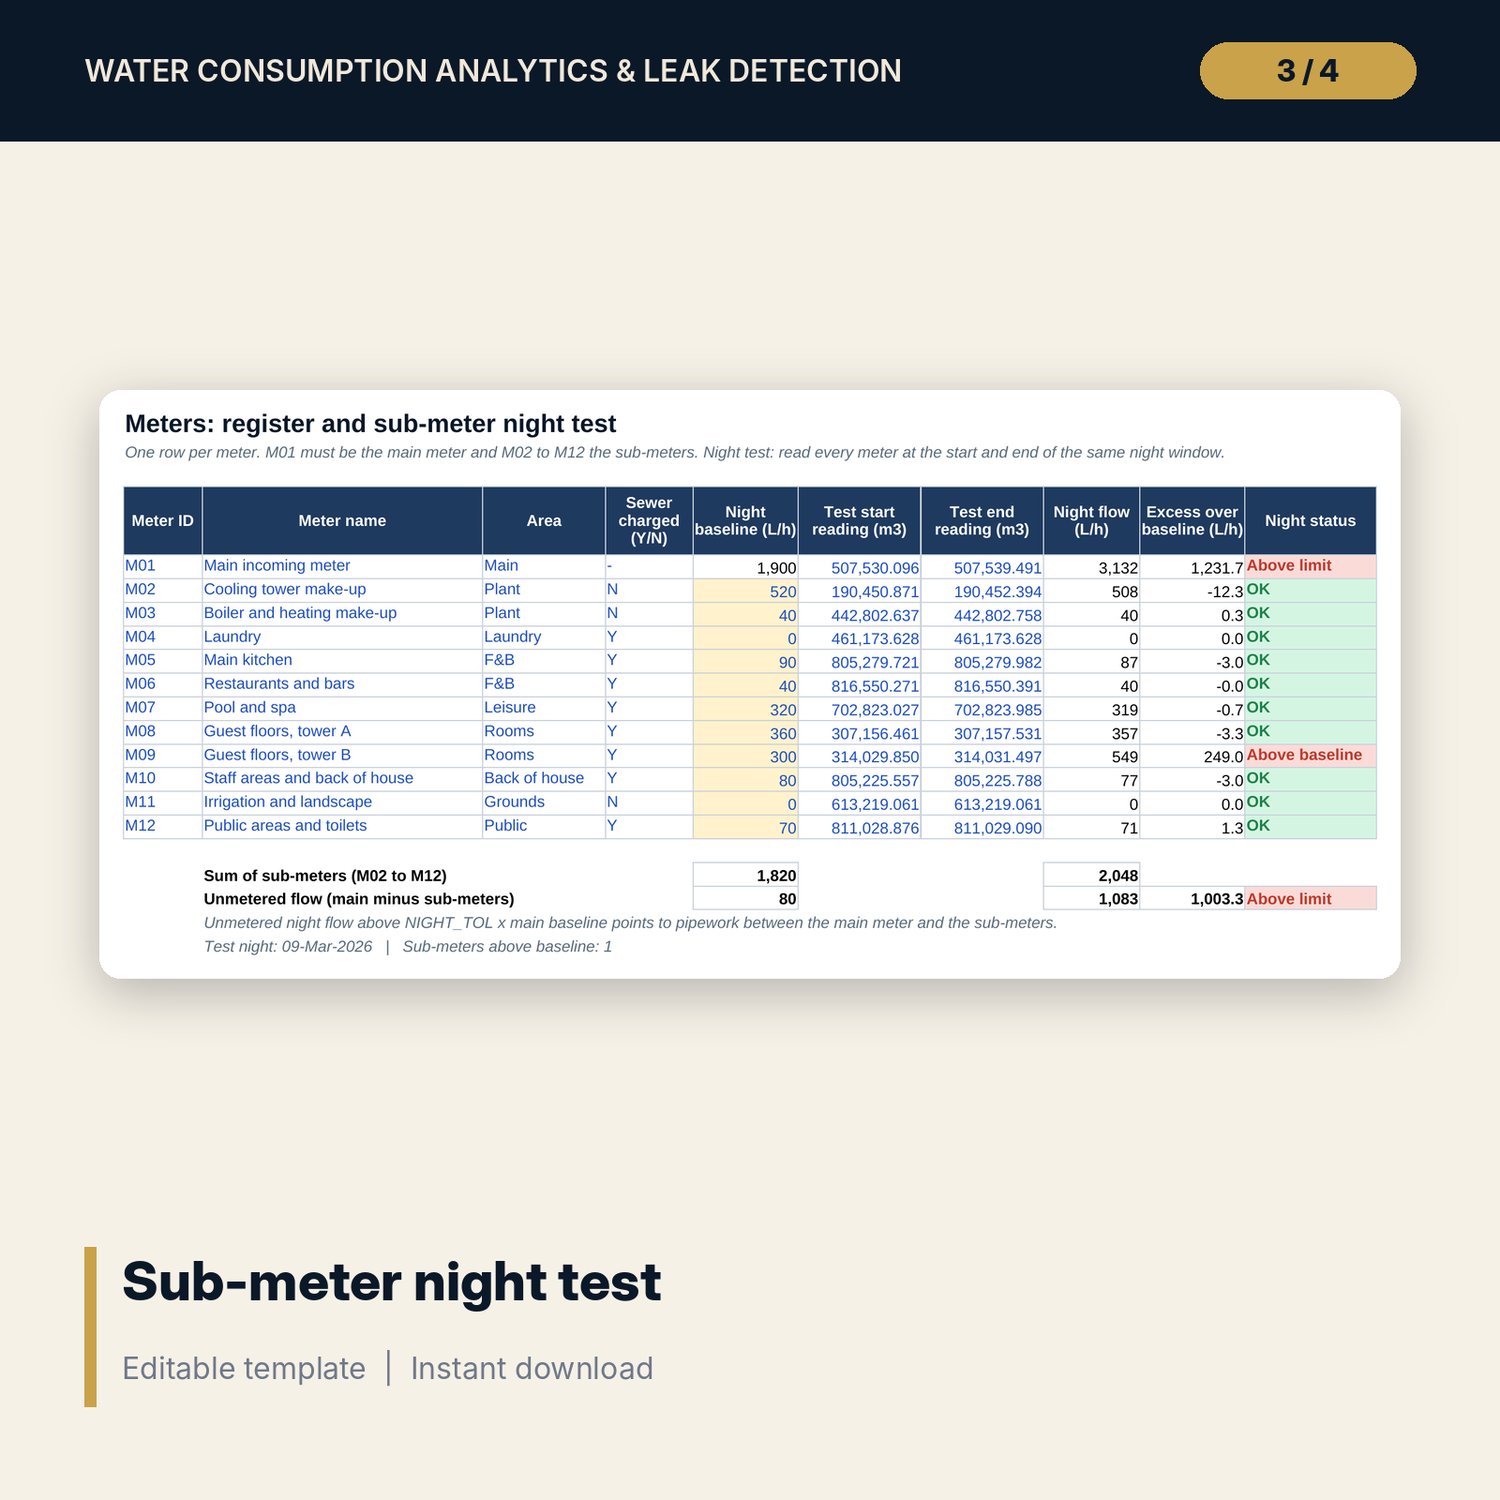
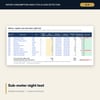
- Night_Flow and Meters tabs: nights in a row above the limit, leak alert, estimated loss per day, and unmetered night flow from the sub-meter test.
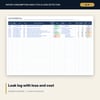
- Leak_Log with a cost-of-leak grid by flow and days open.
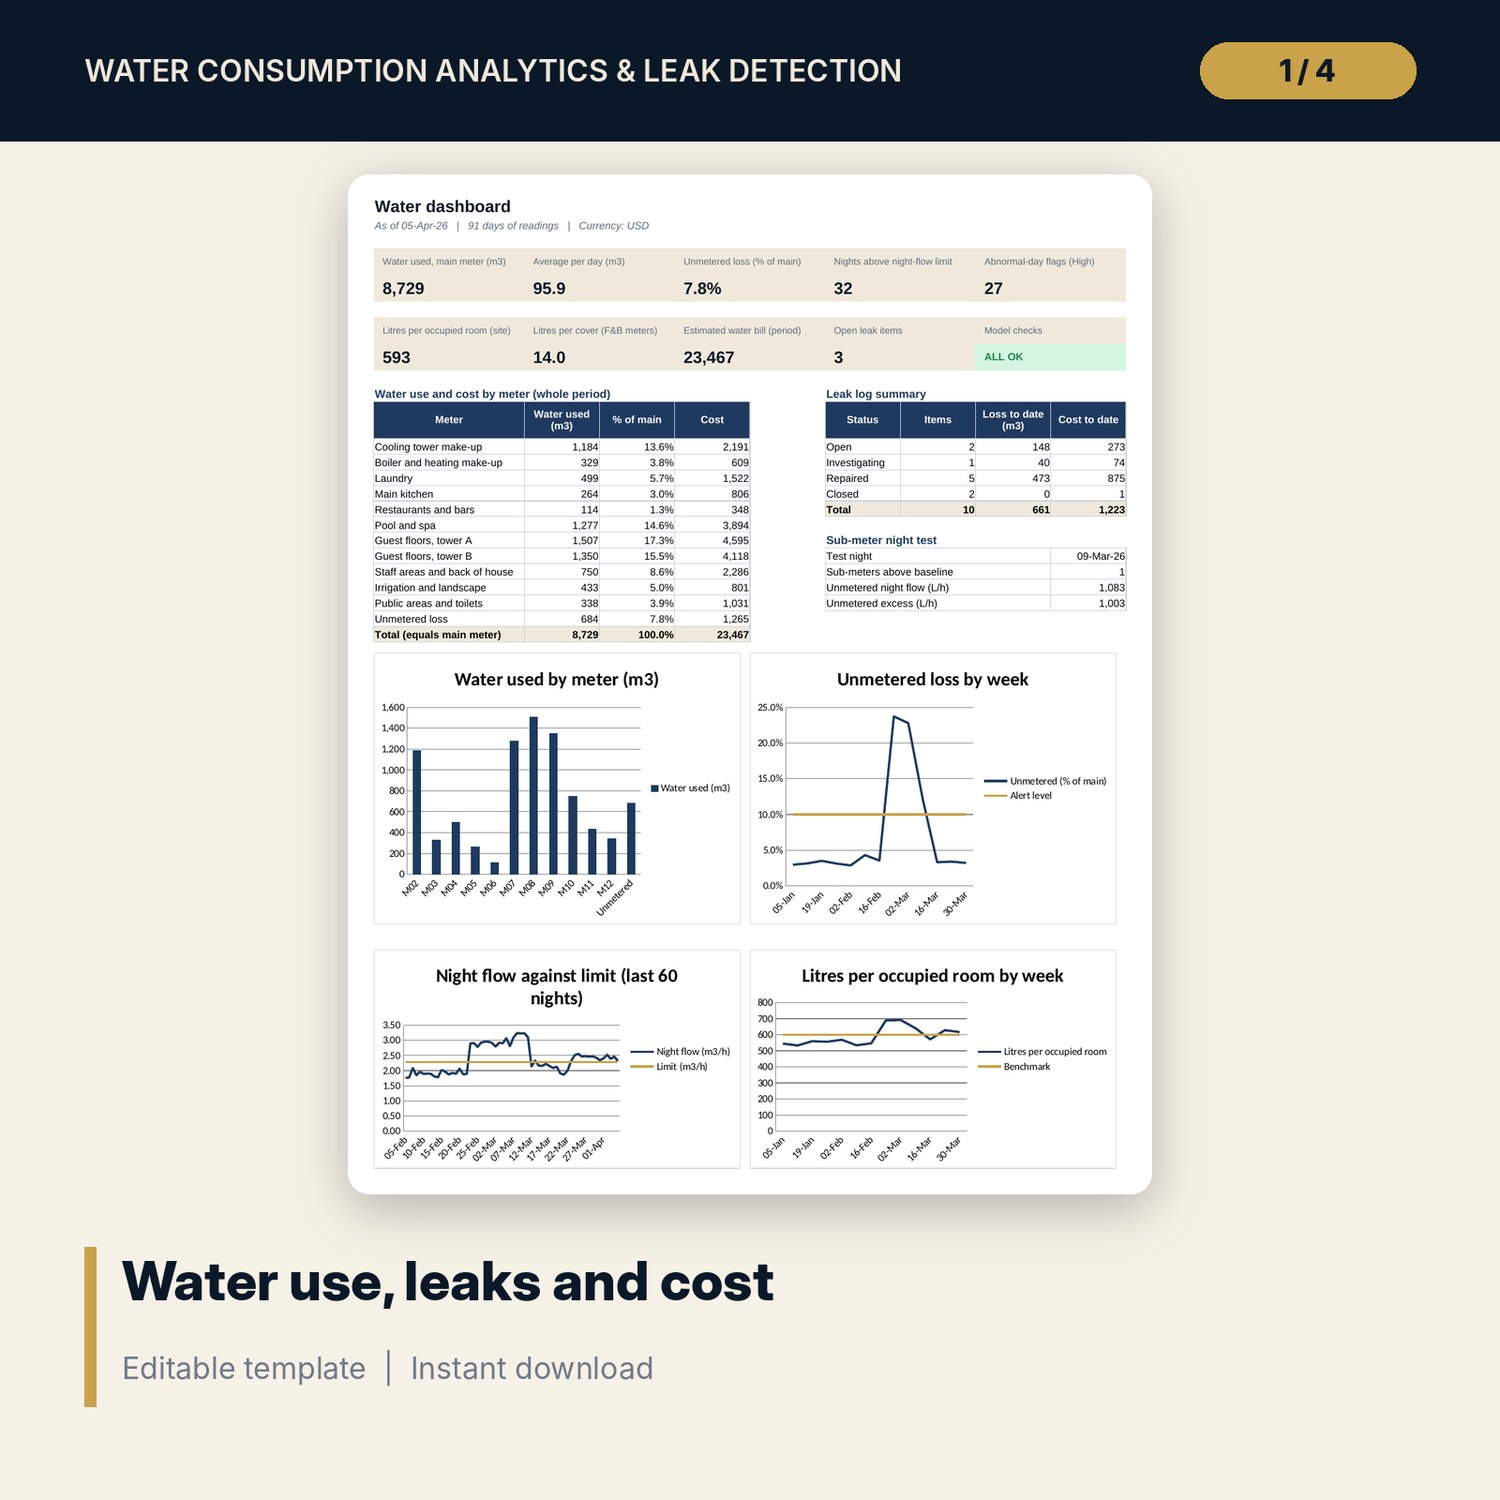
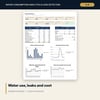
- Dashboard: nine KPI tiles, a check tile, water and cost by meter, leak log summary and four charts, printable on one page.
- README.txt and LICENSE-and-Terms.txt.
How it works
- Enter tariffs, loss thresholds, night-flow limits and benchmarks on Settings.
- Name the 12 meters on Meters and enter the daily index of each meter on Readings, with occupied rooms and covers.
- Enter the start and end reading of the main meter for each night on Night_Flow.
- Read the Dashboard, Abnormal and Benchmarks to see unmetered loss, flagged days and weeks above benchmark.
- Run the sub-meter night test, record each suspected leak on Leak_Log and confirm the Checks tab shows ALL OK.
Details
- Format: XLSX workbook, one file.
- Language: English.
- Software: Excel 2016 or later, or LibreOffice Calc. No macros, no add-ins.
- Units: m3 by default. A multiplier on Settings converts litres or gallons.
- Capacity: 12 meters, 182 days, 182 nights, 40 leak log rows.
- Delivery: instant download.
Good to know
- Sample data is illustrative and does not describe any real property. Replace it with your own readings.
- Tariffs, benchmarks, thresholds and night-flow limits are examples. Verify local requirements and your utility bill.
- Flags show where to look. They do not prove a leak. Confirm on site. The workbook is not engineering or plumbing advice.
- Single-user license.
FAQ
How is unmetered loss calculated?
It is the main meter use minus the sum of the 11 sub-meters, per day and per week, shown as a share of the main meter. Watch and Alert levels are inputs.
How does the night-flow test work?
You read the main meter at the start and end of a night window. Flow is the difference divided by the hours. Nights above the expected flow plus a tolerance are flagged, and several nights in a row raise a leak alert with an estimated loss per day.
How are abnormal days flagged?
A day is High when use is above the mean of the previous days plus K standard deviations. The window, K and a minimum deviation are inputs. A long leak raises the mean, so flags stop after a few days. The Night_Flow and Leak_Log tabs keep watching.
Can I use litres or gallons?
Yes. Set the multiplier on Settings. Every reading difference is converted to m3 before any other step.
Can I change the meters?
You can rename the 12 meters and change areas, sewer flags and night baselines. The first meter is the main meter and the other 11 are sub-meters.