Speedometer Chart Template - Excel Template
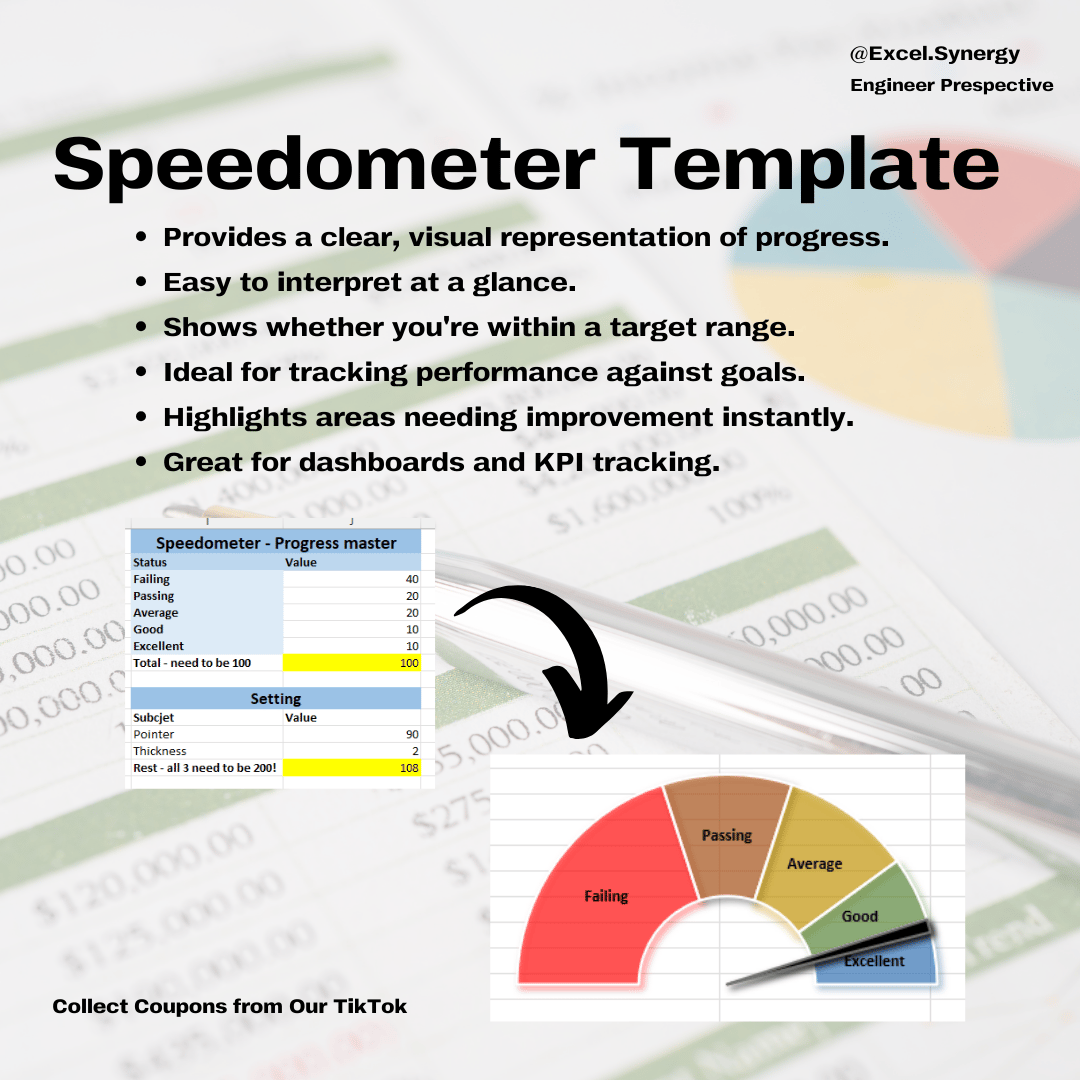
A Speedometer Chart, also known as a gauge chart, is a visually dynamic way to represent data that shows progress toward a target or goal.
This type of chart mimics a speedometer, using an arc to display values within a range, with a needle indicating the current performance.
It's especially useful for tracking metrics like sales performance, customer satisfaction, or any key performance indicator (KPI).
By offering a quick, intuitive snapshot of progress, speedometer charts make it easy to assess whether you’re on track or need to adjust course.
Important Instructions:
------------------------
Compatibility Notice: To use this template, you’ll need either Office 2016 or later or a Microsoft Excel 365 subscription. Please note that it is not compatible with Google Sheets or any other software.
We're Here to Help: If you have any questions or need assistance, don’t hesitate to reach out! Remember, this template is for personal use only, and you cannot use any part of it to create products for sale or for public/commercial purposes.
Digital Product Policy: Please be aware that due to the nature of digital products, we cannot accept refunds, returns, exchanges, or cancellations.
*This is a digital product, ready for immediate download after your purchase! Enjoy the convenience of no waiting and no shipping fees—buy once, and it’s yours forever!
Please note: No physical product will be shipped.