Dashboard - Excel Template
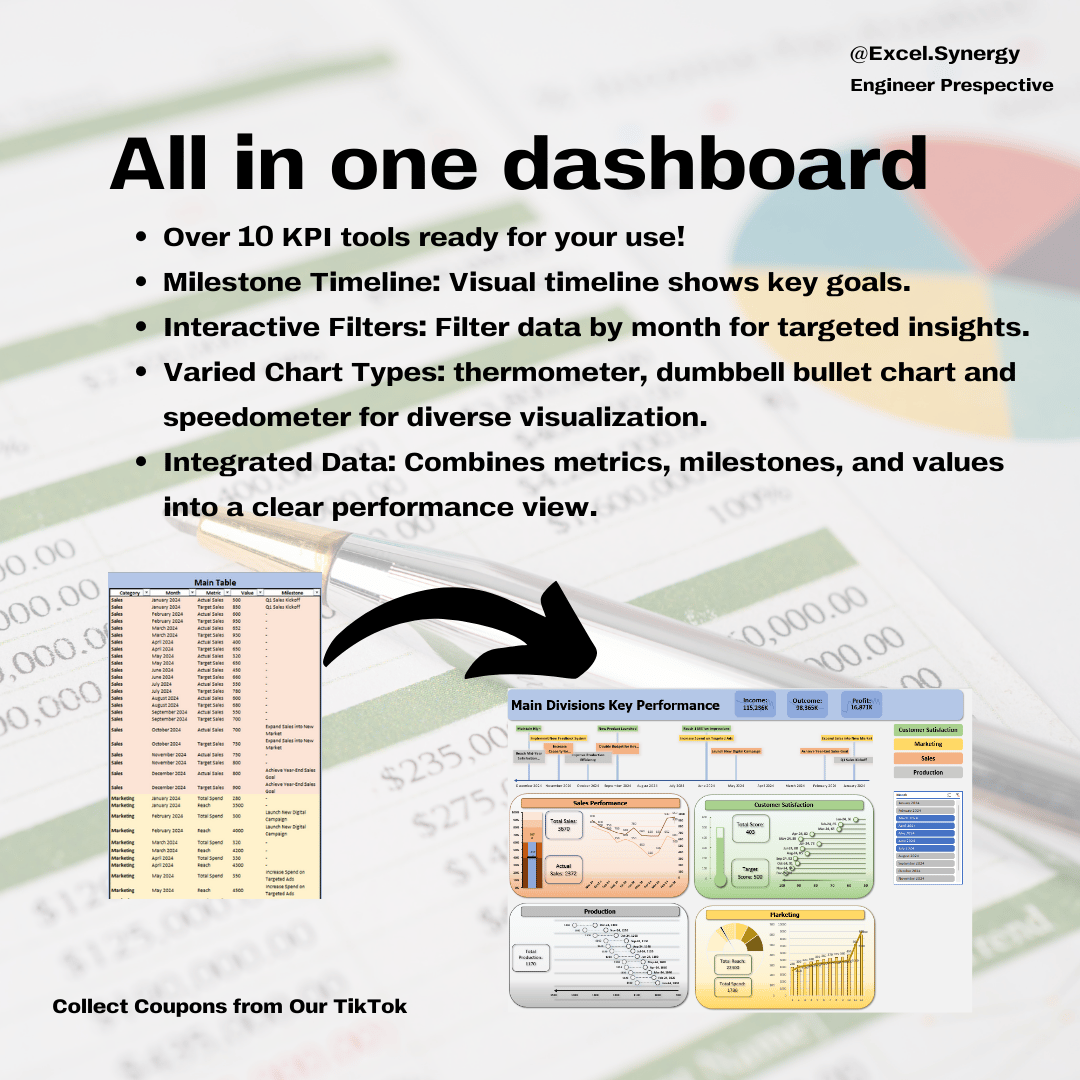
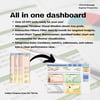
This dashboard offers a comprehensive view of the performance of the main divisions in the company, including marketing, sales, customer satisfaction, and production.
It tracks key metrics over time, providing an at-a-glance understanding of each department's progress toward its goals.
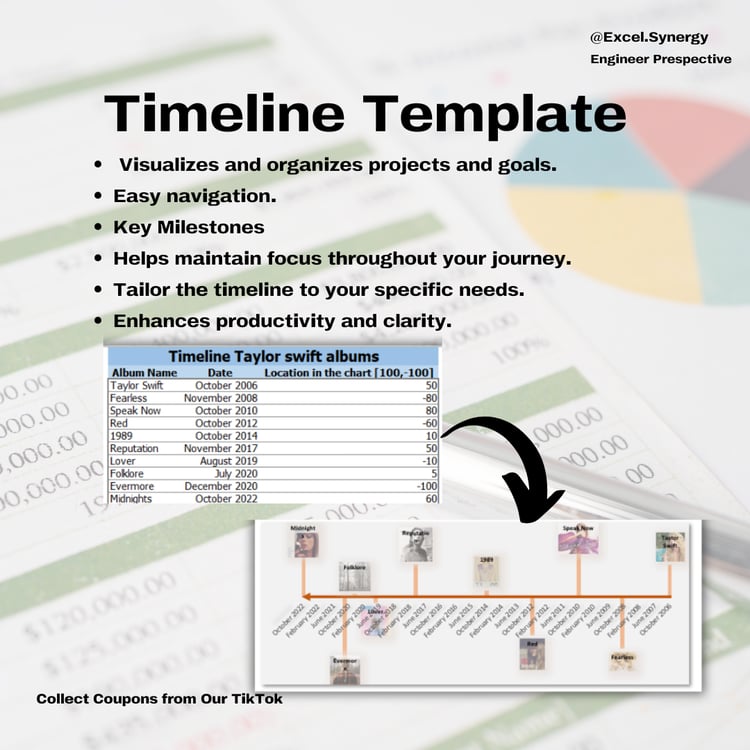
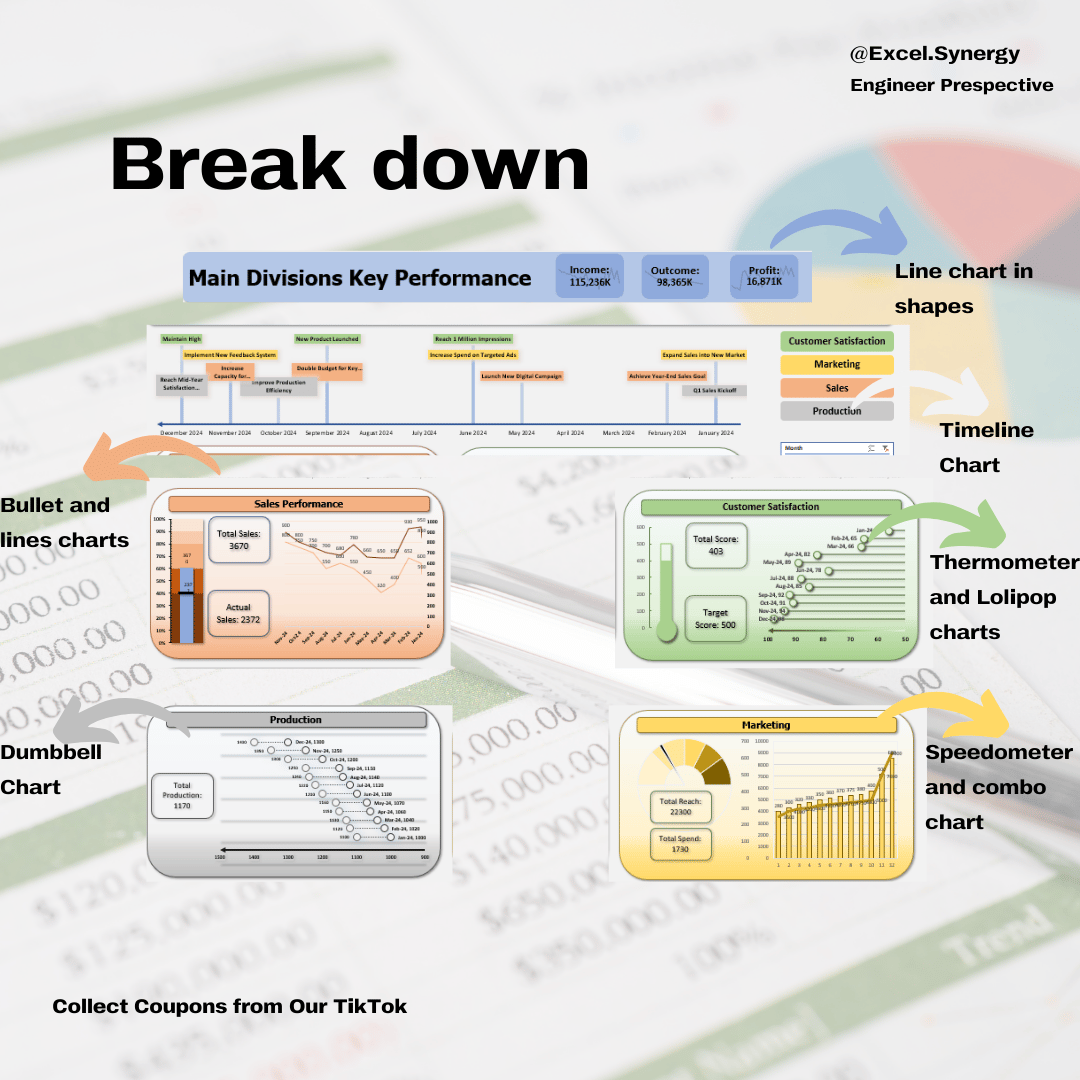
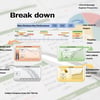
The timeline at the top highlights key milestones for each division, such as launching new campaigns, expanding into new markets, or improving production efficiency.
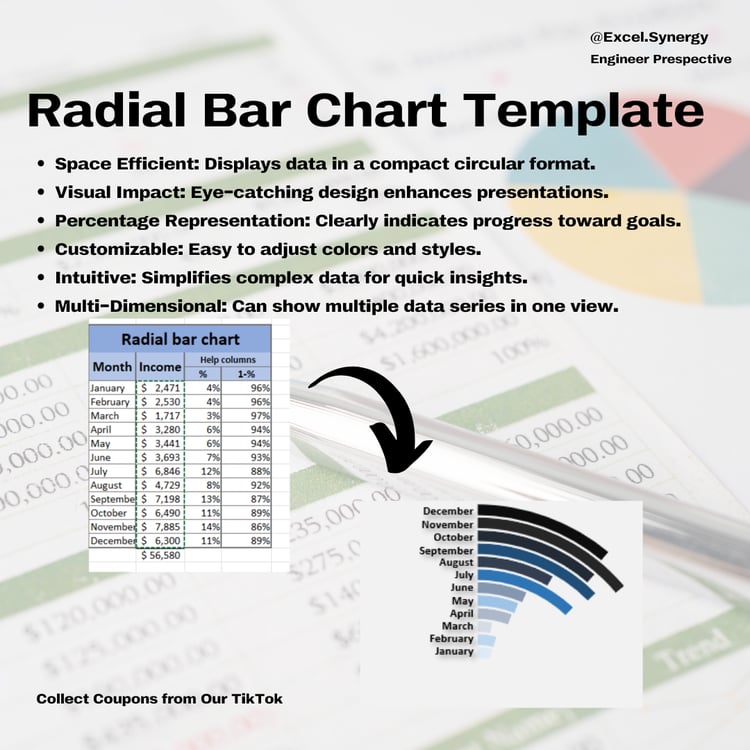
The charts and visualizations below break down metrics like total sales, production output, customer satisfaction scores, and marketing reach.
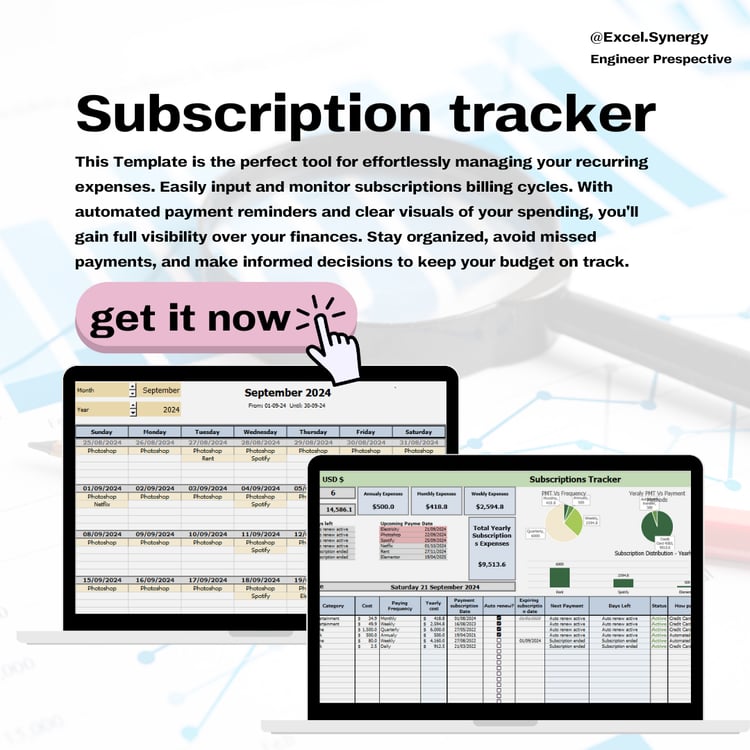
Each section gives a visual representation of how close the division is to reaching its targets, with interactive filters to sort by month.
This design makes it easy for stakeholders to monitor progress, adjust strategies, and focus on areas needing attention.
*Note: All data and calculations are fictional and created purely for graphic purposes. This template is designed for you to modify the KPIs according to your specific needs!
Unique Features:
- Milestone Timeline: A clear, interactive timeline at the top shows important milestones for each division, offering a forward-looking perspective on company goals.
- Interactive Filters: Users can filter by category (Sales, Marketing, Production, Customer Satisfaction) and by month, allowing them to zoom in on specific data points and periods.
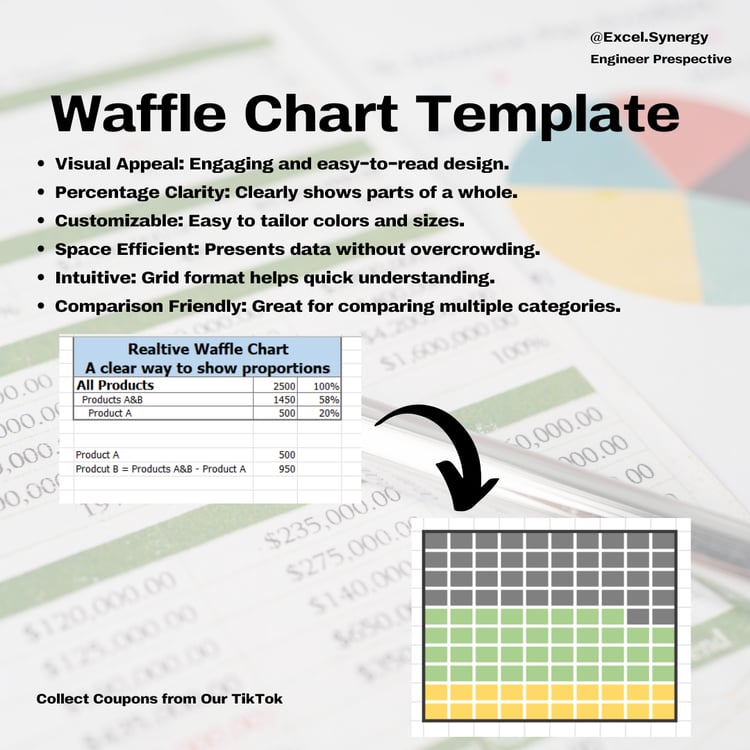
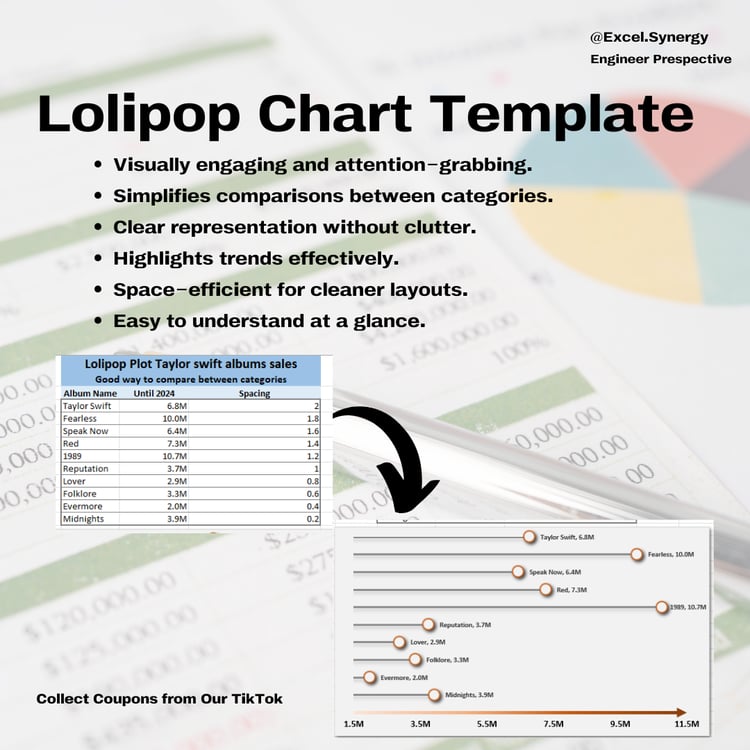
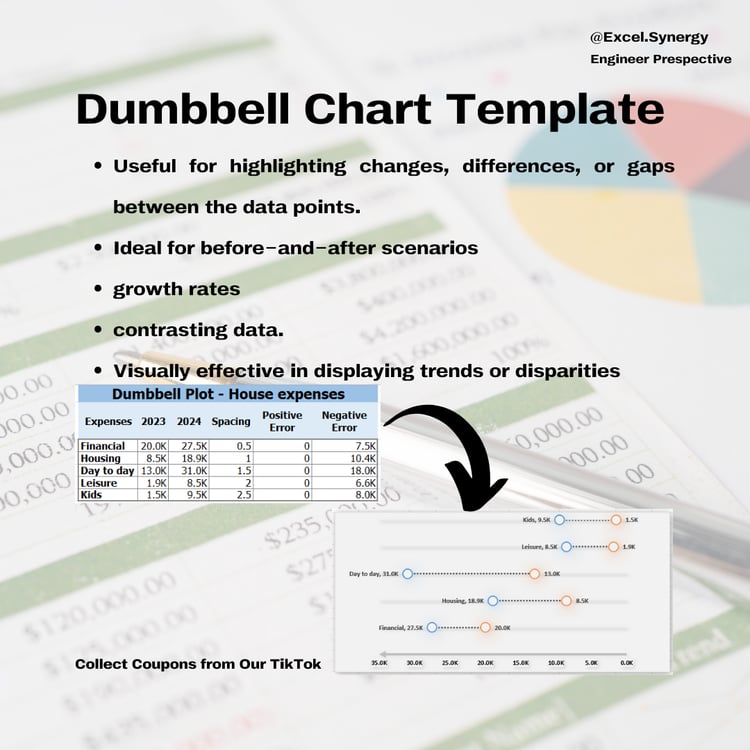
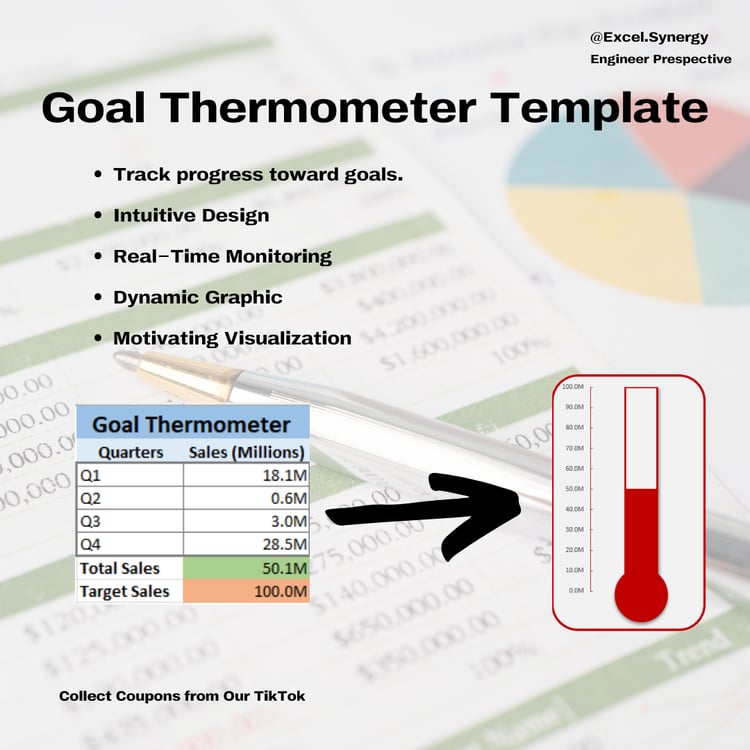
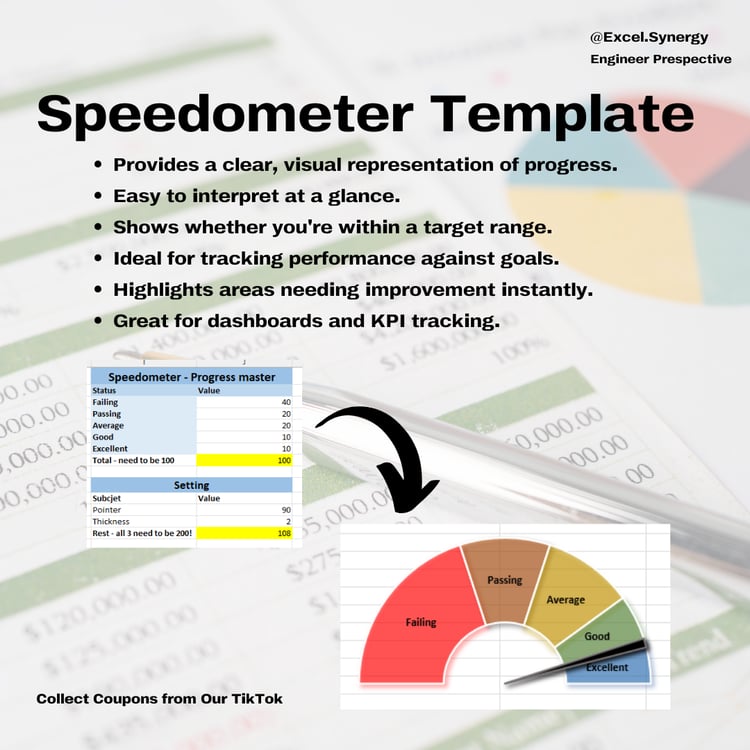
- Multiple Chart Types: The dashboard combines various charts like the thermometer chart (for customer satisfaction), dumbbell chart (for production comparison), bullet chart (for sales performance) and speedometer chart (for marketing), giving diverse ways to visualize progress.
- Performance Summary: Each section includes a summarized metric (e.g., total sales, total production, and customer satisfaction scores) with an easy-to-read indicator of current performance vs. target, making it intuitive for management to grasp progress quickly.
- Data Integration: It ties together multiple data points—category, month, metric, value, and milestone—into a cohesive story, ensuring that the progress of each department is easy to understand and track over time.
Tabs:
- Dashboard
- Data
Important Instructions:
------------------------
Compatibility Notice: To use this template, you’ll need either Office 2016 or later or a Microsoft Excel 365 subscription. Please note that it is not compatible with Google Sheets or any other software.
We're Here to Help: If you have any questions or need assistance, don’t hesitate to reach out! Remember, this template is for personal use only, and you cannot use any part of it to create products for sale or for public/commercial purposes.
Digital Product Policy: Please be aware that due to the nature of digital products, we cannot accept refunds, returns, exchanges, or cancellations.
*This is a digital product, ready for immediate download after your purchase! Enjoy the convenience of no waiting and no shipping fees—buy once, and it’s yours forever!
Please note: No physical product will be shipped.
You will get a XLSX (185KB) file