Total Revenue Management & Ancillary Spend Analyzer: TRevPAR, ProPAR and Segment Total Guest Value Excel Model
Full description
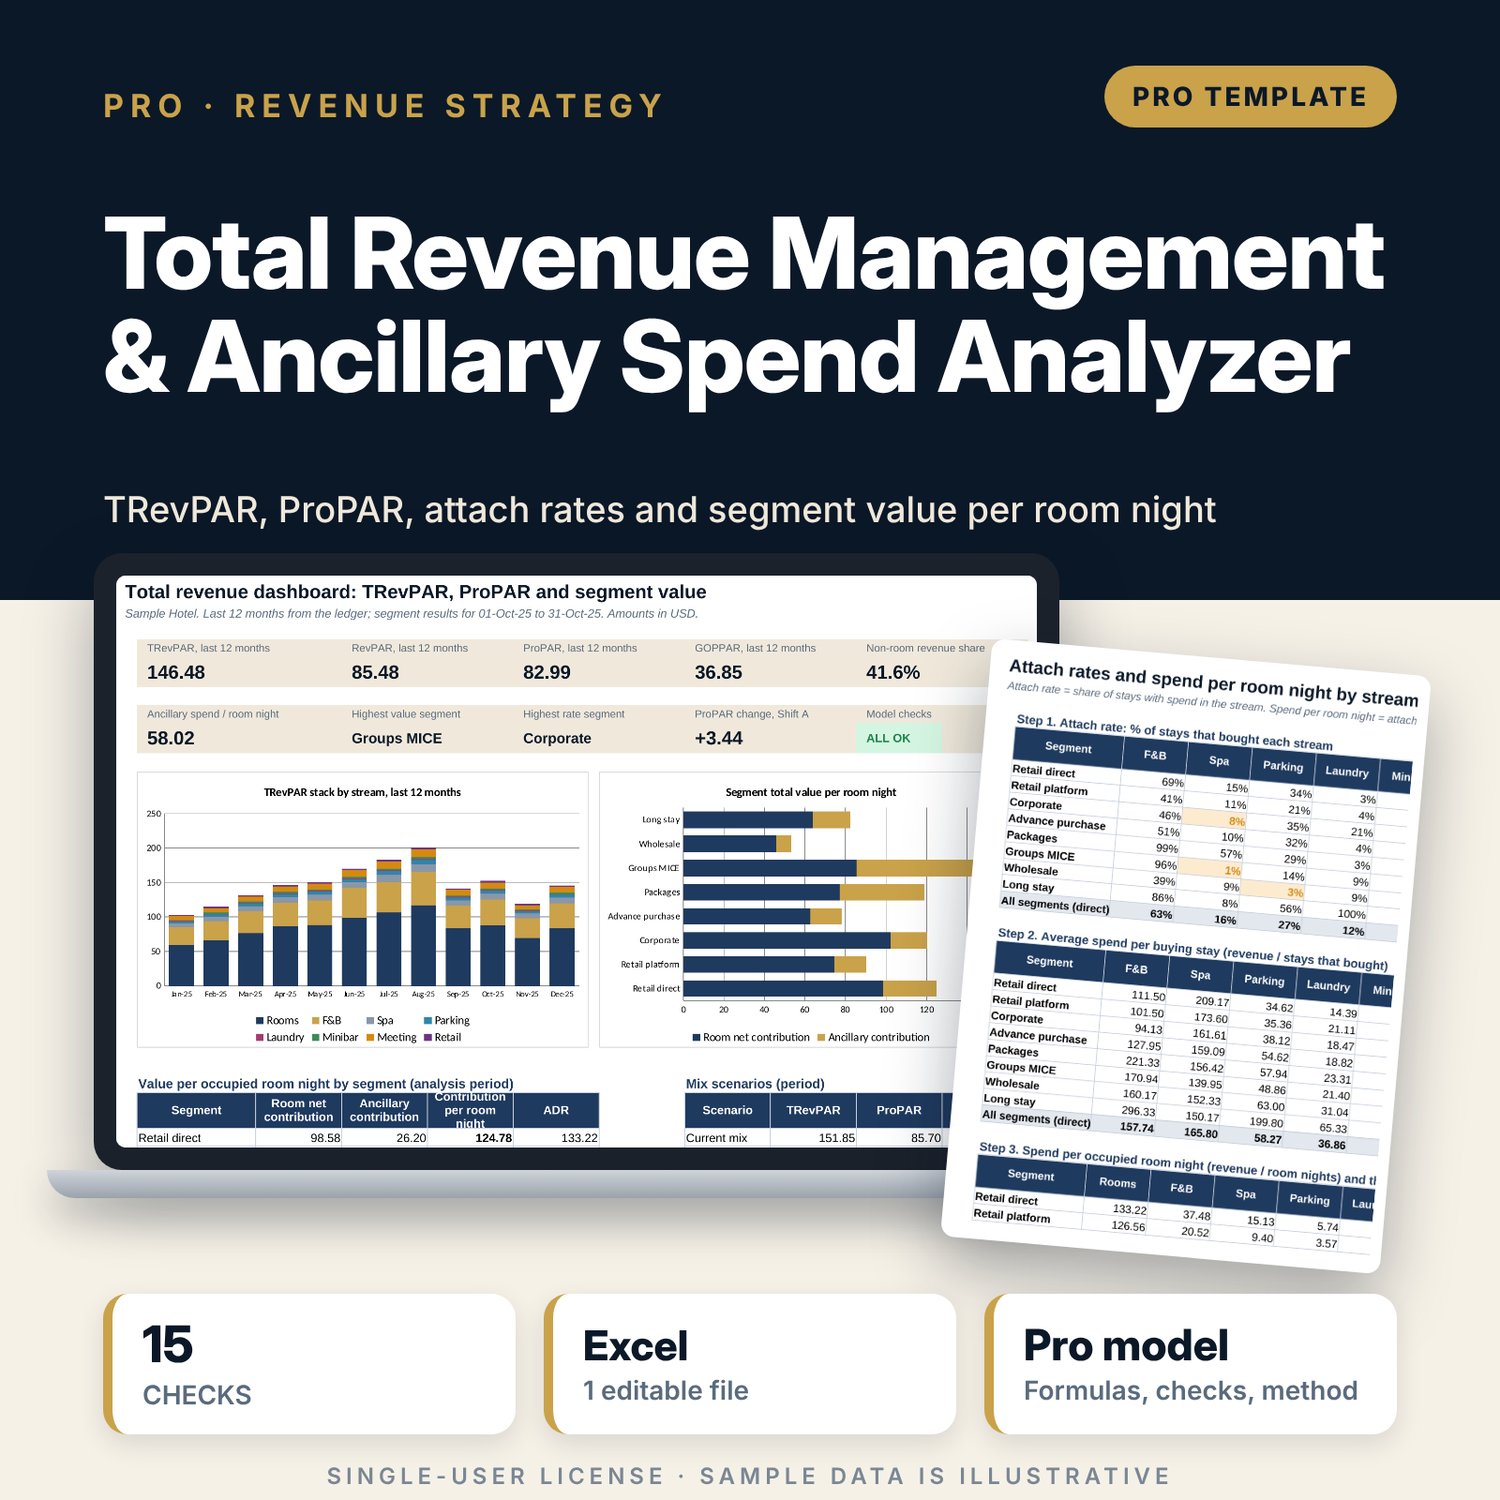
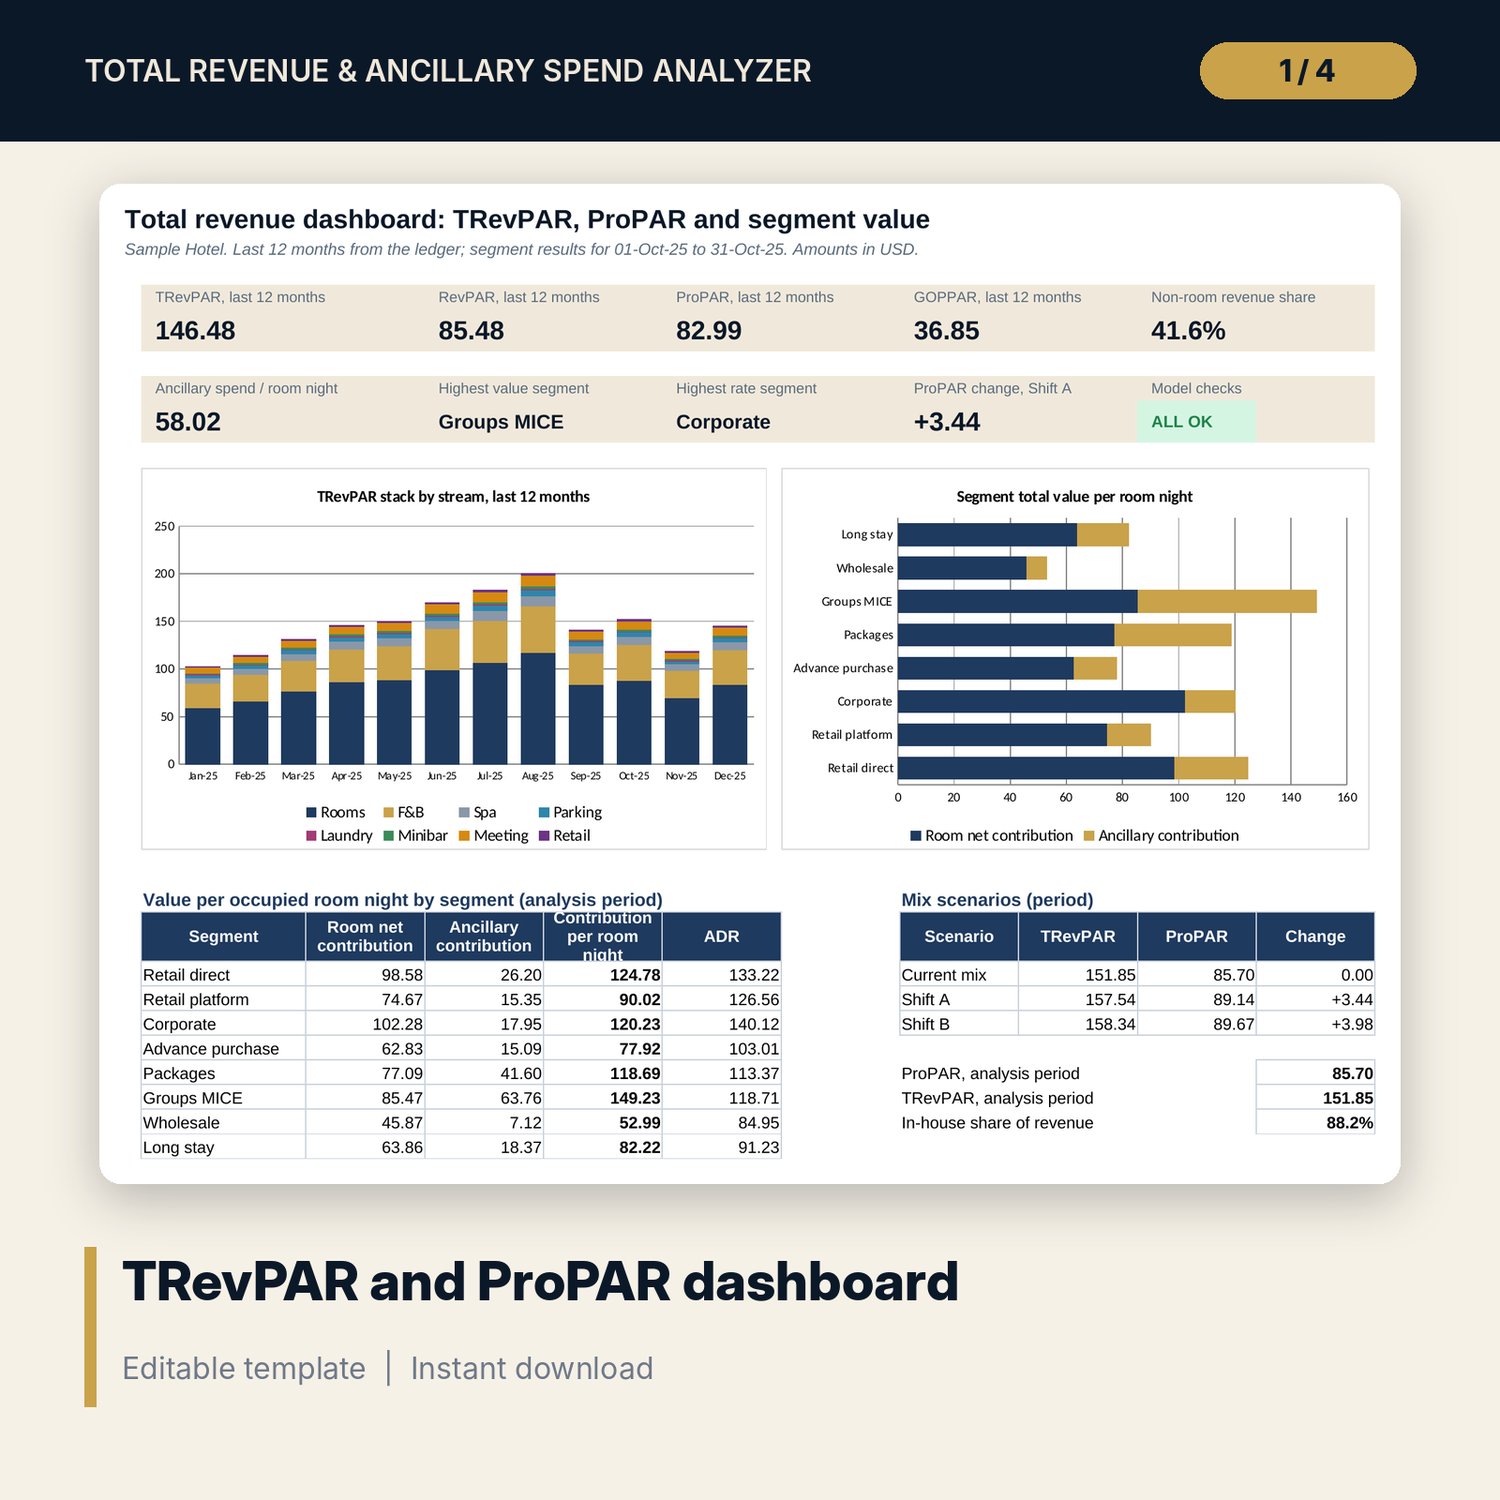
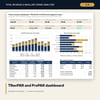
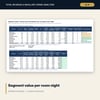
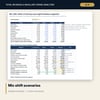
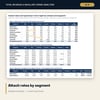
For general managers, revenue managers and financial controllers who price and sell rooms on rate alone. The workbook takes monthly revenue by stream (rooms, F&B outlets, spa, parking, laundry, minibar, meeting space, retail) and one row per guest stay from the folio export. It calculates TRevPAR, ProPAR and GOPPAR with the share each stream contributes, attach rates and spend per occupied room night by segment and by length of stay, and contribution per room night after departmental costs and acquisition costs. Segments are ranked by rate and by total value side by side, so you can see which business is worth more than its rate shows. A mix-shift engine moves room nights between segments and recalculates TRevPAR and ProPAR, with two sensitivity grids that include the rate cut needed to win the moved business.
Save with a bundle: this workbook is also in the Hotel Revenue & Data Analytics Pro Bundle, 25 workbooks for $59 instead of $319. All 100 Pro workbooks are in the Pro Library for $119, and all 241 templates and workbooks are in the Ultimate Hospitality Library for $149.
What is inside
- Total_Revenue_Ancillary_Spend_Analyzer.xlsx: 12 tabs, 17,987 formulas, 4 native charts, 12 drop-down and input rules
- Stays tab with 811 sample stays across 8 segments and room for 1,500; Monthly_Ledger with 12 sample months and room for 24
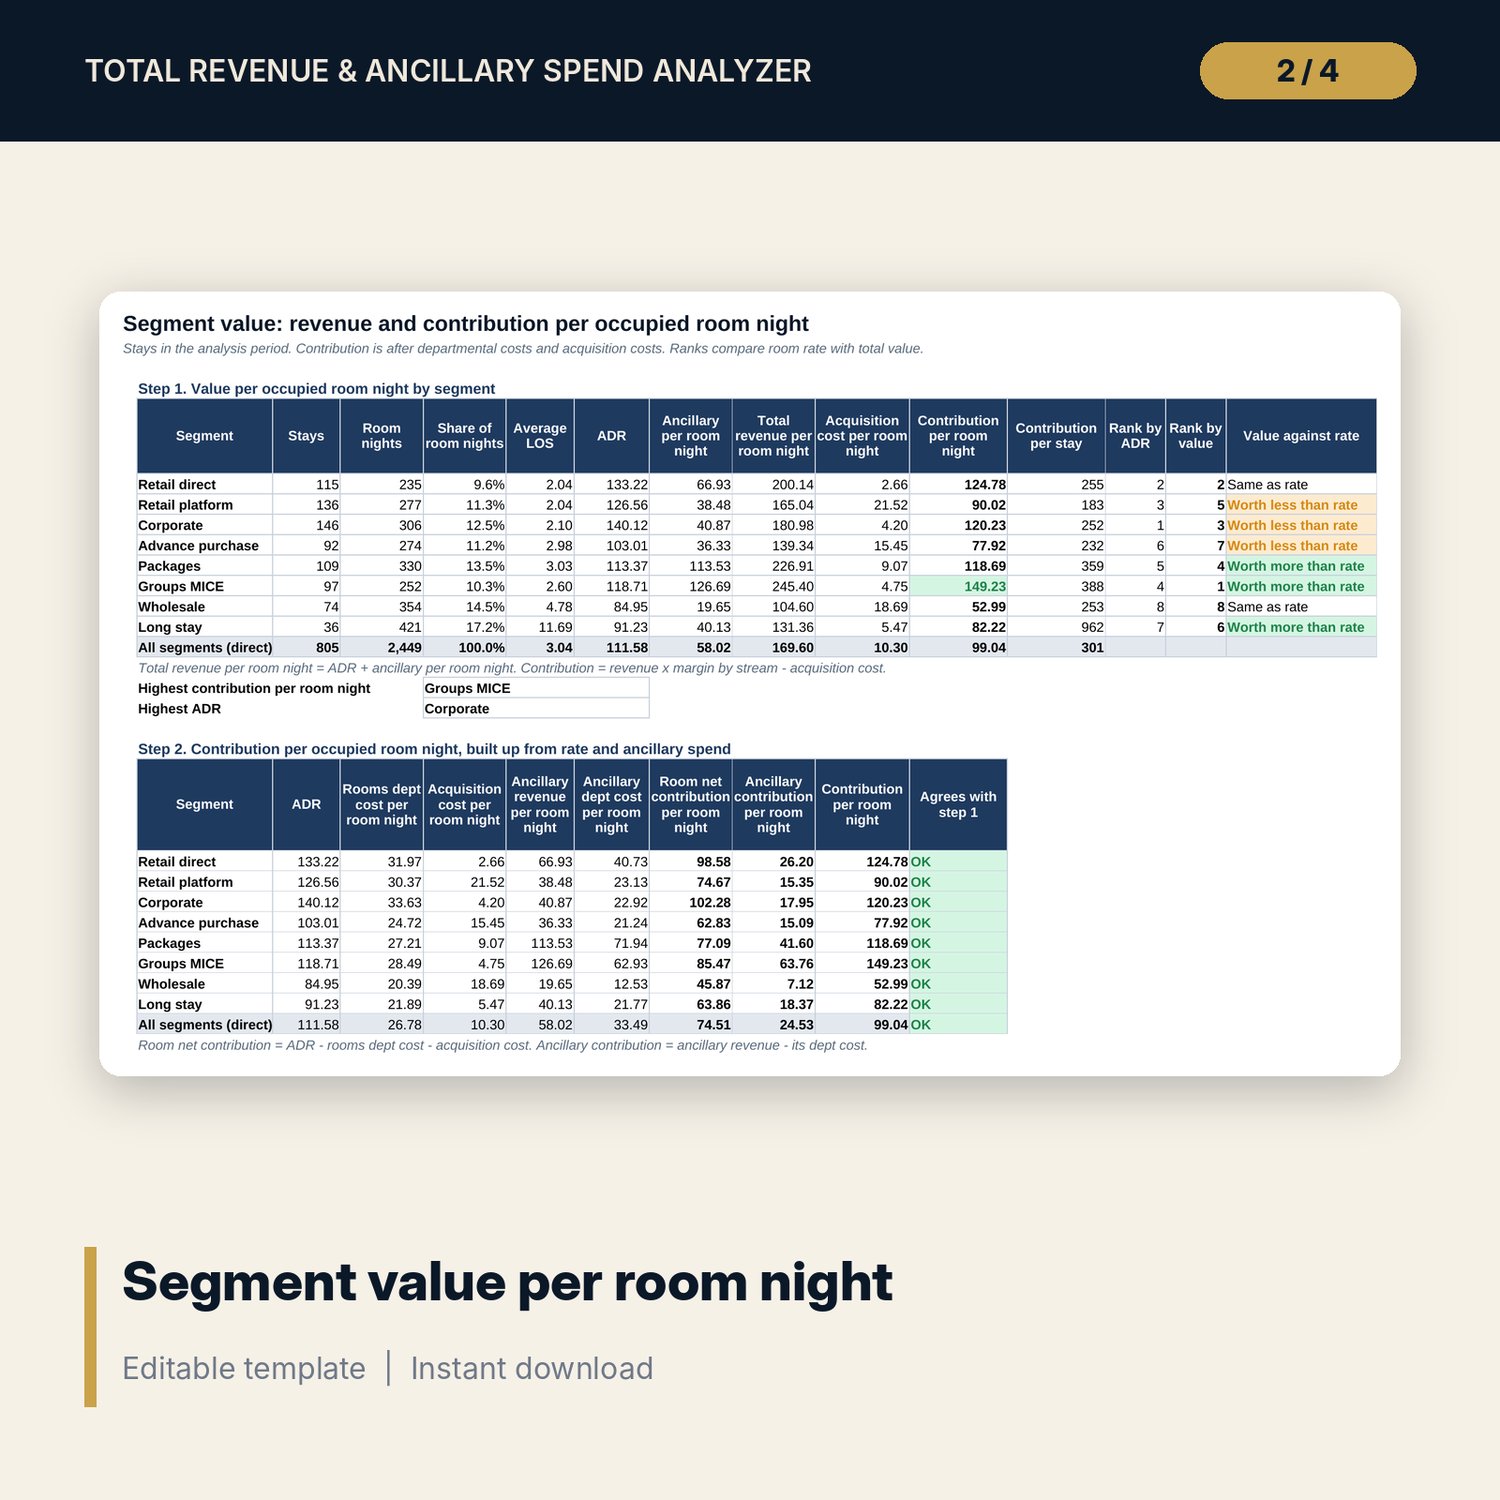
- Segment_Value: ADR, ancillary spend, revenue and contribution per room night, ranks by rate and by value
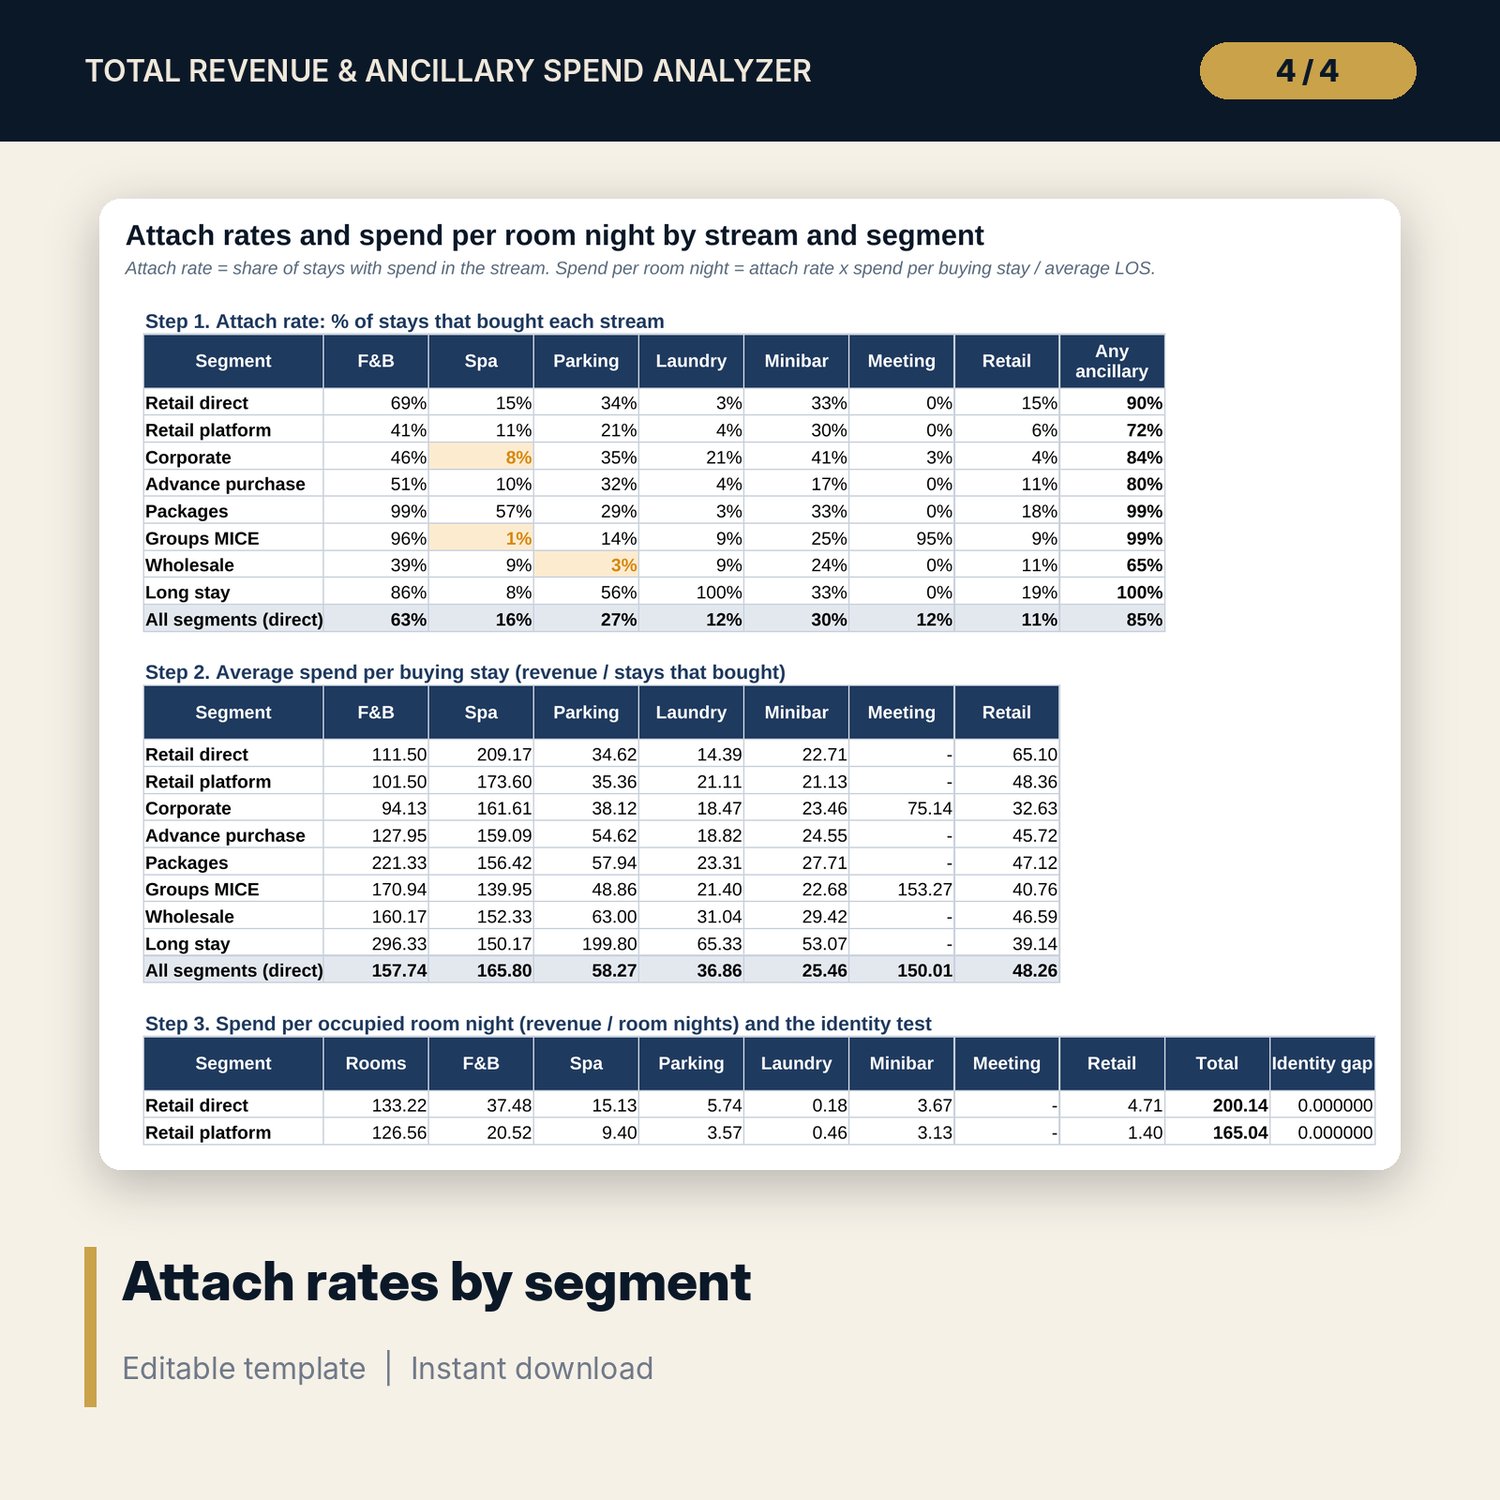
- Attach_Spend: attach rate, spend per buying stay and spend per room night for 7 ancillary streams, with an identity test
- LOS_Value: the same measures for 5 length-of-stay bands, plus a chart
- Stream_Profit: TRevPAR and ProPAR components by stream, in-house against non-resident revenue, monthly TRevPAR stack
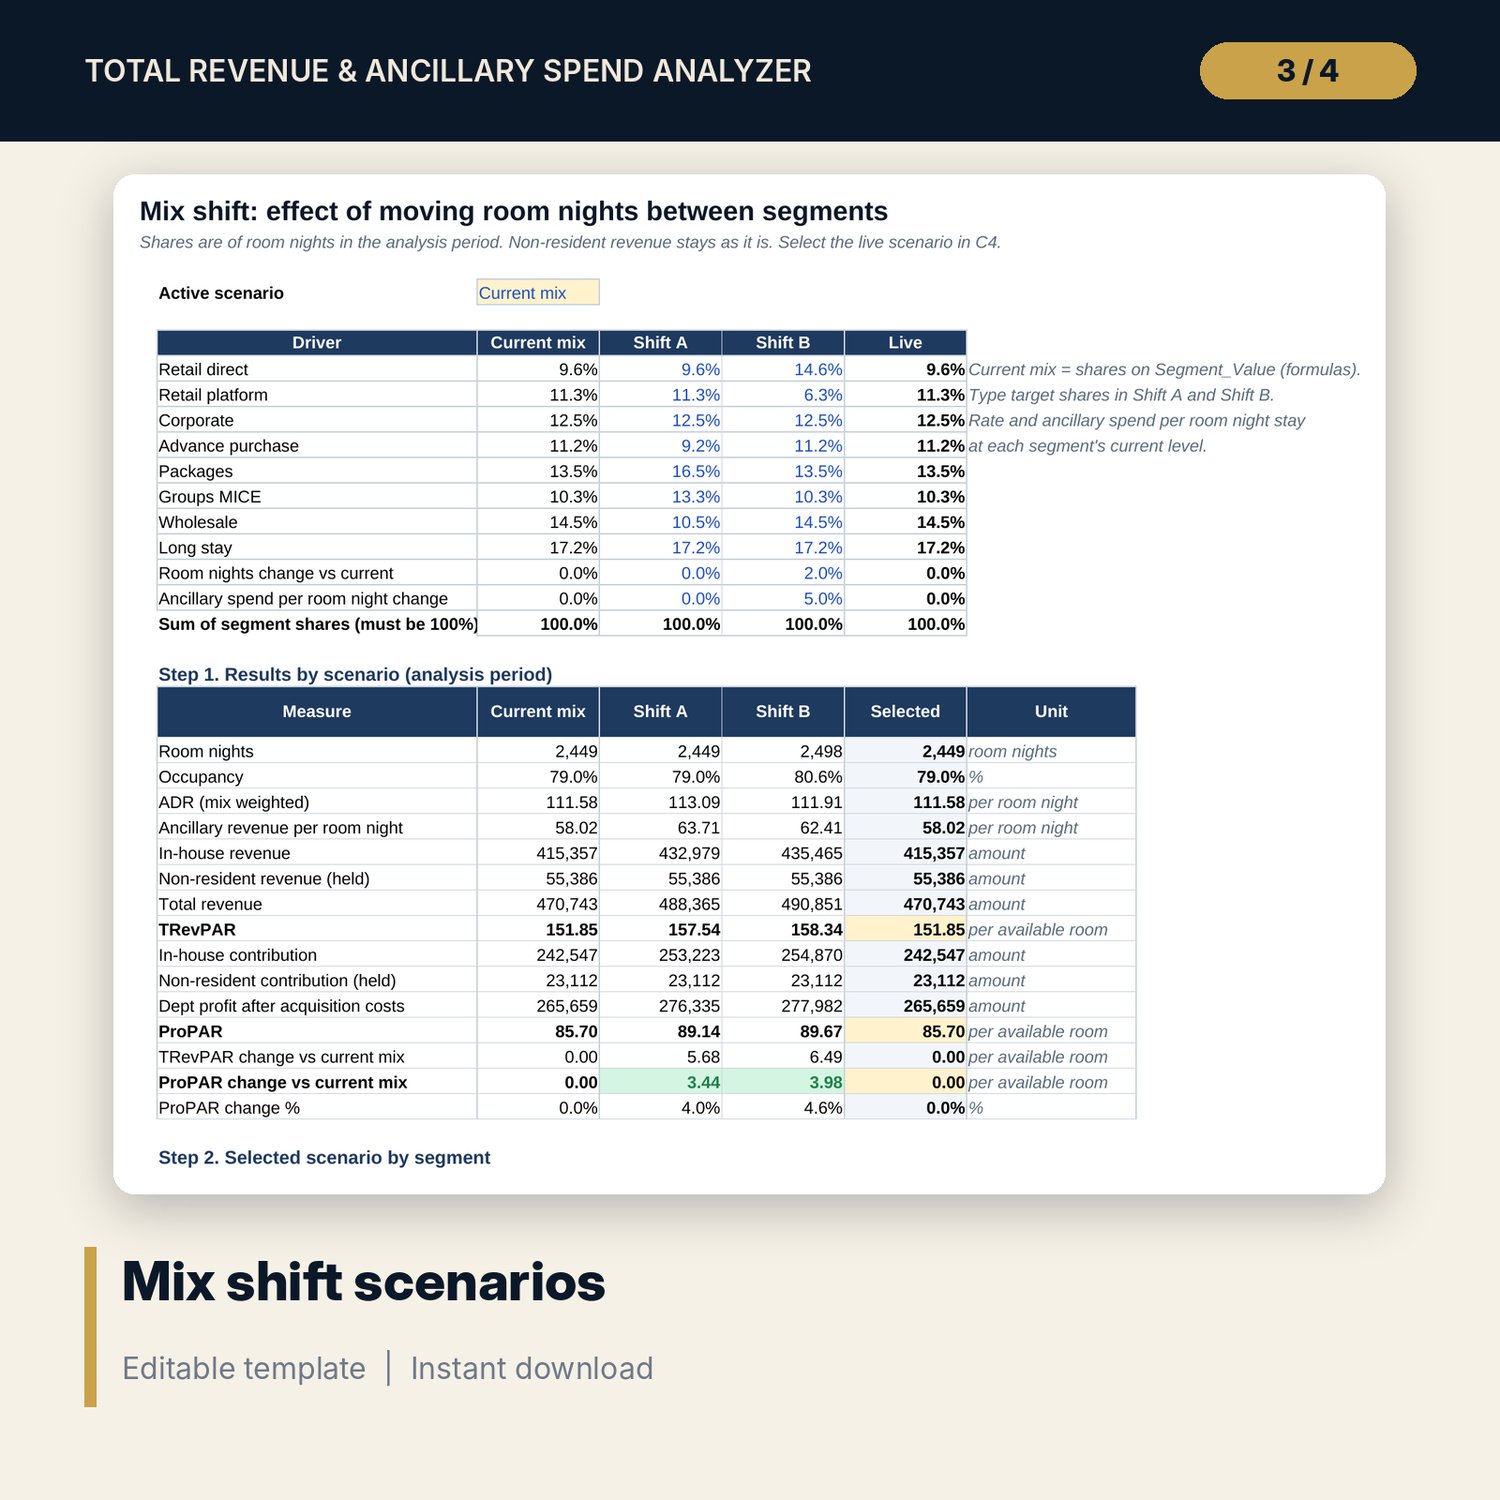
- Mix_Shift: 3 mix scenarios and 2 sensitivity grids (54 closed-form cells)
- Dashboard (one printed page), 15 integrity checks and a Method tab with 17 documented calculations
- README.txt and LICENSE-and-Terms.txt
How it works
- Enter rooms, the analysis period, departmental cost % by stream and acquisition cost % by segment on Assumptions.
- Enter 12 to 24 months of revenue by stream on Monthly_Ledger and paste the folio export for the period into Stays.
- Read Segment_Value and Attach_Spend to see contribution per room night and the upsell gaps by segment.
- Type target mixes on Mix_Shift and read the change in TRevPAR and ProPAR.
- Confirm that Checks shows ALL OK, then print the Dashboard.
Details
- Format: one .xlsx workbook, English
- Software: Excel 2016 or later, or LibreOffice Calc 7 or later
- No macros, no external links, no data tables, no array formulas
- Instant digital download
Good to know
- Sample data is illustrative. Replace it with your own figures.
- Departmental cost % and acquisition cost % are your own inputs. Verify them against your accounts.
- The workbook is a planning tool, not financial or accounting advice. Verify local requirements.
- Single-user license. Do not redistribute.
FAQ
What data do I need?
Monthly revenue by stream from your accounting system and a folio export with arrival date, segment, nights and revenue by stream for one period, usually one month.
How are packages handled?
Split each package into its components on the folio (room, F&B, spa) before you paste it, so each stream carries its own revenue and margin.
What is ProPAR here?
Revenue by stream x (1 - departmental cost %), minus acquisition costs, divided by rooms available. GOPPAR then deducts undistributed costs.
Can I rename segments and streams?
Yes. There are 8 segment slots and 8 stream slots on Assumptions. Every tab reads the names from there.
Does it need macros or add-ins?
No. Every result is a standard worksheet formula, including the scenarios and sensitivity grids.