Bullet Chart Template - Excel Template
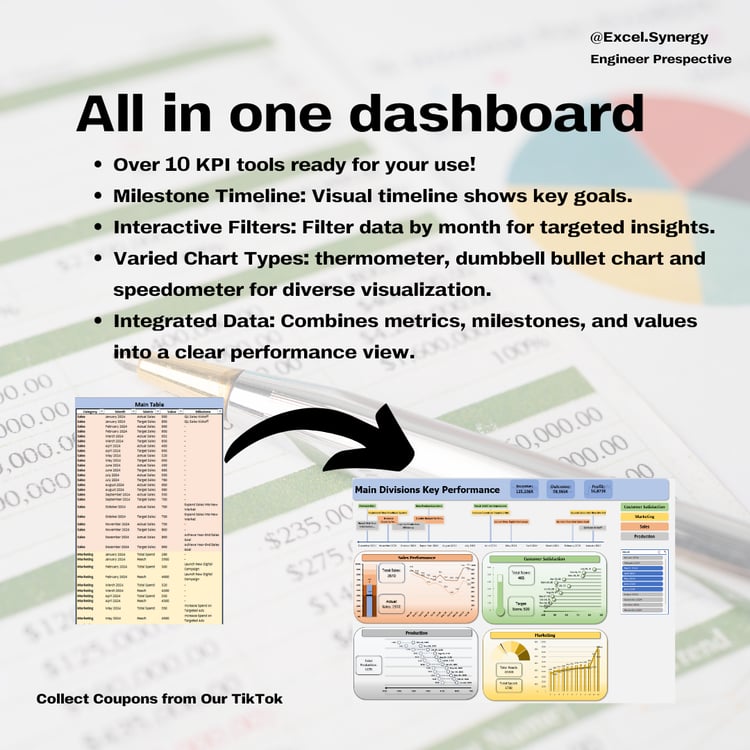
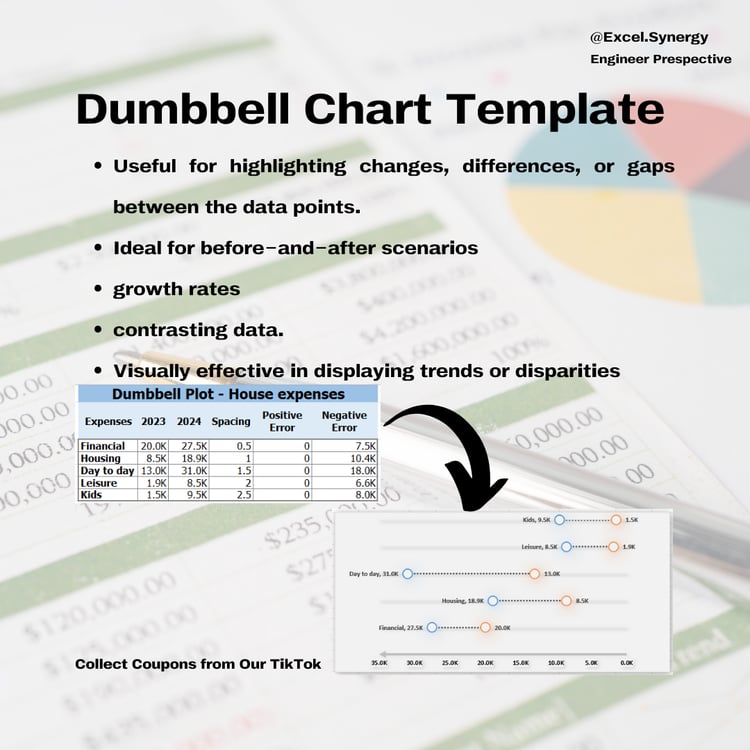
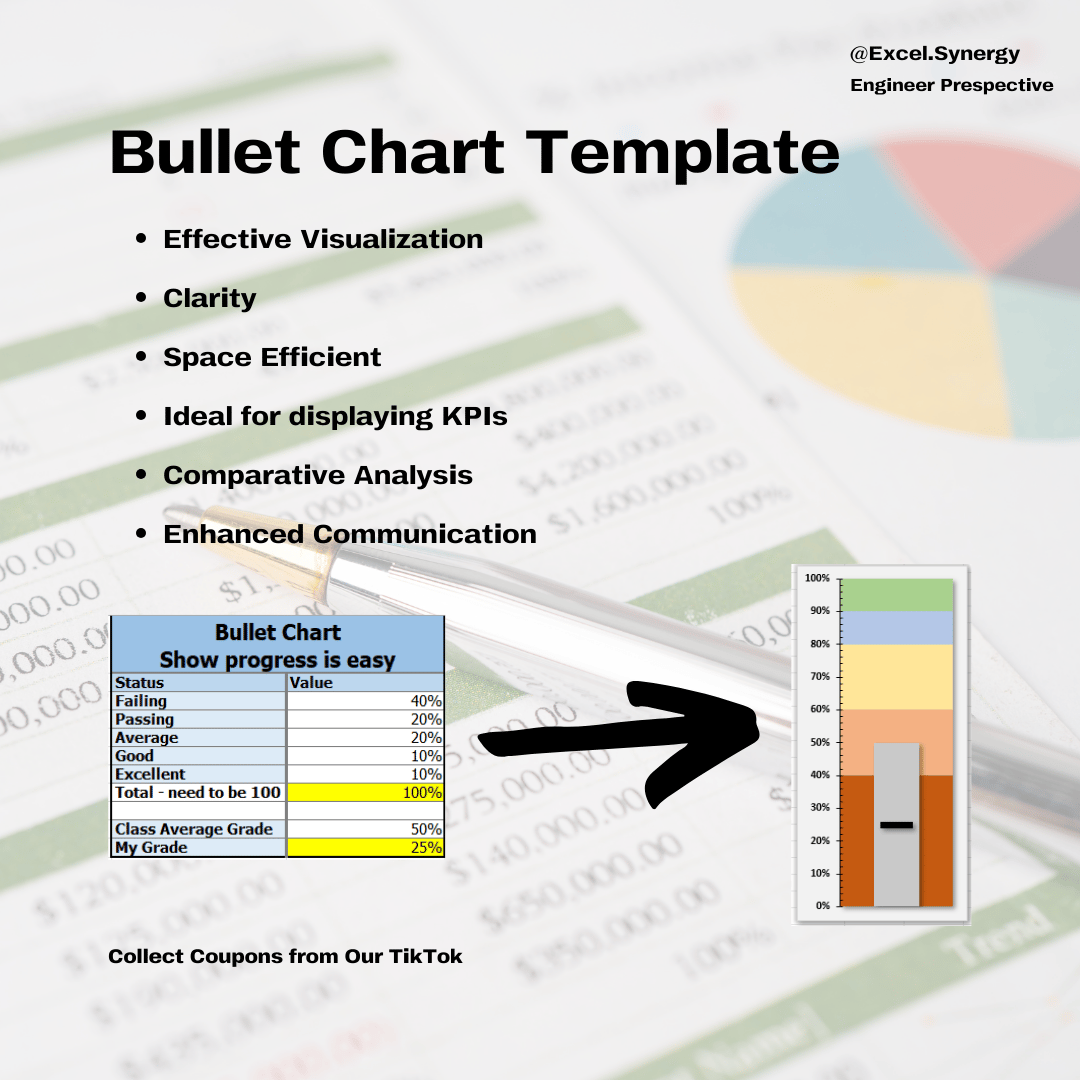
Our bullet chart is a powerful visualization tool that effectively conveys performance metrics against a target.
Designed for clarity, it combines elements of a bar graph and a range indicator, allowing viewers to quickly assess progress toward goals.
Unlike traditional charts, bullet charts use less space while providing more context, making them ideal for dashboards and reports. They can highlight key performance indicators (KPIs) and compare multiple metrics in a single view, enabling informed decision-making.
By incorporating a bullet chart into your data presentation, you enhance the audience's understanding of performance trends and improve overall communication of your objectives.
Important Instructions:
------------------------
Compatibility Notice: To use this template, you’ll need either Office 2016 or later or a Microsoft Excel 365 subscription. Please note that it is not compatible with Google Sheets or any other software.
We're Here to Help: If you have any questions or need assistance, don’t hesitate to reach out! Remember, this template is for personal use only, and you cannot use any part of it to create products for sale or for public/commercial purposes.
Digital Product Policy: Please be aware that due to the nature of digital products, we cannot accept refunds, returns, exchanges, or cancellations.
*This is a digital product, ready for immediate download after your purchase! Enjoy the convenience of no waiting and no shipping fees—buy once, and it’s yours forever!
Please note: No physical product will be shipped.