


histograms for labour based on the contractor type
On Sale
$999.99
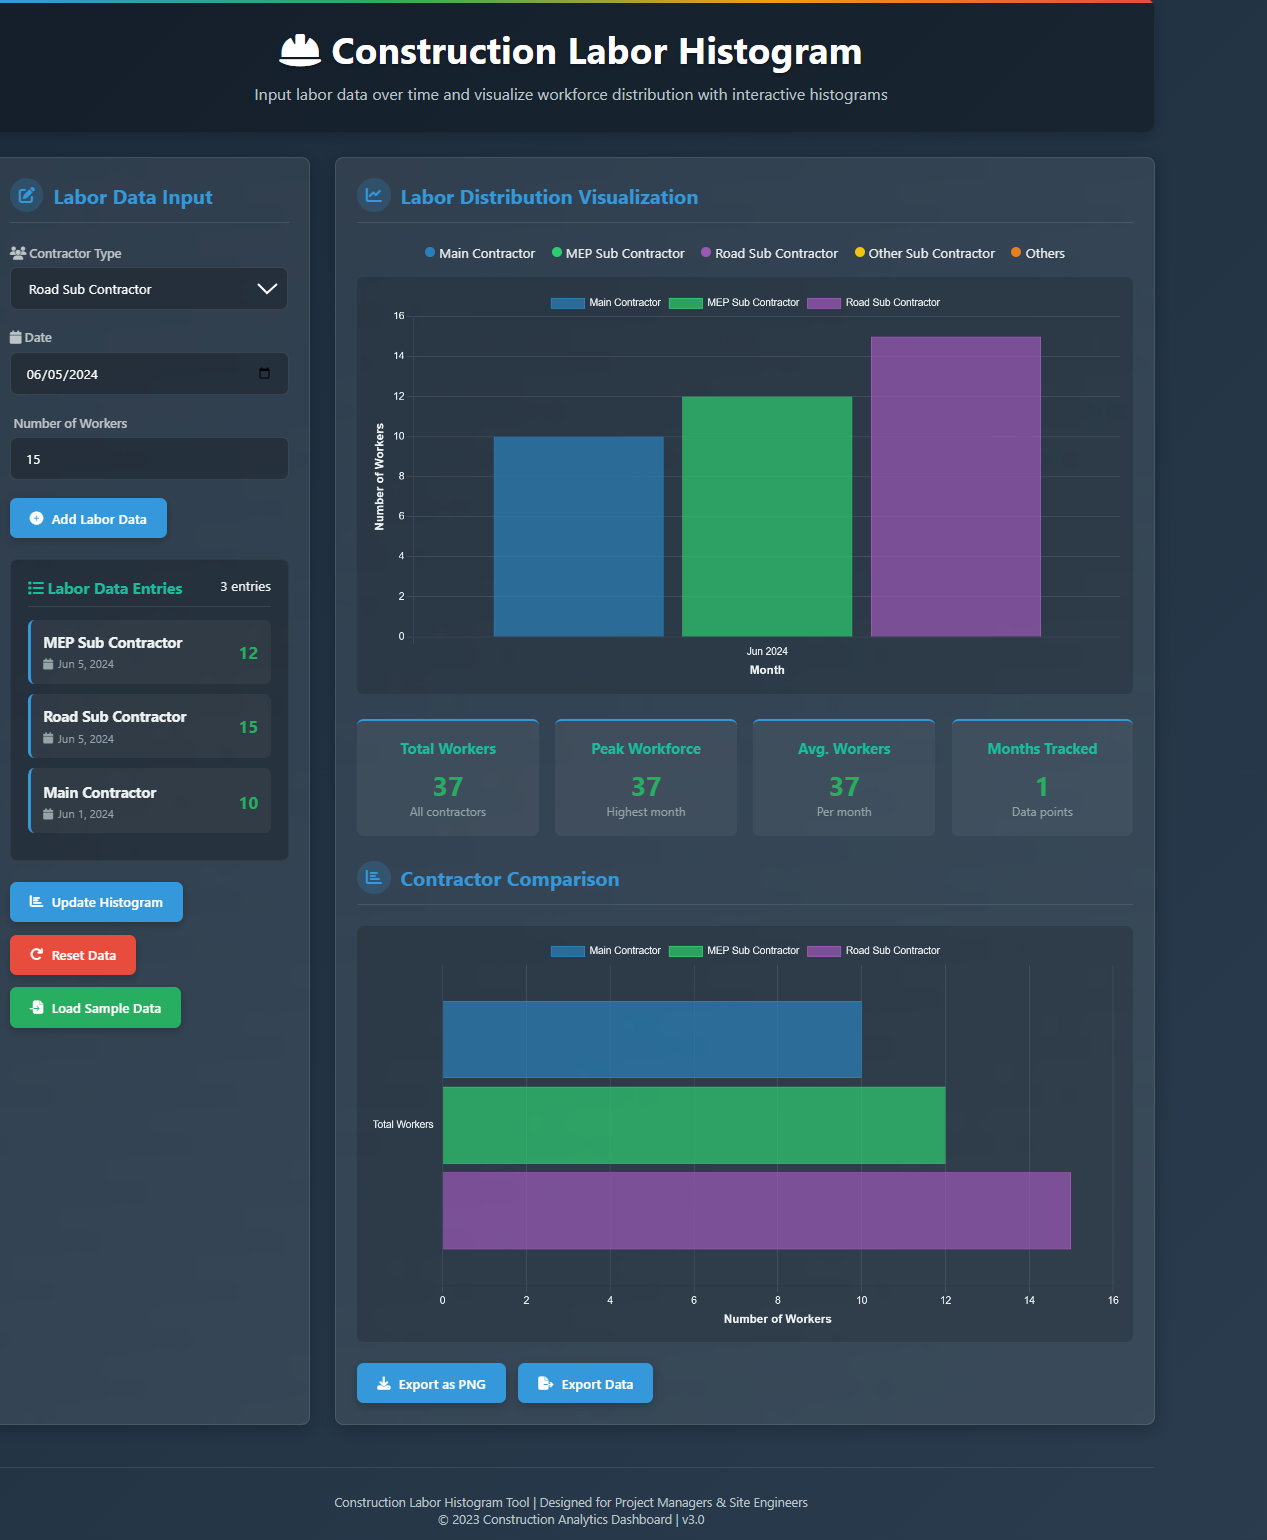
Key Features of the Labor Histogram Application
This interactive application allows you to manage and visualize construction labor data over time:
- Data Input:
- Select contractor type from dropdown (Main, MEP, Road, etc.)
- Choose a date with the date picker
- Enter number of workers
- Add multiple data points over time
- Data Management:
- View all labor entries in a sortable list
- Reset all data with confirmation
- Load sample data with one click
- Export data as CSV for further analysis
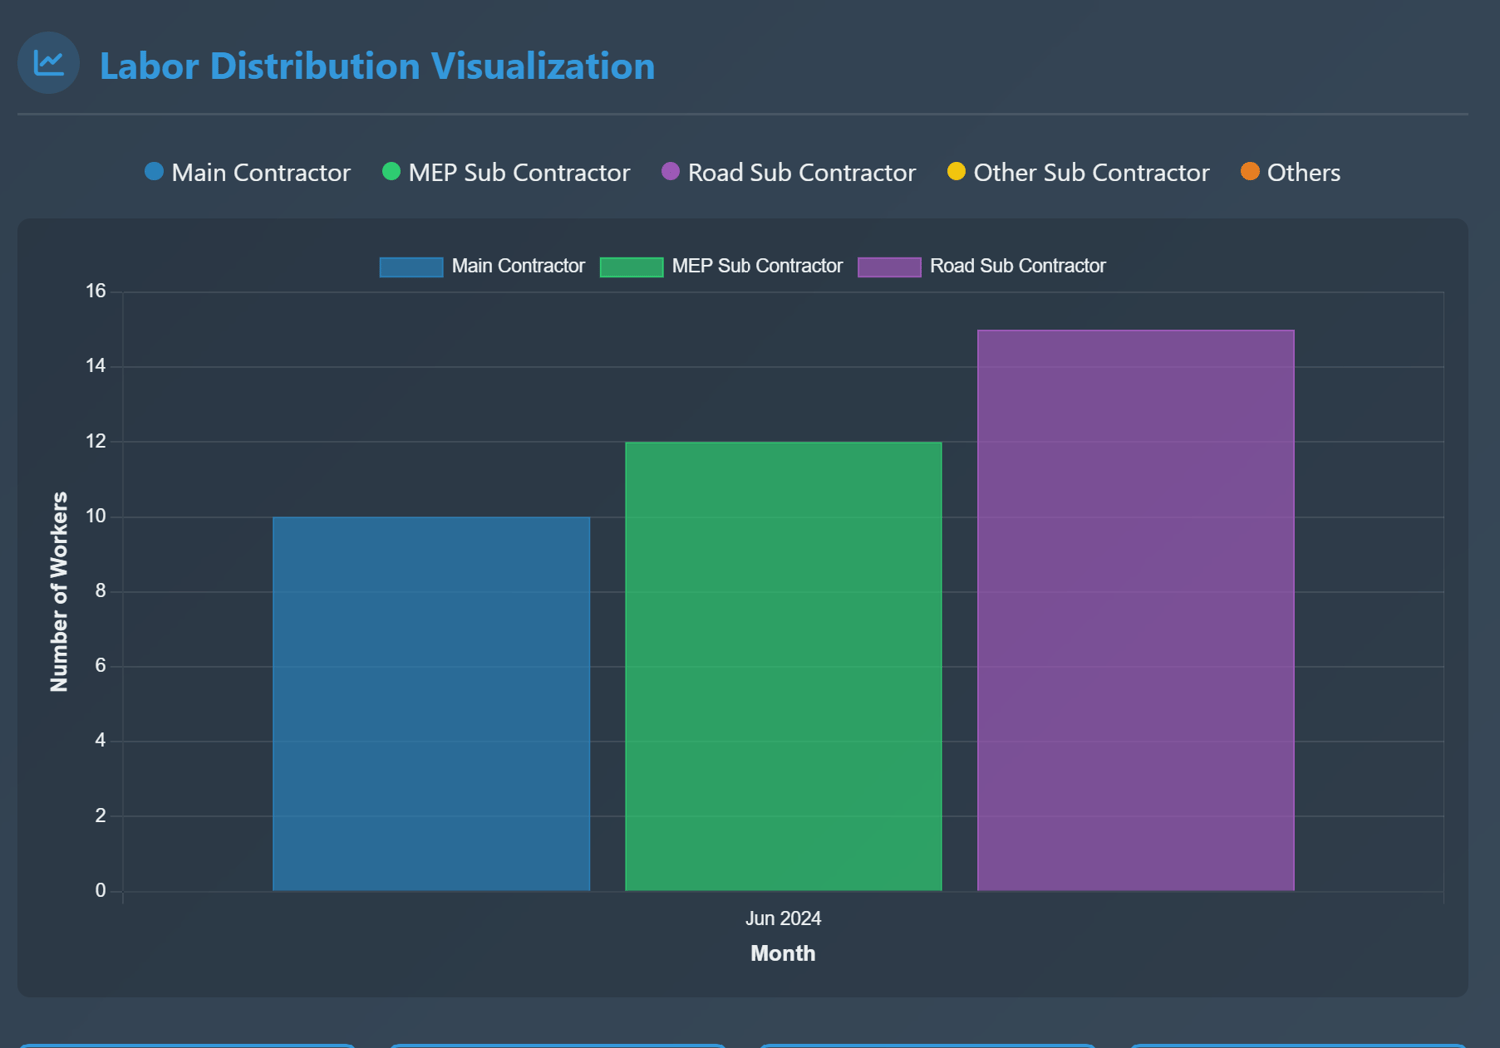
- Visualizations:
- Labor Distribution Chart: Bar chart showing workforce distribution by month
- Contractor Comparison Chart: Horizontal bar chart comparing total workers per contractor
- Color-coded by contractor type for easy identification
- Statistics Dashboard:
- Total workers across all contractors
- Peak workforce in a single month
- Average workers per month
- Number of months tracked
- Export Options:
- Export both charts as PNG images
- Export raw data as CSV file
- Responsive Design:
- Works on desktops, tablets, and mobile devices
- Construction-themed interface with appropriate colors
- Clean, modern layout optimized for data visualization
How to Use the Application
- Add Data:
- Select a contractor type from the dropdown
- Choose a date using the date picker
- Enter the number of workers for that date
- Click "Add Labor Data"
- Visualize:
- Charts automatically update as you add data
- Hover over chart elements to see detailed information
- Use the "Update Histogram" button if needed
- Manage Data:
- Use "Load Sample Data" to see an example
- "Reset Data" clears all entries
- Export charts or data using the buttons
This application provides a flexible way to track and visualize labor resources over time, similar to your Excel example but with more interactivity and better visualization capabilities.