
Competitive Set Performance Index Analyzer: Hotel Comp Set Index Tracker for MPI, ARI and RGI
Full description
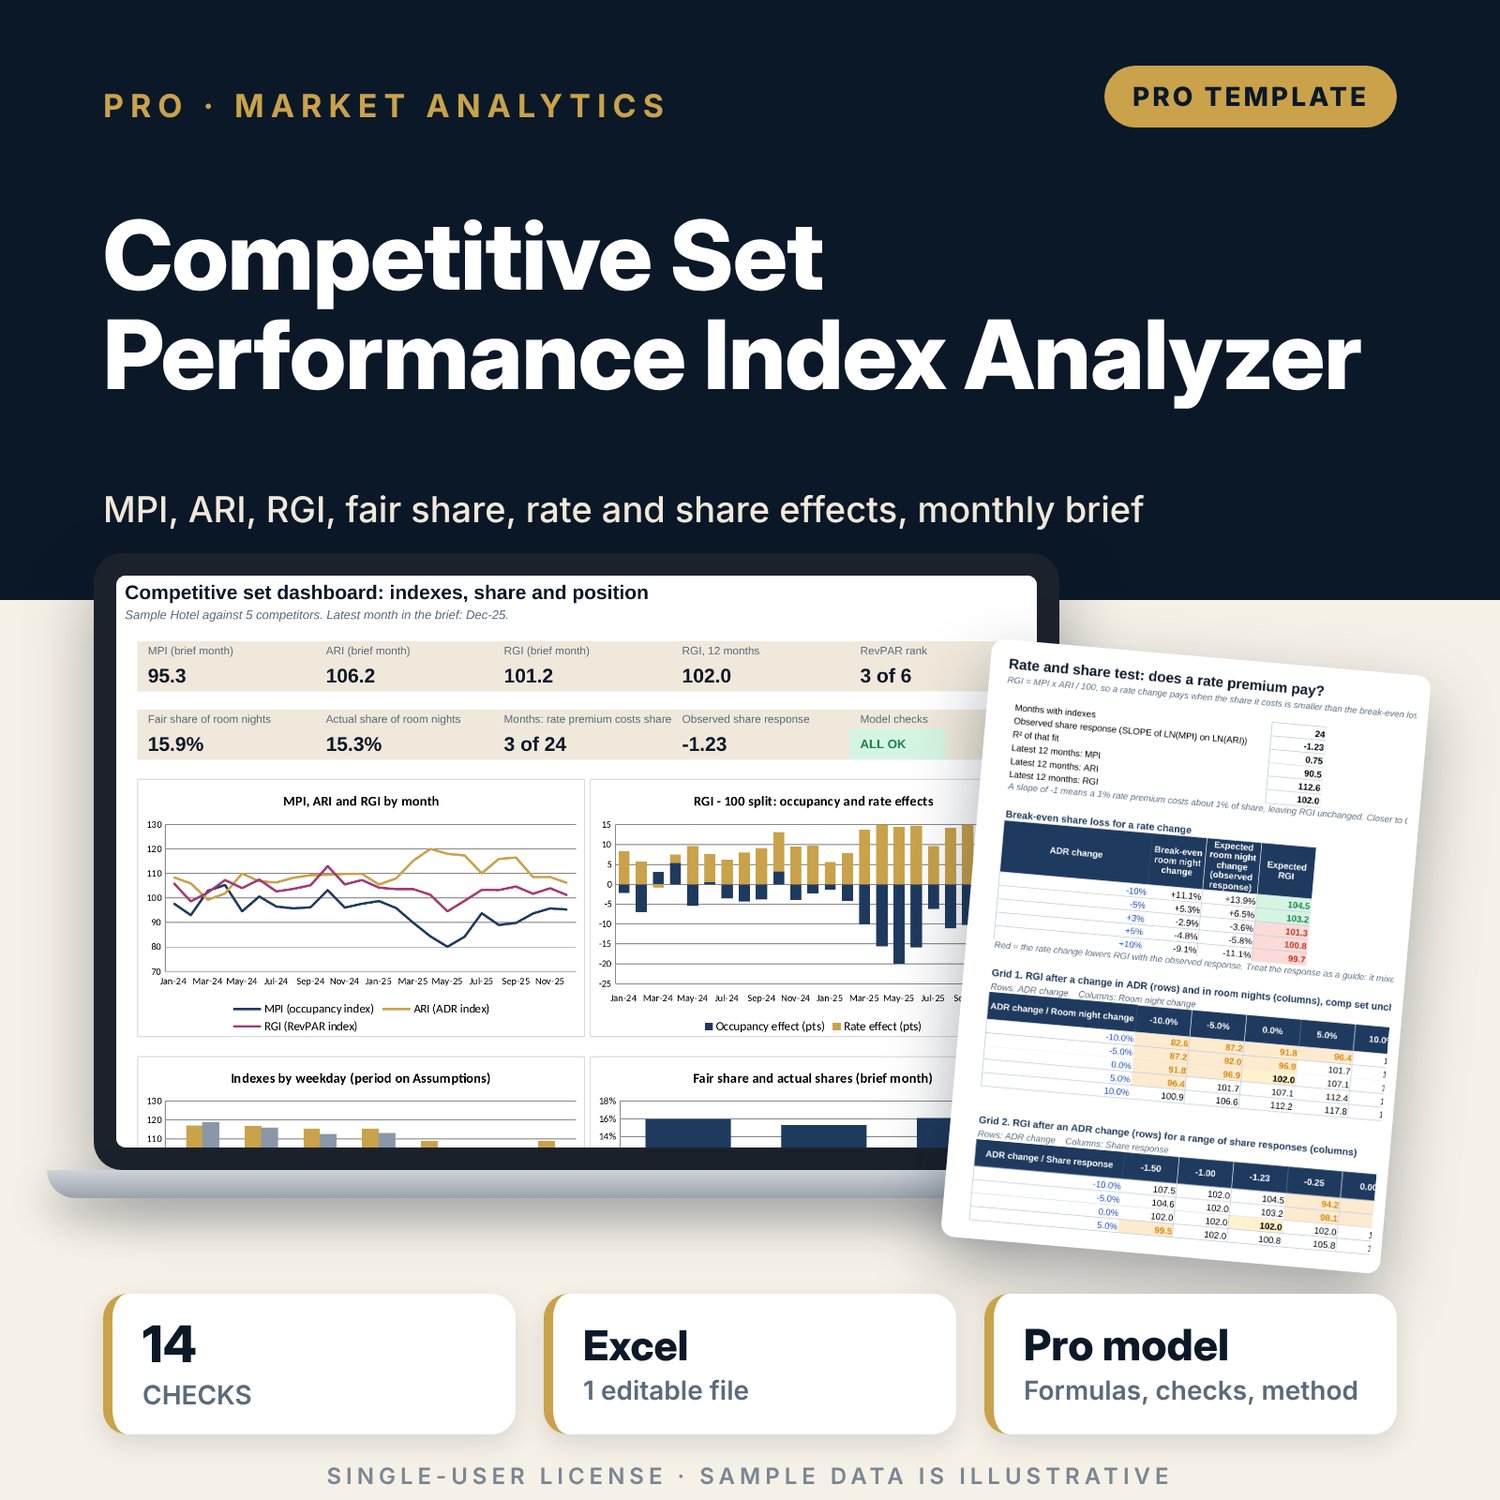
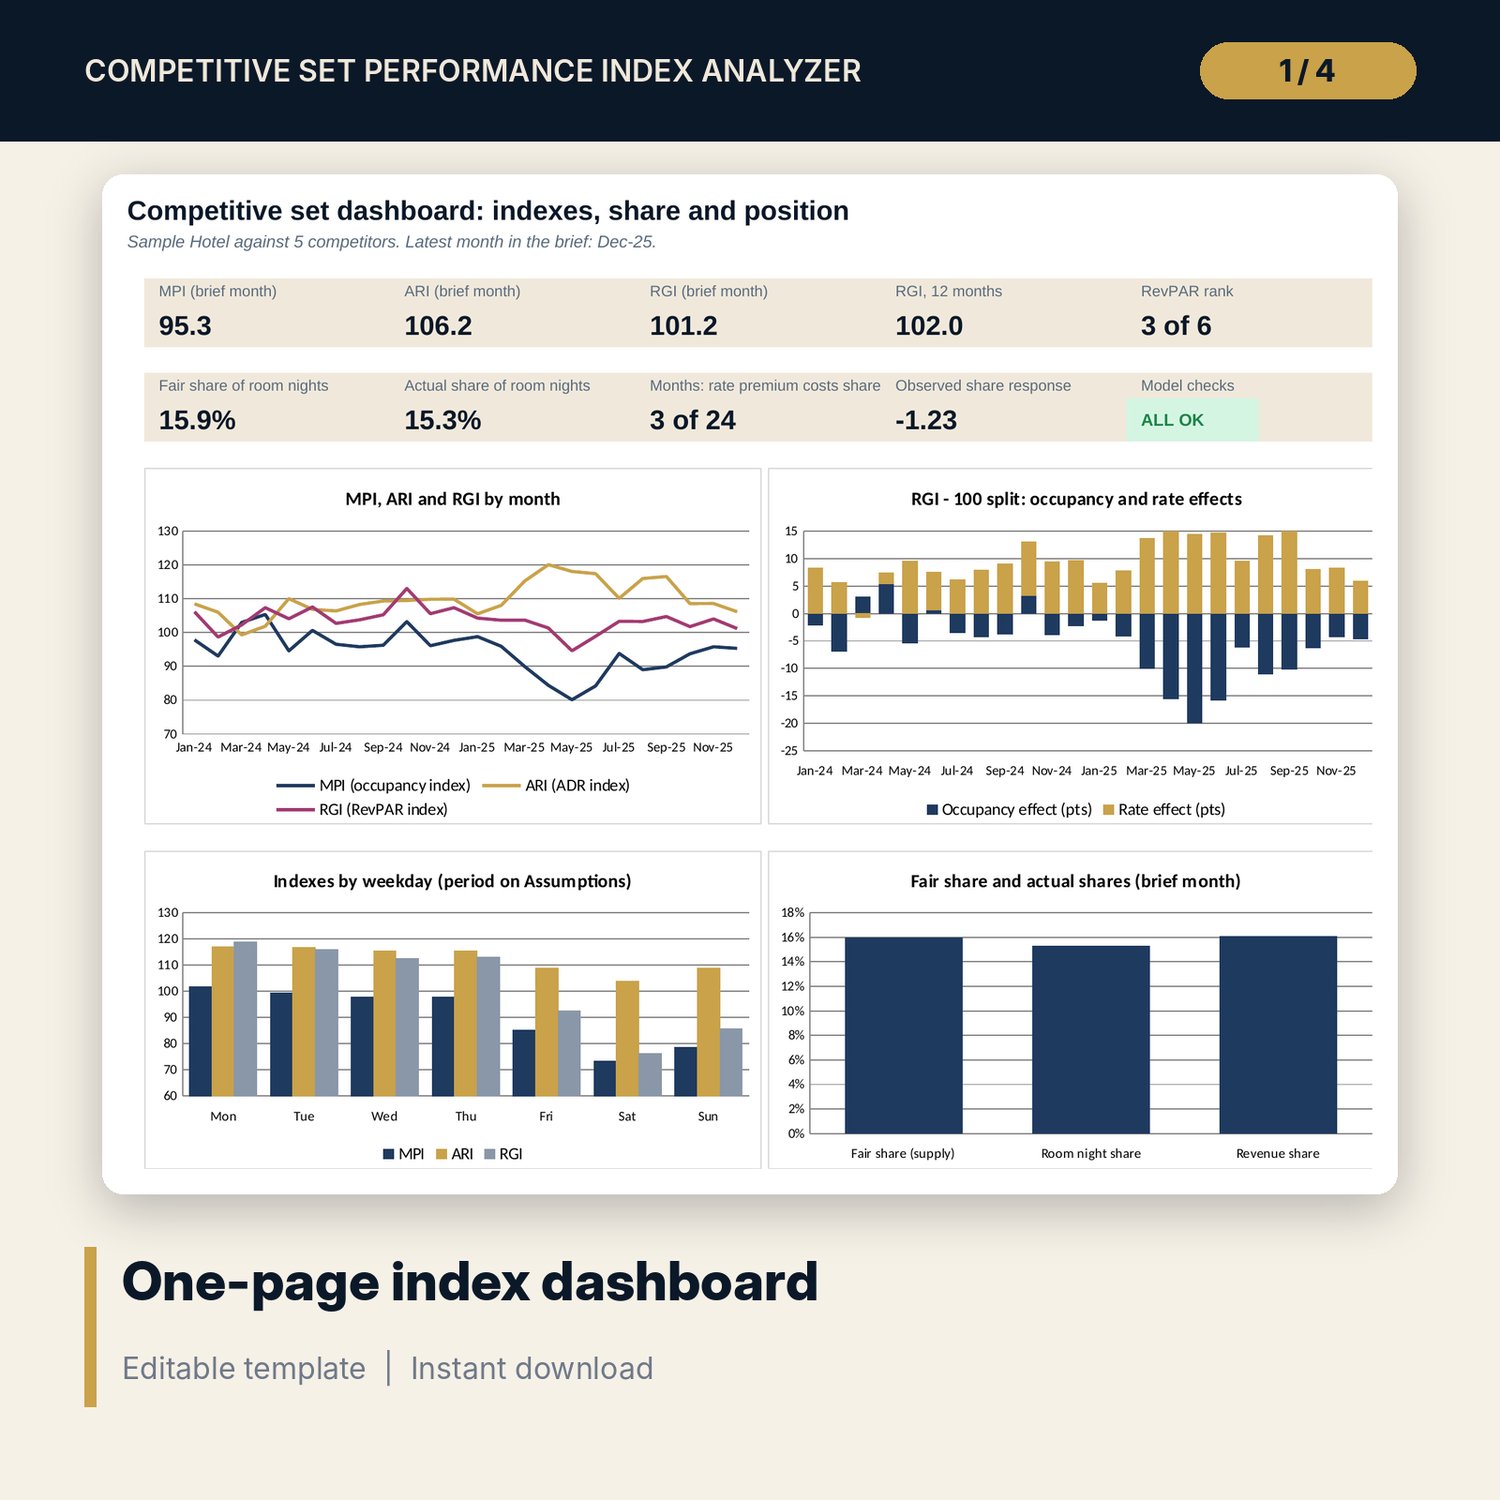
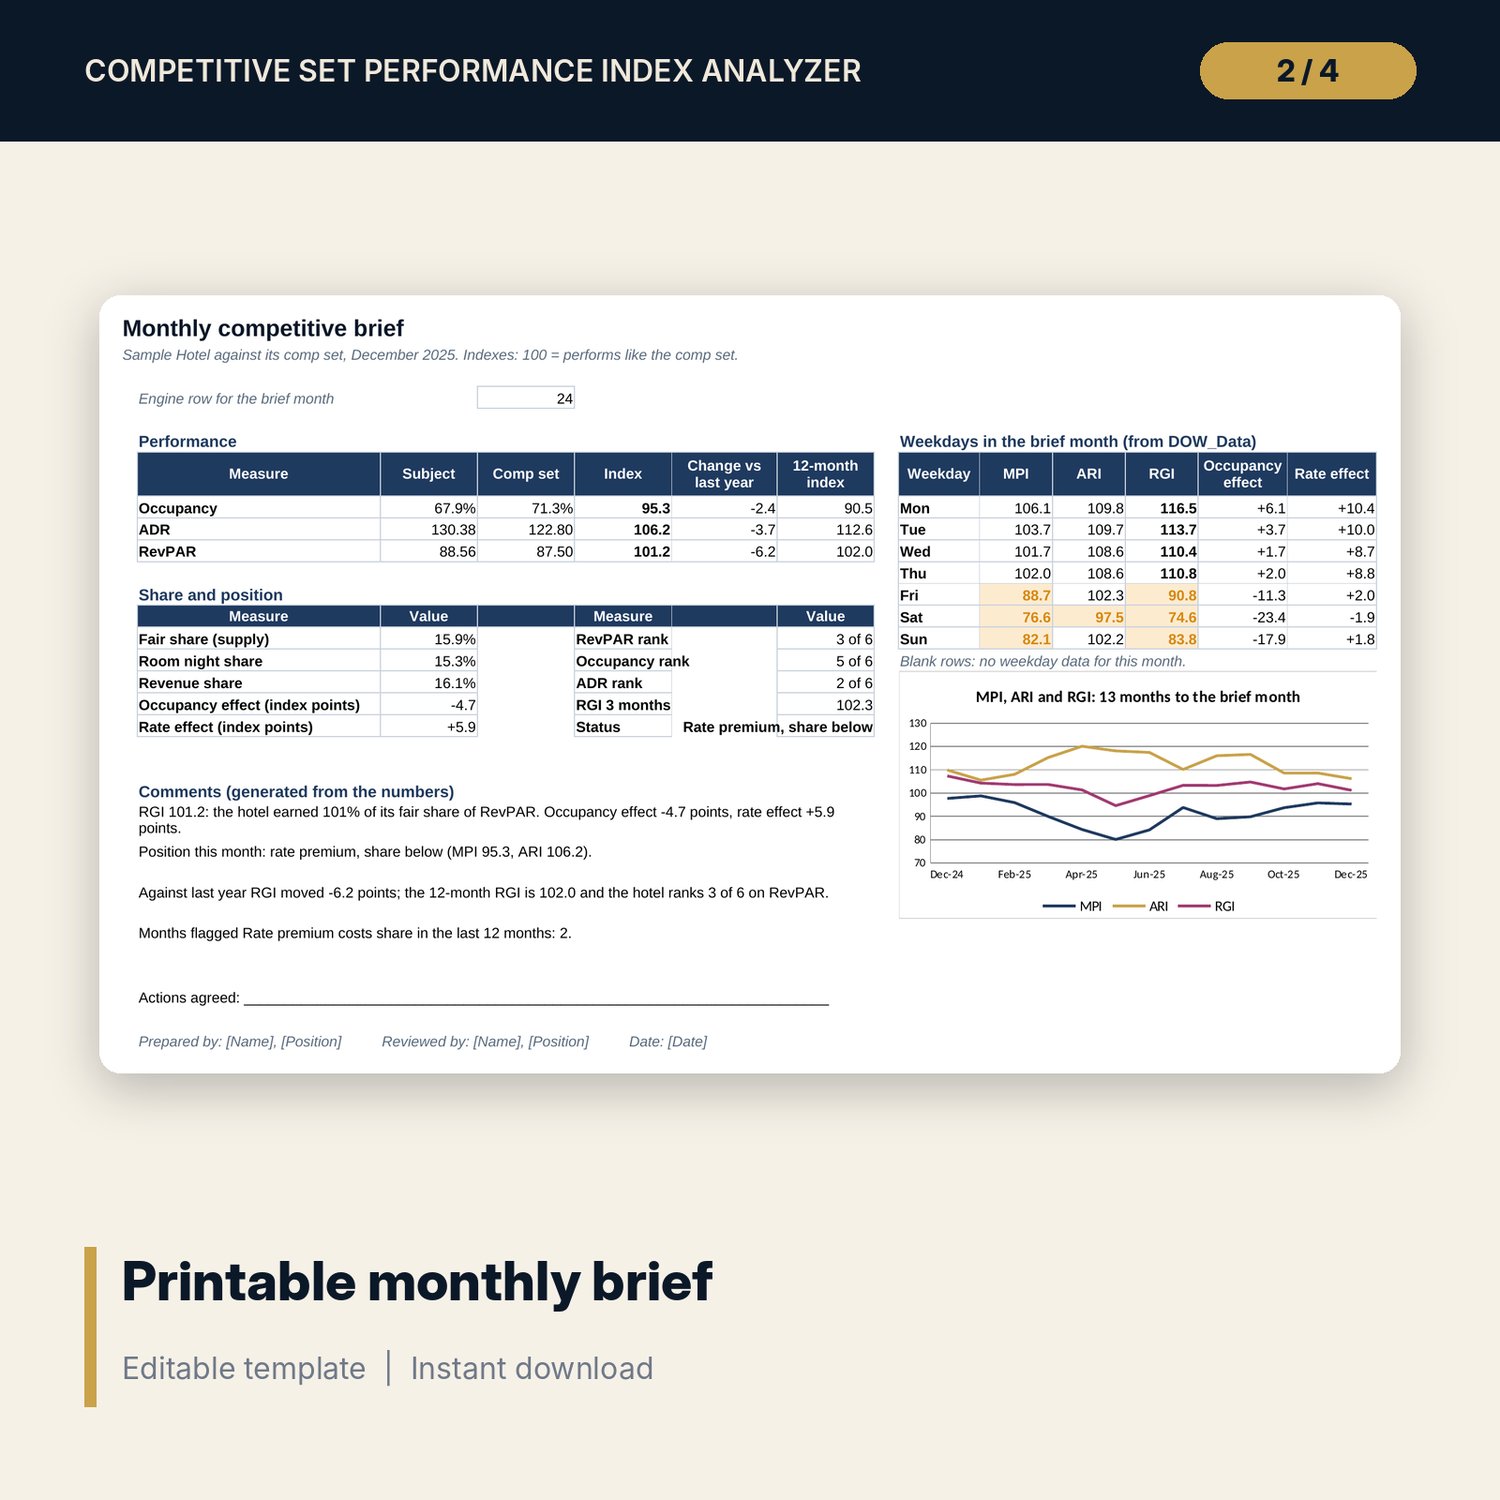
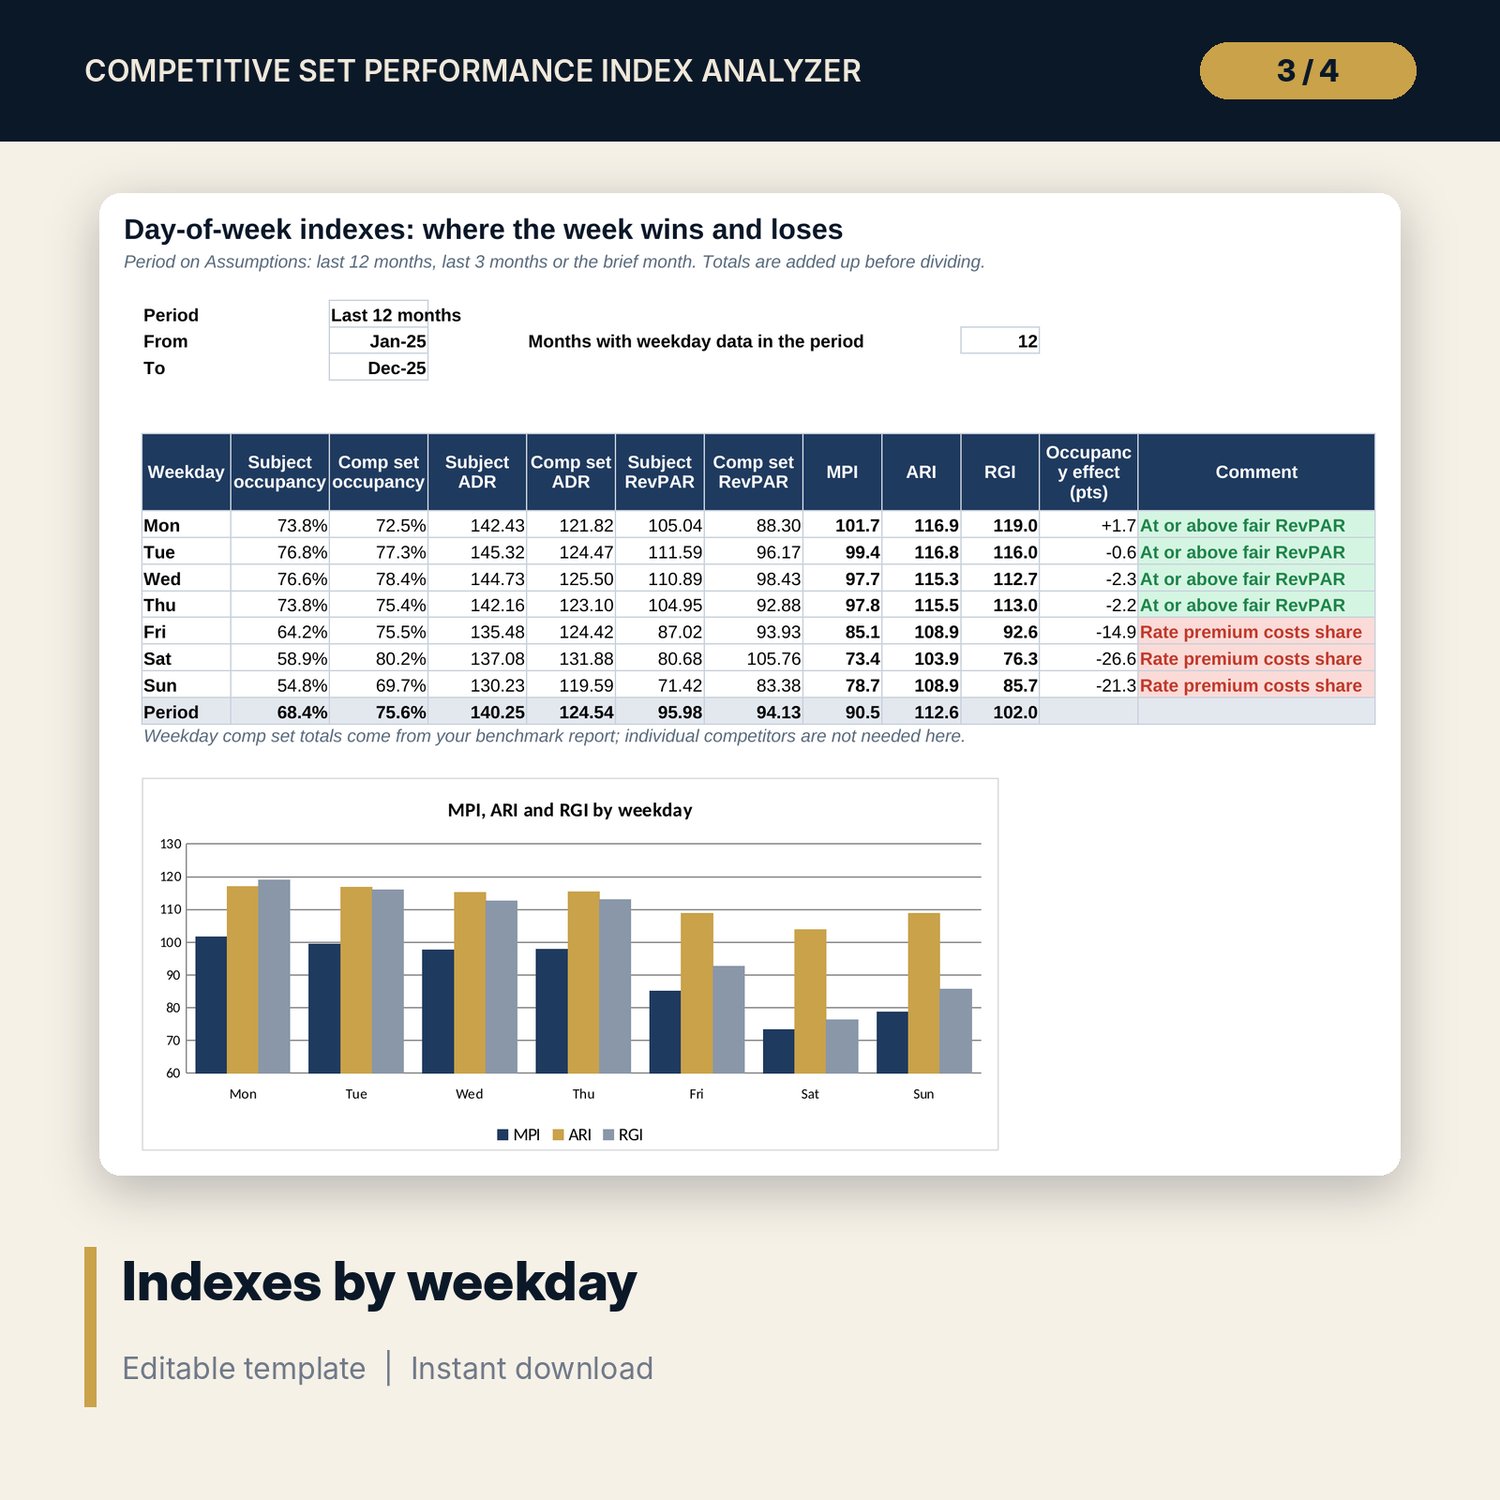
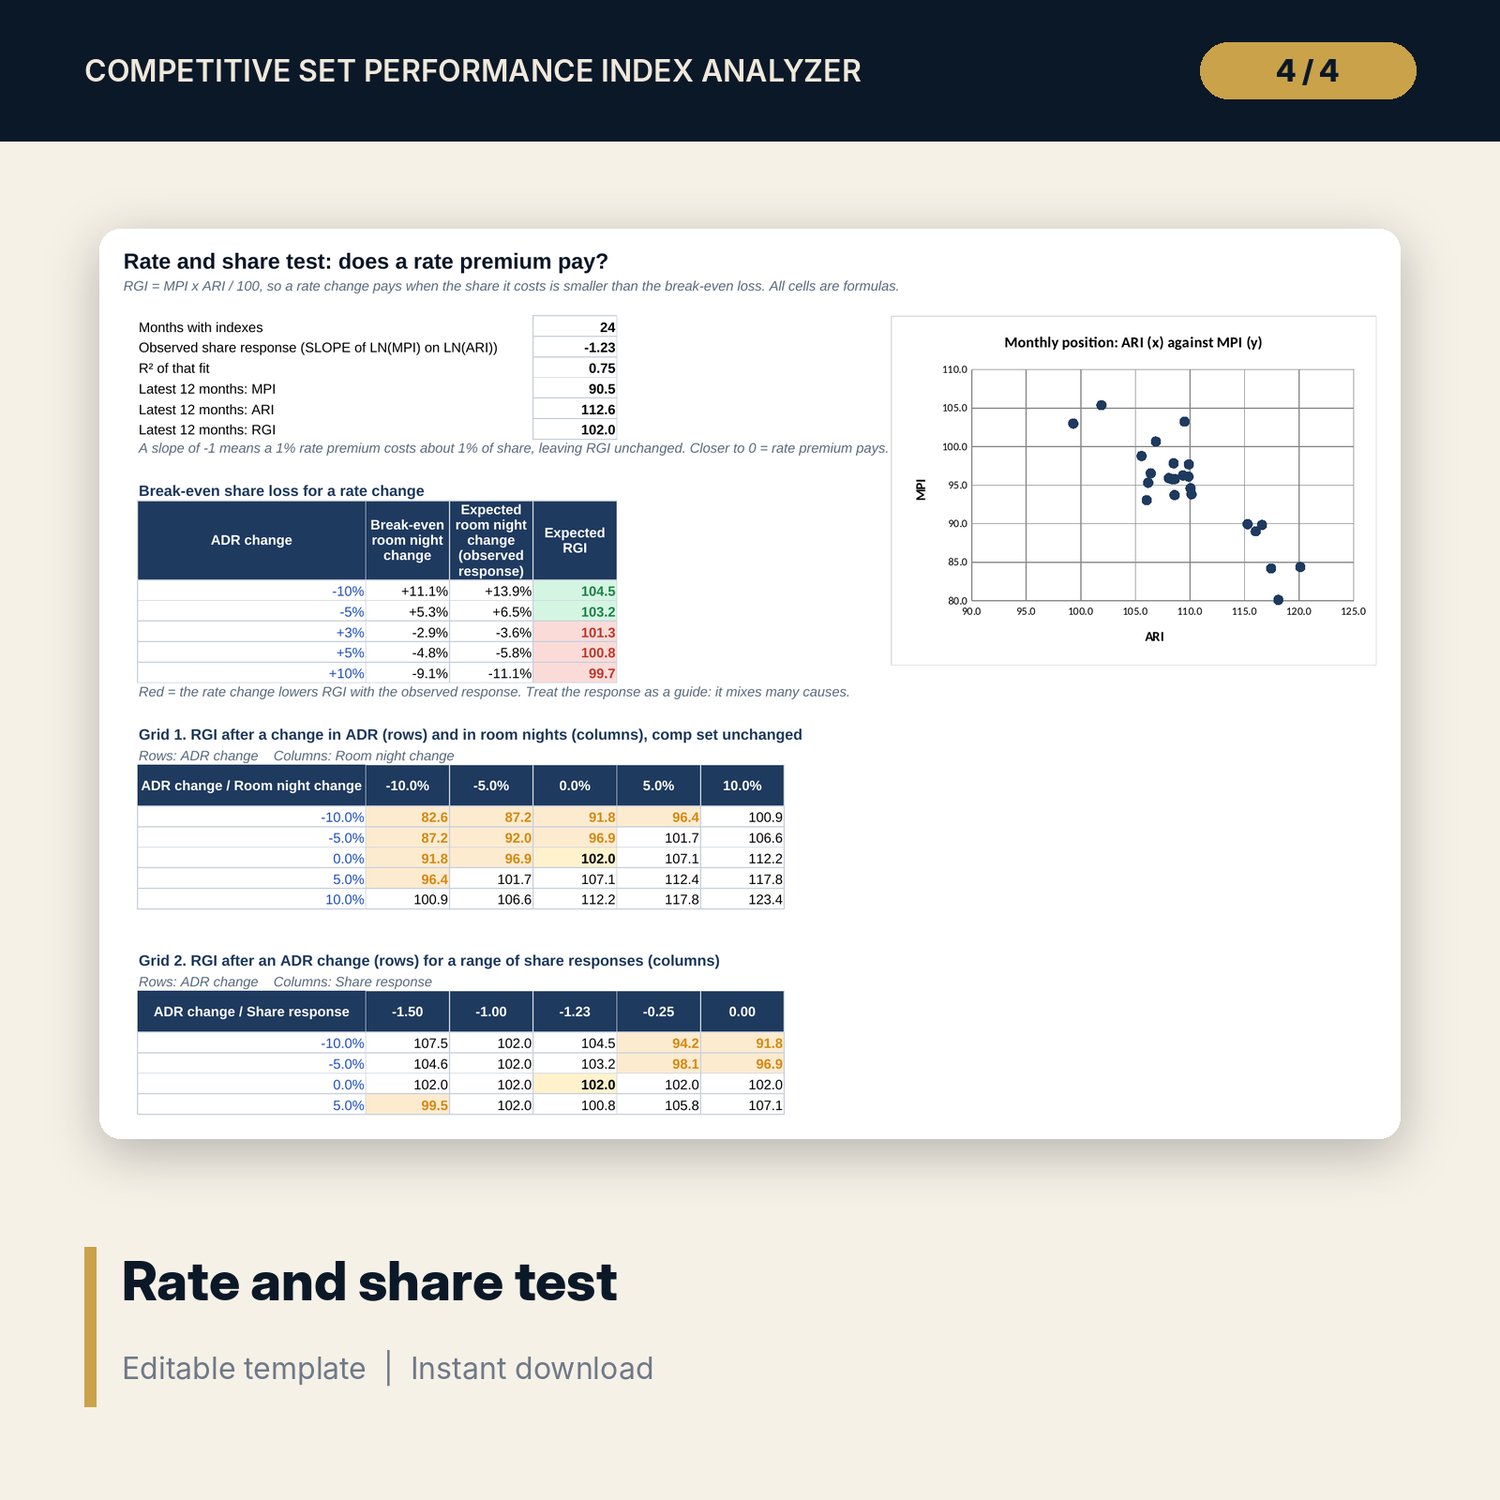
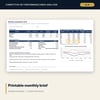
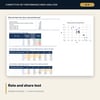
For revenue managers, general managers, directors of sales and asset managers who review the hotel against its competitive set each month. You paste rooms available, rooms sold and room revenue for the subject hotel and up to 7 competitors, plus weekday totals if your benchmark report provides them. The workbook builds the comp set totals, then the occupancy index (MPI), ADR index (ARI) and RevPAR index (RGI), fair share and actual shares of room nights and revenue, and splits RGI - 100 exactly into an occupancy effect and a rate effect. Rolling 3- and 12-month indexes are built from summed components, year-on-year changes and the hotel's rank among the properties follow, and every month gets a status. Months where the rate premium costs more share than it earns are flagged. A rate and share test estimates the observed response of share to rate with SLOPE on log indexes and shows break-even share losses and two closed-form what-if grids. A one-page brief prints any month with generated comments.
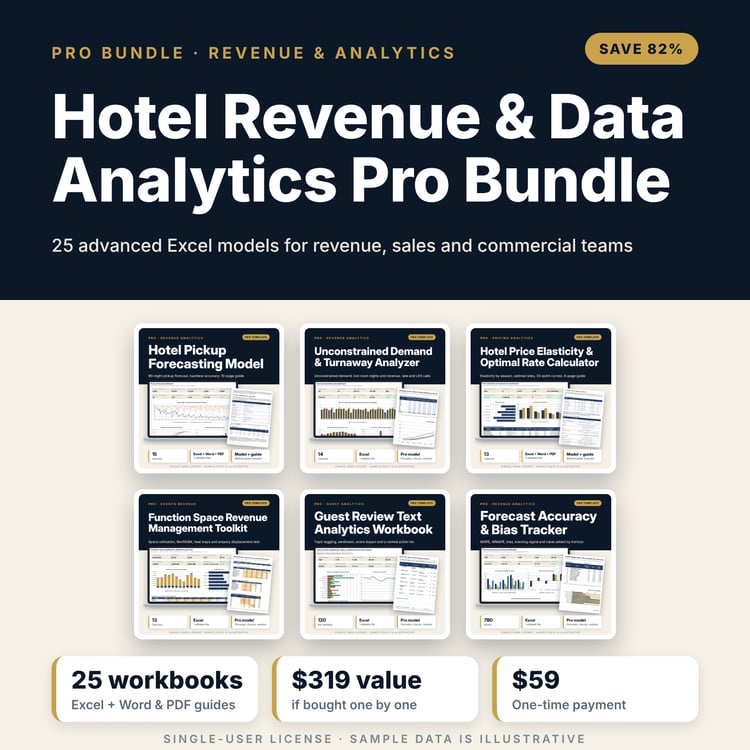
Save with a bundle: this workbook is also in the Hotel Revenue & Data Analytics Pro Bundle, 25 workbooks for $59 instead of $319. All 100 Pro workbooks are in the Pro Library for $119, and all 241 templates and workbooks are in the Ultimate Hospitality Library for $149.
What is inside
- Competitive_Set_Index_Analyzer.xlsx: 12 tabs, 3,209 formulas, 8 native charts, 14 integrity checks, 7 drop-down and input rules
- Sample data (illustrative): 6 properties x 24 months (144 rows, room for 288), 84 weekday rows for the last 12 months
- Index_Engine: comp set totals, occupancy, ADR, RevPAR, MPI, ARI, RGI, fair share, room night and revenue share, occupancy and rate effects, RevPAR gap and status for 36 month rows
- Trends: rolling 3- and 12-month MPI, ARI and RGI, year-on-year changes, RevPAR, occupancy and ADR rank, with a chart
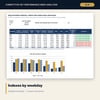
- DOW_Analysis: indexes by weekday for the last 12 months, the last 3 months or one month
- Rate_Share_Test: observed share response, break-even table and two 5 x 5 what-if grids, with a scatter of monthly position
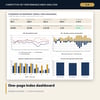
- Monthly_Brief (one printed page) and Dashboard (one printed page) with index, effect, weekday and share charts
- Method tab with 17 documented calculations
- README.txt and LICENSE-and-Terms.txt
How it works
- Enter the subject hotel name, competitor labels, the first month and the flag tolerances on Assumptions.
- Paste monthly rooms available, rooms sold and room revenue per property, and weekday totals if you have them.
- Read the indexes, shares, effects and status on Index_Engine, and the trends and ranks on Trends.
- Check weekdays on DOW_Analysis and test a rate move on Rate_Share_Test.
- Pick the month, print Monthly_Brief and confirm the Checks tab shows ALL OK.
Details
- Format: one .xlsx workbook, English
- Software: Excel 2016 or later, or LibreOffice Calc 7 or later
- No macros, no external links, no data tables, no array formulas
- Instant digital download
Good to know
- Sample data is illustrative. Replace it with your own figures.
- Use competitor data only from sources you are entitled to use, and follow the confidentiality rules of your benchmark provider.
- The observed share response mixes many causes (events, mix, distribution). Treat it as a guide, not a forecast.
- Single-user license. Do not redistribute.
FAQ
What do MPI, ARI and RGI mean?
Each compares the hotel with its comp set, with 100 as parity: MPI for occupancy, ARI for ADR, RGI for RevPAR. RGI equals MPI x ARI / 100.
Do I need individual competitor figures?
Monthly indexes, shares and weekday indexes need only the comp set totals. The rank needs a row per property; with totals only, enter the comp set as one property and ignore the rank.
How is the occupancy and rate split calculated?
RGI - 100 = (MPI - 100) + (ARI - 100) x MPI / 100. The two parts always add up exactly, so the brief can say how many points came from share and how many from rate.
What does the rate premium flag mean?
The month had an ADR index at least 3 points above 100, an occupancy index at least 3 points below 100 and an RGI below 100: the premium cost more share than it earned. Both tolerances are inputs.
Can I use weeks instead of months?
The model is monthly. Weekday patterns come from DOW_Data, which you can fill from any benchmark report that splits by weekday.