Predicted Relative Volume
DESCRIPTION and WHAT IT DOES
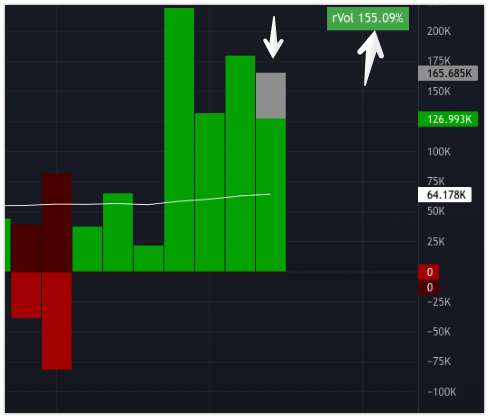
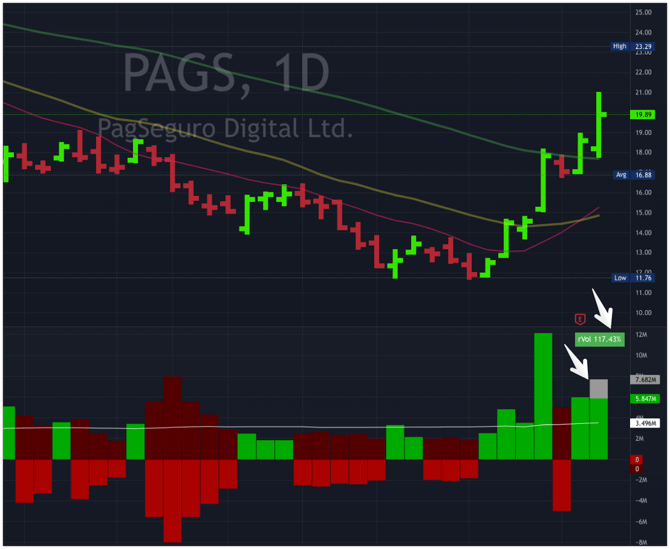
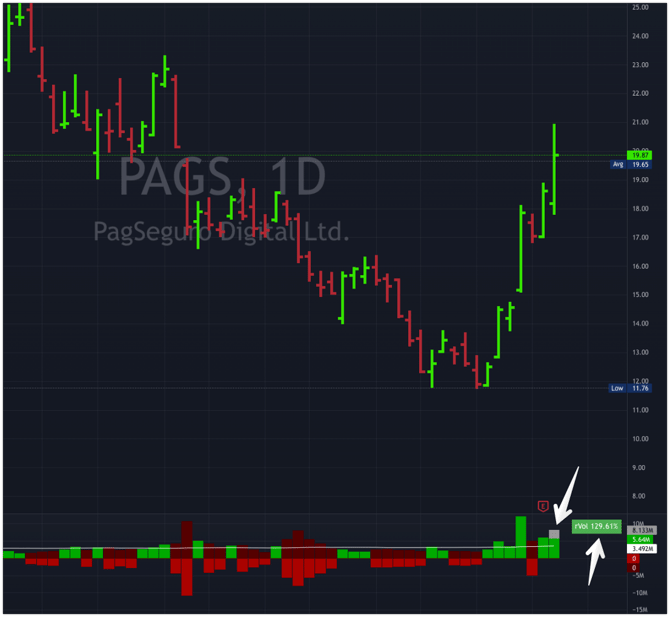
This indicator predicts the end of day ( EOD ) total market-hours volume, and puts up a gray volume bar showing what that candle will look like as well as showing the relative volume figure in terms of % over normal average volume (50 day) in a box at the upper right of the indicator. You may need to leave some room for the "rVol%" box on your charts.
HOW TO USE
If volume is projected to be above average or above recent volume levels, than that move (whether price is up or down) is considered to be "truthful" and with conviction and follow through. So on a high volume green day you may want to enter a long position. Or if you already have a position, you can choose to hold until the next day. Or in the case of extremely high volume extended from recent base or MAs you may see this as a predicted sign that this is a topping day on exhaustion and wish to exit your position.
If volume is projected to be below average or below recent volume levels, thanthat move (again whether up or down) could be considered to be "without conviction" and without follow through. So on a low volume green day you may want to avoid entering a long position. Or if you already have a position you might consider taking some off (taking some profits / scaling out) since the buying looks like it is stalling for the day.
VIEW UP AND DOWN VOLUME SEPARATELY
It also displays Up (BUY) volume in an upper region and Down (SELL) volume in a lower region, so that you can separate out buying and selling volume trends and do trendline analysis of the buy or sell side, revealing if selling is slowing down and buying is picking up and other insights.
The "mirror" Up Down Volume display:
The reason for displaying up volume above and down volume below, is so you can easily see SELLING vs BUYING volume trends. You can use trendlines to analyze how specifically SELL volume days or BUY volume days are progressing and can see when there may be a SELLING or BUYING specific "breakout".
FURTHER FUNCTIONALITY:
rVol% Box Colors:
Green or Red = projected to be above average volume
Gray = Projected to be below average volume
Display Ghost Down Volume:
By default the down volume is also lightly "ghost" displayed in the upper BUY volume region. This is to help you do side by side comparisons of the heights of the BUY bars vs the SELL bars. There are no "ghost" bars in the SELL area, because you already can do that comparison in the upper region with down ghost bars displayed.
NOTE:
If you prefer, you can turn off the lower SELL volume region and have it displayed in the upper region with BUY volume side by side. However, the indicator will not increase in size due to a limitation within TradingView scripting which cannot "remove" a value even if it's invisible or hidden.