


During the summer of 2021, I embarked on a crazy but very delicious journey - I ate a dozen eggs every day for 30 days. I had other meals too and the eggs were cooked in a variety of different ways, but yes, by the end of it all, I had consumed 360 exquisite eggs.
The idea was born out of boredom, my love of eggs and my interest in scientific experimentation. More specifically, I wanted to see whether the media-fueled vilification of egg consumption held up to scrutiny.
Before we carry on, I must highlight that this was not an experiment. I did not control for other variables, I even ate different types of eggs including quail and duck eggs. And though enjoyable, I did not and likely will not repeat those 30 days anytime soon. Take this instead as an observation and a personal journey into the science of eggs and cholesterol (the one thing people worry about eating eggs).
NB: It goes without saying that you should not take anything I write as medical advice!
Before the eggy experience.
My baseline
At the time, I was 29 years old, with a body fat of around 10% and I ate a low-carbohydrate diet. I usually have around 50g-100g of carbohydrate a day. I kept all other aspects of my lifestyle the same as possible during the 30 days.
It is important to know my baseline because I am not you, and I certainly do not live averagely. Again, this is not an experiment, view my results for what it is and do not generalise them to yourself or others. I may have an unknown rare gene defect I do not know about that may have obscured my results for example.
Blood tests
Before embarking on my egg-filled month, I took some blood tests using https://thriva.co (No, I am not affiliated with them before you ask).
I took a handful of blood markers including:
- A testosterone profile
- Omega 3-6 ratios
- Vitamin D
- Apolipoproteins and cholesterol profile
I picked these four markers specifically because, in my opinion, they were the most likely to have changed over the month.
Here are my blood results before and after 30 days of egg consumption:
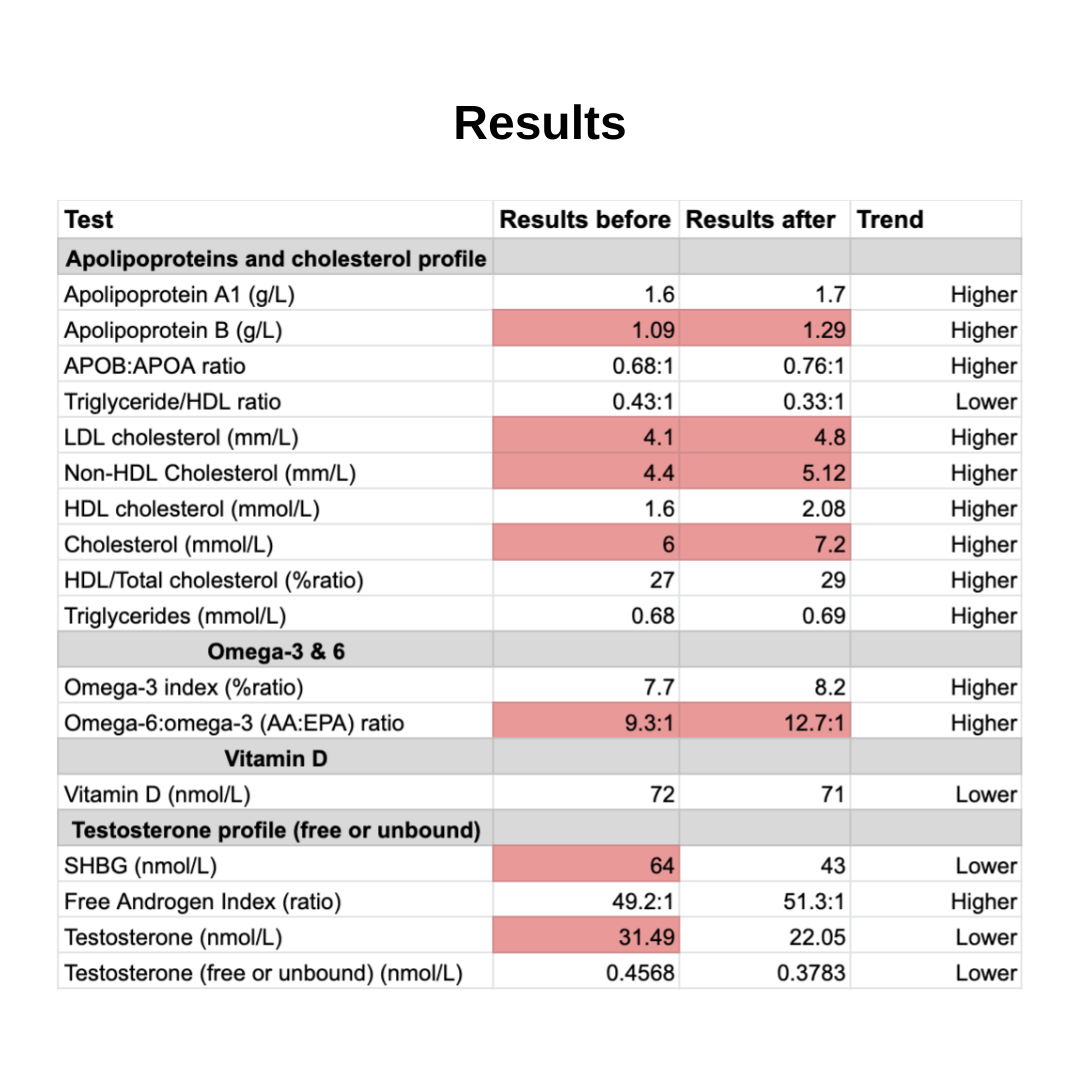
In summary, before eating 12 eggs a day for 30 days my:
- LDL cholesterol was reported as high.
- HDL cholesterol was reported as normal.
- Omega-6:omega-3 ratio was reported as abnormal.
- Vitamin D levels were sufficient.
- My testosterone levels were supposedly high.
After 30 days of eating 12 eggs a day, my:
- LDL cholesterol increased.
- HDL cholesterol increased.
- Omega-6:omega-3 ratio had reportedly worsened.
- Vitamin D levels pretty much stayed the same.
- My testosterone levels normalised.
Sorry for the data dump!
The lists of numbers above and words like ‘Apolipoprotein B’ is enough to make anyone a little nervous. It’s understandable if you feel a little lost, I did too, reading it for the first time.
But fret not, I’m going to cover each of the four blood sections below.
Part 1 - Understanding Cholesterol
MYTH BUST #1 - Cholesterol is essential for all animal life.
As Dr Ronal Krauss, senior scientist and director of atherosclerosis research at children’s hospital Oakland Research Institute, has said, “the fundamental role of cholesterol is one that promotes health’’.
Cholesterol is an organic molecule which is essential for all animal life. Do not be afraid of it. It is also more complex than having ‘good’ and ‘bad’ cholesterol. In fact, I’d urge you to actively move away from this dichotomous way of thinking. Nothing in science is either ‘good’ or ‘bad’ but instead context-based, extremely complex and, as you will find out, answers usually lie in the grey.
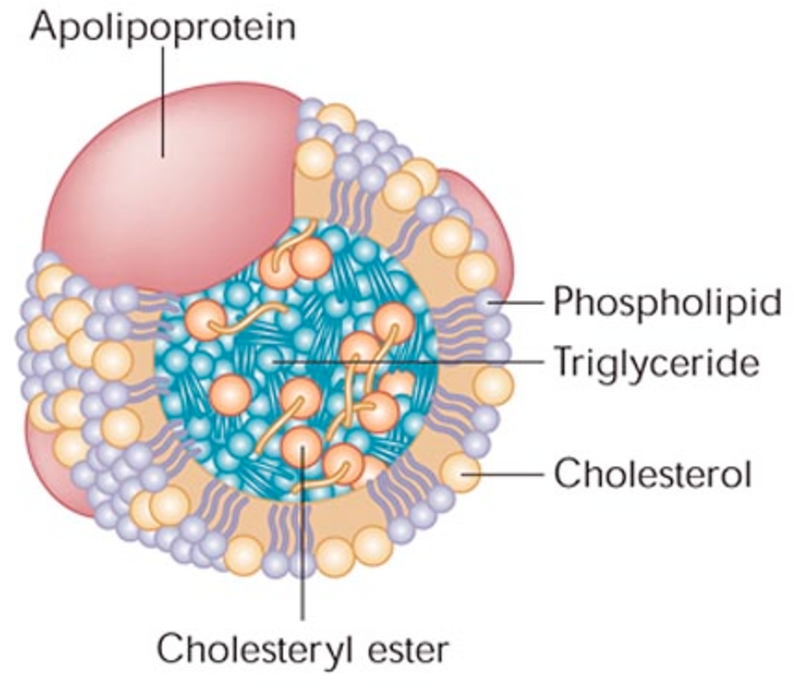
MYTH BUST #2 - When most people say cholesterol, they are referring to the structure that encases them. HDL and LDL aren’t cholesterols, they are lipoproteins.

Lipoproteins are spherical structures formed by the liver that are made up of lipids (fats) and proteins that help keep fats dissolved in the blood as they transport them to and from tissues.
Lipoproteins are classified based on their density. In general, the higher the protein to fat ratio in the lipoprotein, the denser the lipoprotein.
The major lipoproteins are:
- Chylomicrons and their remnants
- Very low density lipoproteins (VLDL)
- Low density lipoproteins (LDL)
- High density lipoproteins (HDL)
The main function of lipoproteins is to transport triglycerides to cells. In cells triglycerides get used up and broken down into fatty acids – used for energy storage, muscle and in adipose tissue. Cholesterol itself is a secondary passenger. As triglycerides get used up in these particles, the particles themselves get smaller and denser. The lipoproteins lose triglycerides but tend to retain most of the cholesterol. As VLDL lose triglycerides they turn from larger buoyant particles to smaller and denser LDL particles.
MYTH BUST #3 - LDL isn’t ‘bad’, we must look closer to find the truth.
The word on the medical street is that LDL is ‘bad’, your GP will tell you that and then discuss statins. I am arguing that there are other other things at play, like the individual’s biochemical background, levels of inflammation and the size and shape of LDL. Before we go ahead, let's understand what else is being measured and how they’re being measured too.
What are apolipoproteins?
Apolipoproteins are proteins that are associated with lipoproteins, they have four major roles:
- Provide structural support
- Act as a ligand for receptors
- Guide the formation of lipoproteins
- Act as activators or inhibitors of certain enzymes
Different lipoproteins have different apolipoproteins. Apolipoprotein B is the primary apolipoprotein of chylomicrons and all other other lipoproteins apart from HDL. Another name for chylomicrons are ultra-low density lipoproteins (ULDL). These particles transport lipids absorbed in the intestines to the rest of the body.
By measuring apolipoprotein B you are also measuring these lipoproteins. Apolipoprotein A1 is the major protein component of HDL particles in plasma.
How is LDL measured?
MYTH BUST #4 - LDL isn’t cholesterol, when we measure LDL in our blood we are actually calculating the cholesterol inside LDL particles. This applies to the other lipoproteins too.
And the labs are actually measuring LDL-C (“C” stands for concentration), and they do this by using the Friedewald equation.
The Friedewald equation (mg/dL):
LDL-C mg/dL = Total cholesterol – (HDL-C + VLDL-C*)
*VLDL-C is calculated as Triglycerides/5
As you can see, this is an indirect estimate of LDL. The LDL-C number is reliant on the total cholesterol, HLD-C and VLDL-C measured. The equation further assumes that virtually all of the plasma TG is carried on VLDL, and second, that the TG:cholesterol ratio of VLDL is constant at about 5:1. Neither assumption is strictly true.
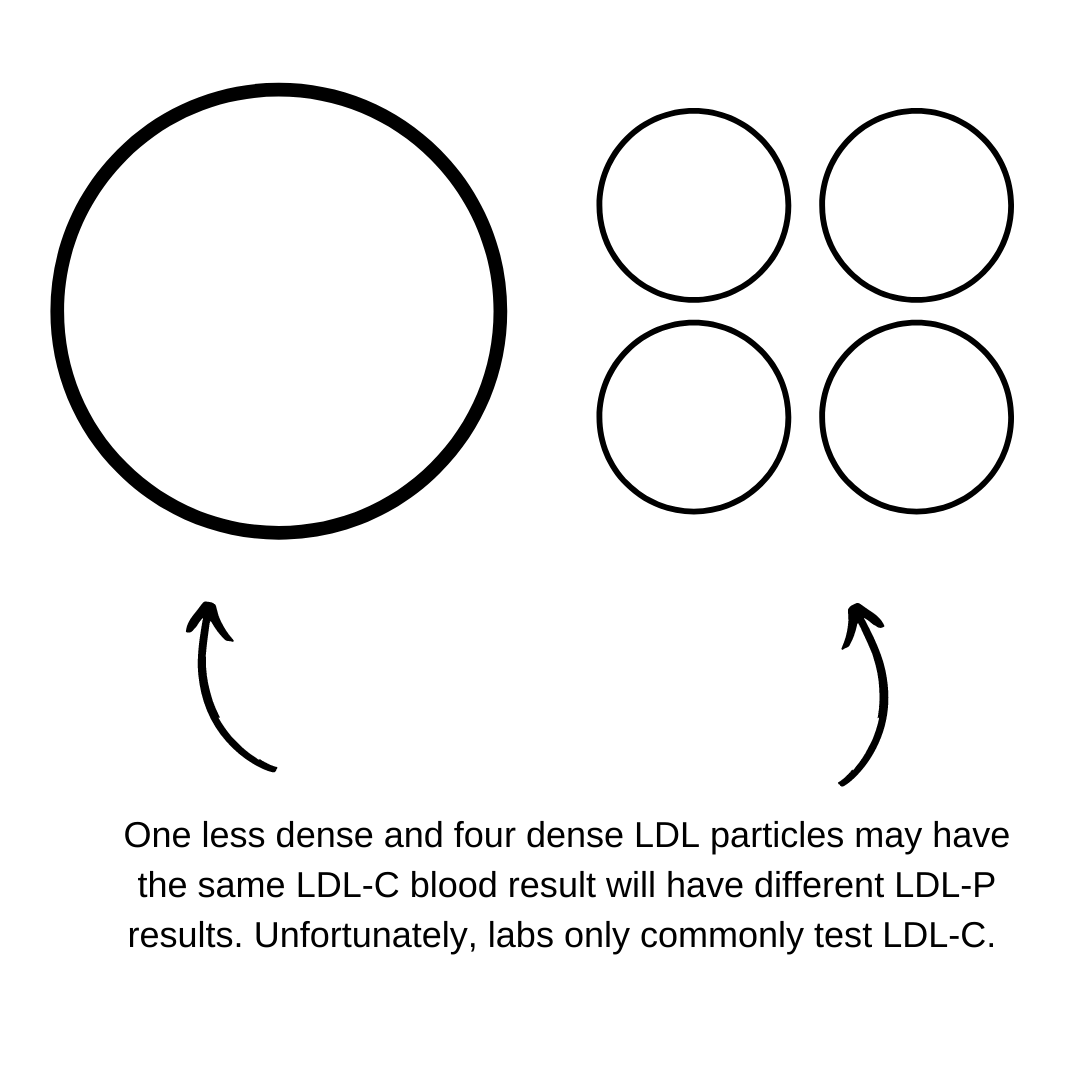
LDL-C is a measurement of the cholesterol within all LDL particles in your blood. It is part of the lipid profile as a significant subset of the population have LDL particles in the middle of LDL size and density range. Therefore, in most people the cholesterol content within LDL particles is fairly proportional to the number of LDL particles. But, remember, if you aren’t ‘most people’ then LDL-C may not be a useful marker for you.
MYTH BUST #5 - LDL particles aren’t made equally. The smaller and denser the LDL particle, the more atherogenic it is.
LDL particles have a varying amount of cholesterol within and thus are on a spectrum of less-dense to more-dense. These different forms of LDL across this spectrum have different metabolic and pathologic properties. The amount of cholesterol in each particle may vary and therefore LDL-C does not always reflect the actual number of particles.
Why does LDL particle size matter?
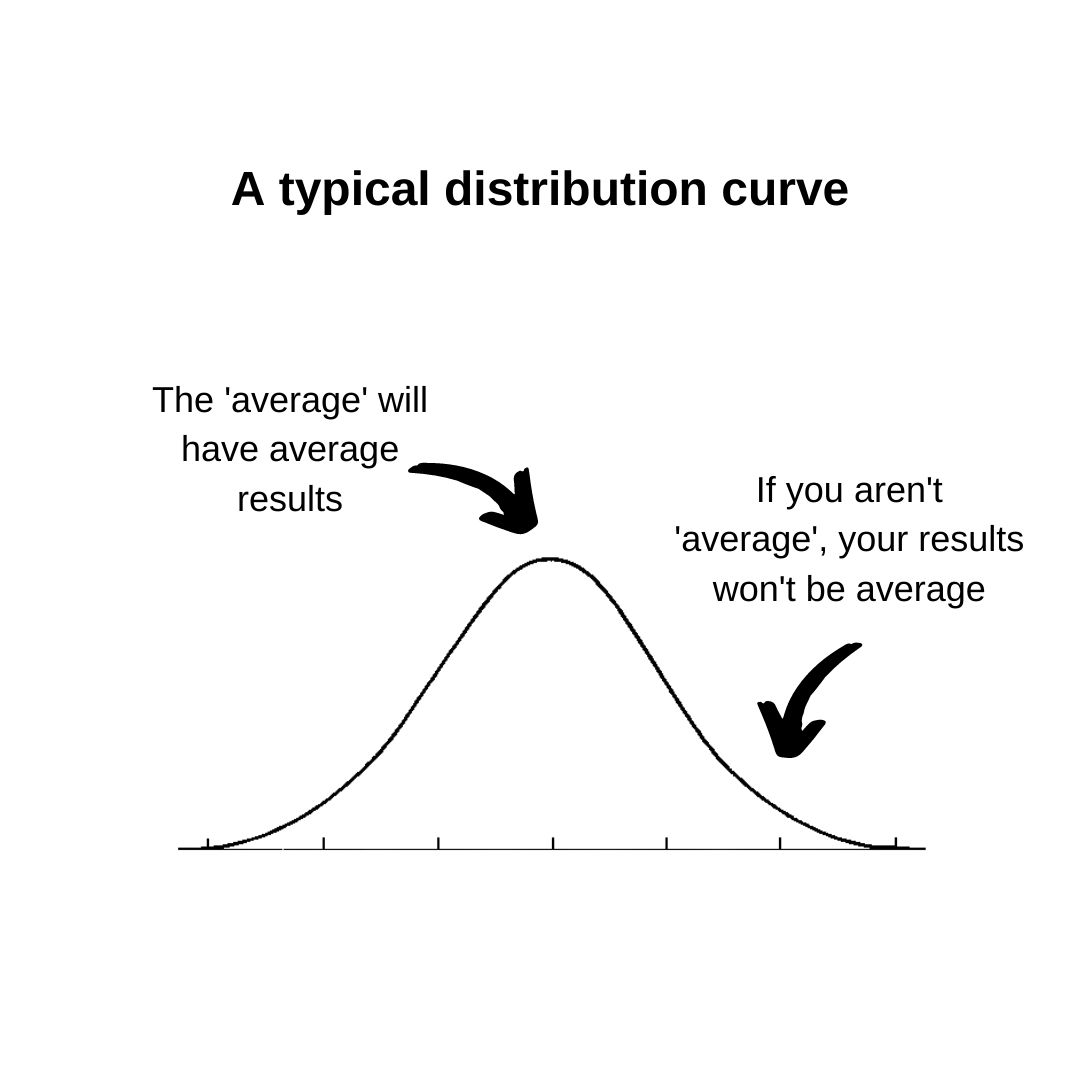
We have another test to measure the actual number of LDL particles, this is LDL-P (LDL particle count). This test isn’t routinely undertaken as it is more expensive than measuring LDL-C, and in most people measuring the LDL-C would suffice (see distribution curve).
But if you don’t lead an average lifestyle (like myself) and/or you’d like to have a more accurate measurement of LDL, I’d recommend an LDL-P test.
This is because LDL-P is more strongly correlated to cardiovascular disease risk than LDL-C. A pertinent point to remember is that it is the LDL particle that causes plaque to develop in the artery, not the cholesterol. The cholesterol in an LDL particle is just additional cargo. The LDL particles that contain less cholesterol are smaller and denser. Those with higher heart disease risk and those with evidence of heart disease tend to have more of the particles that are smaller and denser. Those who are healthier tend to have more of the larger, more buoyant LDL.
What may be the most important cholesterol test to determine heart disease risk?
Of all those blood tests results, the one that I was most interested in was the triglyceride/HDL ratio. You can see that though my LDL level went up, which would have worried most health professionals, my triglyceride/HDL ratio lowered, which reassured me. Why? Well, because of atherogenic dyslipidaemia.
Atherogenic Dyslipidemia is a term describing a triad consisting of:
- Increased concentrations of LDL
- Decreased concentrations of HDL
- Increased concentrations of triglycerides
This triad is a typical feature found in obesity, insulin resistance, type 2 diabetes and metabolic syndrome, and is an important risk factor for cardiovascular disease. The triad also has some genetic basis and is affected by diet.
One study found that the atherogenic dyslipidaemia trait was much more highly associated with cardiovascular events than LDL-C alone. It is also believed that small dense LDL particles (as opposed to large, safe and buoyant LDL particles) are linked to insulin resistance and atherosclerosis. This again further highlights the inadequacy of only focusing on LDL-C numbers.
My triglyceride/HDL ratio improved and so my risk of atherogenic dyslipidaemia lowered. My improvement in triglyceride/HDL ratio was primarily due to an increase in my HDL levels.
What is HDL?
HDLs are termed ‘good cholesterol’ as they oppose atherosclerosis. They remove cholesterol from foam cells as well as inhibit oxidation of LDLs and reduce underlying inflammation seen in atherosclerosis. Low HDL cholesterol is a stronger predictor of heart disease risk overall than high LDL. Decreased HDL
cholesterol is also associated with increased level of small LDL particles.
This mouse study showed that apolipoprotein A1, the major protein component of HDL, potently suppresses tumor growth and metastasis through both innate and adaptive immune processes. Impressive!
Summary of my cholesterol blood results.
At first glance, many may look at my blood results and conclude that eating 12 eggs a day for 30 days was not a good idea. “Look, his LDL went up, he’ll probably die of a heart attack next week”, they say and conclude that eggs should be consumed sparingly.
But I say otherwise. You now and those who have read my cholesterol ebook, will understand why my cholesterol results were actually favourable after the 30 days. My HDL markers improved, and so did my triglyceride/HDL ratio. Both of these blood results are better associated with cardiovascular outcomes than measuring LDL alone. Furthermore, LDL-C is not a reliable marker in ‘non-average’ participants (me with a low-carbohydrate lifestyle). And a higher LDL is actually commonly associated with longer life! I’ll take that!
I actually don’t think eating eggs made a huge difference to my cholesterol results if I’m being brutally honest. This is because when we ingest cholesterol in our food, our body compensates by reducing the biosynthesis of it. I actually think that I must have ingested lower carbohydrates than normal for me during this period of time, which has favourably affected my blood results. All in all though, we will never know what specifically caused changes, because remember, this wasn’t an experiment!