
Managing a project without clear visibility into key metrics is like flying blind. You need instant, digestible insights—not static spreadsheets or complex dashboards that require training.
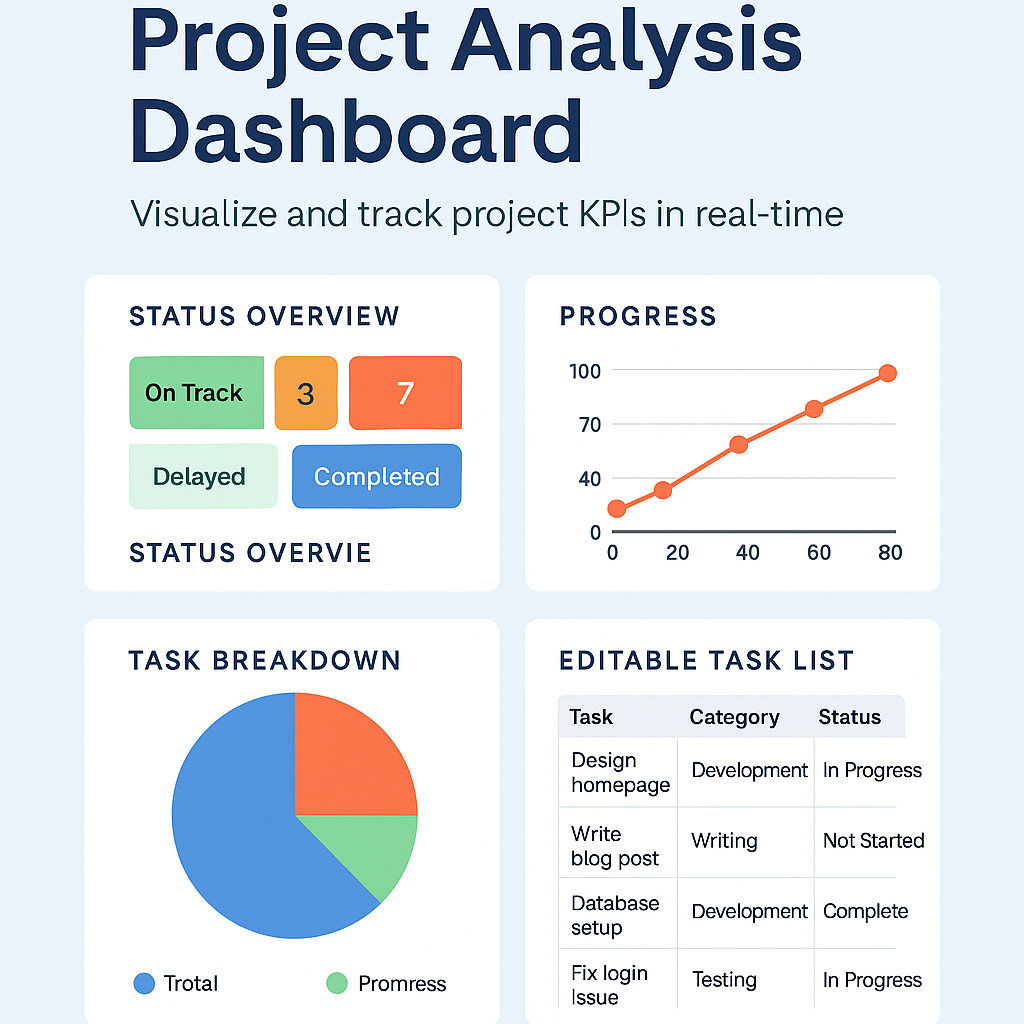
That’s why we built the Project Analysis Dashboard — a lightweight, browser-based web app that transforms project data into clean, interactive charts you can actually use.
Whether you’re a project manager, team lead, or independent consultant, this dashboard helps you stay on top of your KPIs, timelines, resources, and risks—all from one visual interface.
🚀 What Is the Project Analysis Dashboard?
The Project Analysis Dashboard is a simple yet powerful HTML-based application that tracks:
- ✅ Project status by category (on track, delayed, completed)
- 📊 Visual summaries using charts (bar, line, and pie)
- 📅 Progress trends and completion rates
- 🛠️ Team contributions and resource usage
- ⚠️ Issue flags or problem areas at a glance
It’s ideal for professionals who manage multiple tasks, teams, or deliverables—and need something that works fast, with zero setup.
🧩 Key Features
📍 Live KPI Visualization
- See how many tasks are pending, completed, or overdue
- Filter by task type, owner, or priority
📈 Dynamic Charts
- Built-in bar, pie, and line charts update in real-time as you input or adjust data
- Perfect for status meetings and stakeholder reports
🗂️ Editable Task List
- Manually enter or copy/paste project data into a structured table
- Automatically reflected in the charts above
🌐 Browser-Based, No Install
- Pure HTML + JavaScript app—just download and open in your browser
- No internet connection required once opened
🔒 Local Data = Private & Secure
- No accounts, no cloud sync—all changes stay local in your browser tab
📊 Example Use Cases
- Project Managers tracking milestones and deliverables
- Consultants presenting clear data to clients
- Scrum Masters or Agile Leads monitoring sprint progress
- Engineering or Development Teams analyzing timelines and effort
- Small Business Owners visualizing internal operations
📁 What You Get
FeatureDetailsFormatHTML (offline, no install needed) Compatibility Desktop & mobile browsers Input Type: Manual task list or CSV conversion Charts Included Pie, Bar, LineSecurity 100% local data, no tracking
🛒 Ready to Try It?
Download the Project Analysis Dashboard
No subscription, no login, no bloat. Just simple project insight.
✅ Final Thoughts
This dashboard is for people who care about clarity and action—not fluff. It’s minimalist by design, professional in tone, and designed to help you focus on what matters most in your project: progress and accountability.
Use it for your next project and see the difference a clear visual overview can make.
Comments ()