
Food cost percentage tells you how much of every dollar of food sales went on the food itself. It is the first number an owner asks about when margins slip, and the one most kitchens calculate wrongly, usually because the inventory count is skipped.
The formula
Food cost % = (Opening inventory + Purchases − Closing inventory) ÷ Food sales × 100
The part in brackets is your cost of goods sold (COGS) for the period. Use the same period for every figure, normally one week or one month, and count food only. Beverage, packaging and staff meals belong in their own lines.
Worked example
These figures are illustrative. A restaurant closes the month with:
- Opening inventory: $8,000
- Purchases during the month: $21,500
- Closing inventory: $7,200
- Food sales: $70,000
COGS = 8,000 + 21,500 − 7,200 = $22,300. Food cost % = 22,300 ÷ 70,000 × 100 = 31.9%.
Without the two inventory counts, the kitchen would report purchases only: 21,500 ÷ 70,000 = 30.7%. The month looks better than it was, and the $800 drop in stock is hidden.
Plate cost: the same idea for one dish
For a single dish, divide the ingredient cost of one portion by its menu price. A dish that costs $4.20 to plate and sells for $15.00 runs at 4.20 ÷ 15.00 = 28.0%.
To price a new dish from a target, turn the formula around: Menu price = Plate cost ÷ Target food cost %. At a 30% target, the $4.20 dish needs a price of $14.00. At 28% it needs $15.00.
Plate cost is only as good as the recipe card behind it. Cost each ingredient at its usable weight after trimming and cooking (the yield), not at the weight on the invoice, or every plate cost will be too low.
Theoretical versus actual food cost
Theoretical food cost is what the month should have cost, based on what you sold and the recipe cost of each item. Actual food cost is the inventory-based figure above. The gap between them is waste, over-portioning, theft, unrecorded staff meals and price increases you have not yet loaded into your recipes.
If theoretical cost is 29.5% and actual is 31.9%, the gap is 2.4 points. On $70,000 of food sales, that is about $1,680 a month that never reached a plate a guest paid for.
What is a good food cost percentage?
It depends on the concept, the price point and how much labour the menu needs. Ranges of roughly 28% to 35% are often quoted for full-service restaurants, with fine dining and high-volume quick service at different ends. Two numbers matter more than any industry average: your own target, set when you priced the menu, and the trend from month to month.
A monthly routine that keeps it under control
- Count inventory on the same day and at the same time each period, by the same people.
- Update ingredient prices in your recipe costing whenever a supplier changes a price.
- Compare theoretical and actual food cost every month and investigate any gap above one point.
- Run a menu engineering review each quarter: popular low-margin dishes get re-costed or re-portioned first.
- Track waste daily for two weeks whenever the gap widens. The pattern usually points to one or two items.
Template
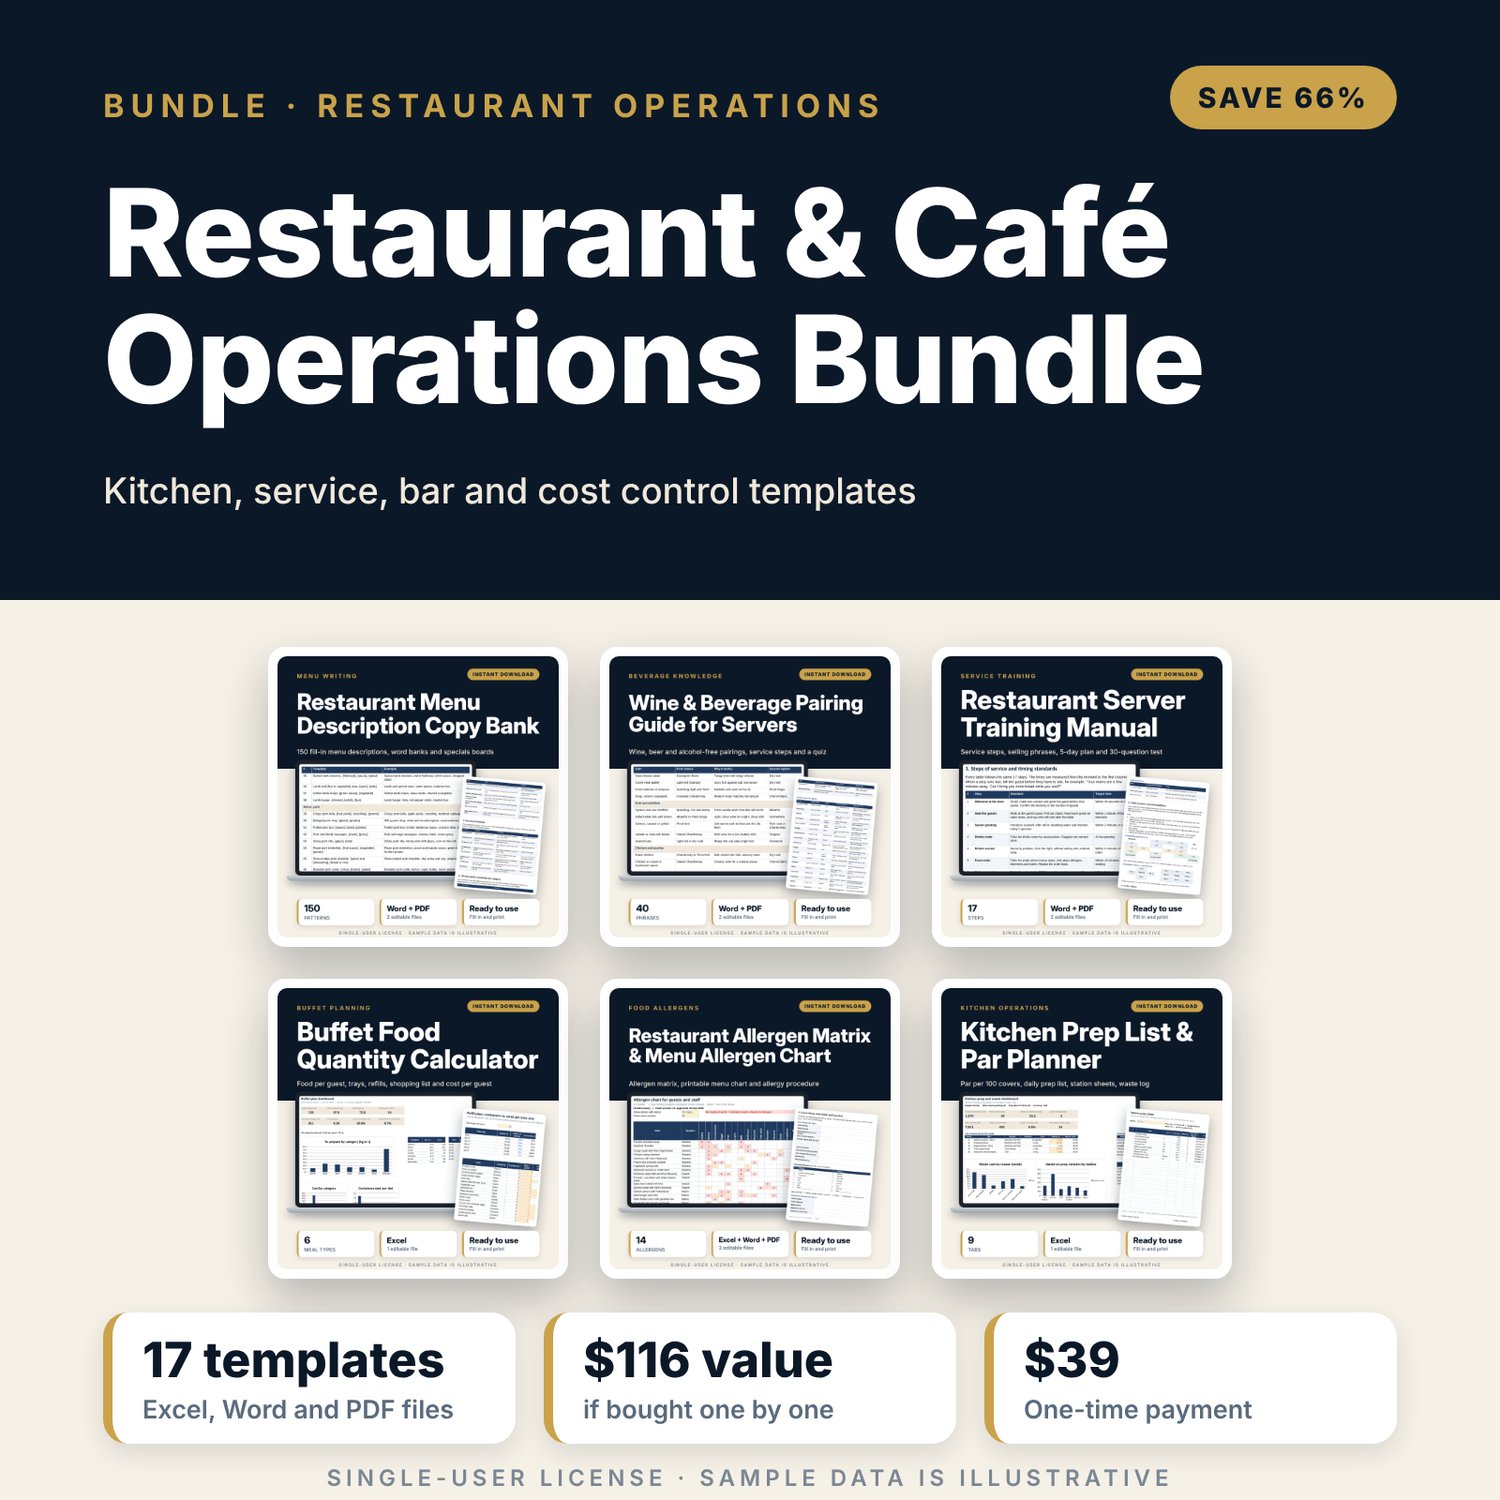
The Menu Engineering & Food Costing Toolkit does this in Excel: an ingredient price list, sub-recipes, recipe costing, a menu mix and price simulator, price alerts and daily and weekly tracking, plus a 24-page guide that covers yield tests and printable costing forms. It is also part of the Restaurant & Café Operations Bundle, which adds kitchen, bar and labour cost templates.