

Hello.
Here I will lay out my trading scenarios for the coming week.
This “Trading Scenario” blog is posted every Sunday.
On Saturdays, I publish the “Weekly Trading Report,” where I review how I actually thought and executed trades throughout the week.
Starting in September, the Saturday “Weekly Trading Report” will be distributed as subscription-only paid content on X, enhanced with video and much more.
By reading both the Trading Scenarios and the Weekly Trading Reports together, you can see at a practical level how I think in advance, what I wait for, and how I execute consistently.
For details on my strategy, please refer to my blogs on Dow Theory and multi-timeframe analysis.
A scenario is not a prediction.
It is not about forecasting the market, but rather my personal plan of action: “If this happens, then I will do this.”
I do not predict the market, and this should not be interpreted as such.
This is not an instruction to buy or sell, nor is it a signal service.
It does not guarantee future profits.
It is purely educational, showing how I execute a consistent process.
You alone are responsible for the outcomes of your trades, so please trade at your own risk.
Let’s begin with USDJPY.
(On the charts I post, orange lines represent daily, red represent 4-hour, blue represent 1-hour, and green represent 15-minute timeframes.)
〜・〜・〜・〜・〜・〜・〜・〜・〜・〜・〜・〜・〜・〜・
USDJPY
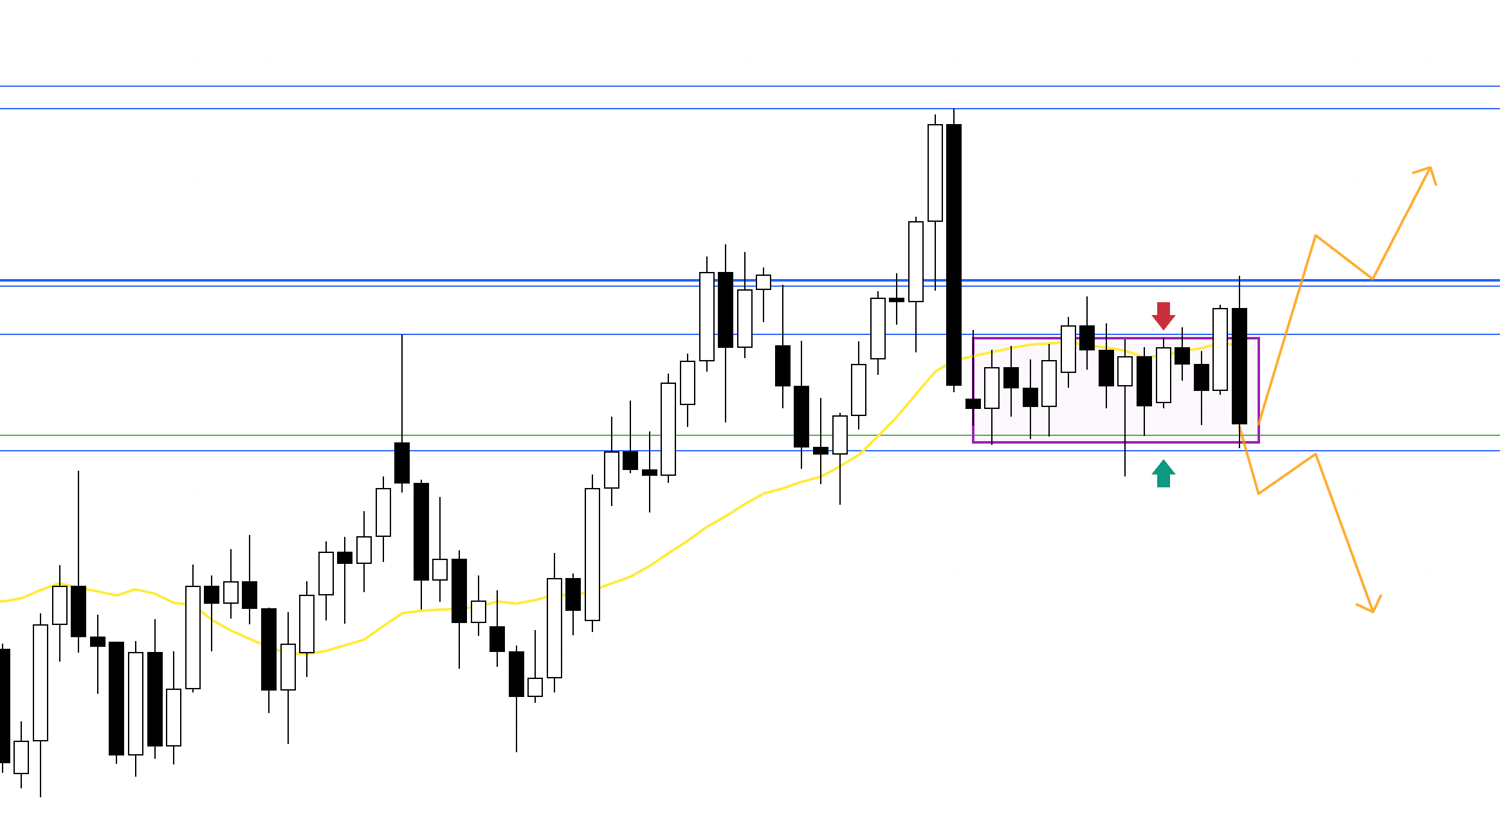
Daily

As in last week’s scenario, the daily chart remains range-bound.
My base plan is to wait for a breakout either above or below before considering trades.
Let’s look at the 4-hour chart.
4H
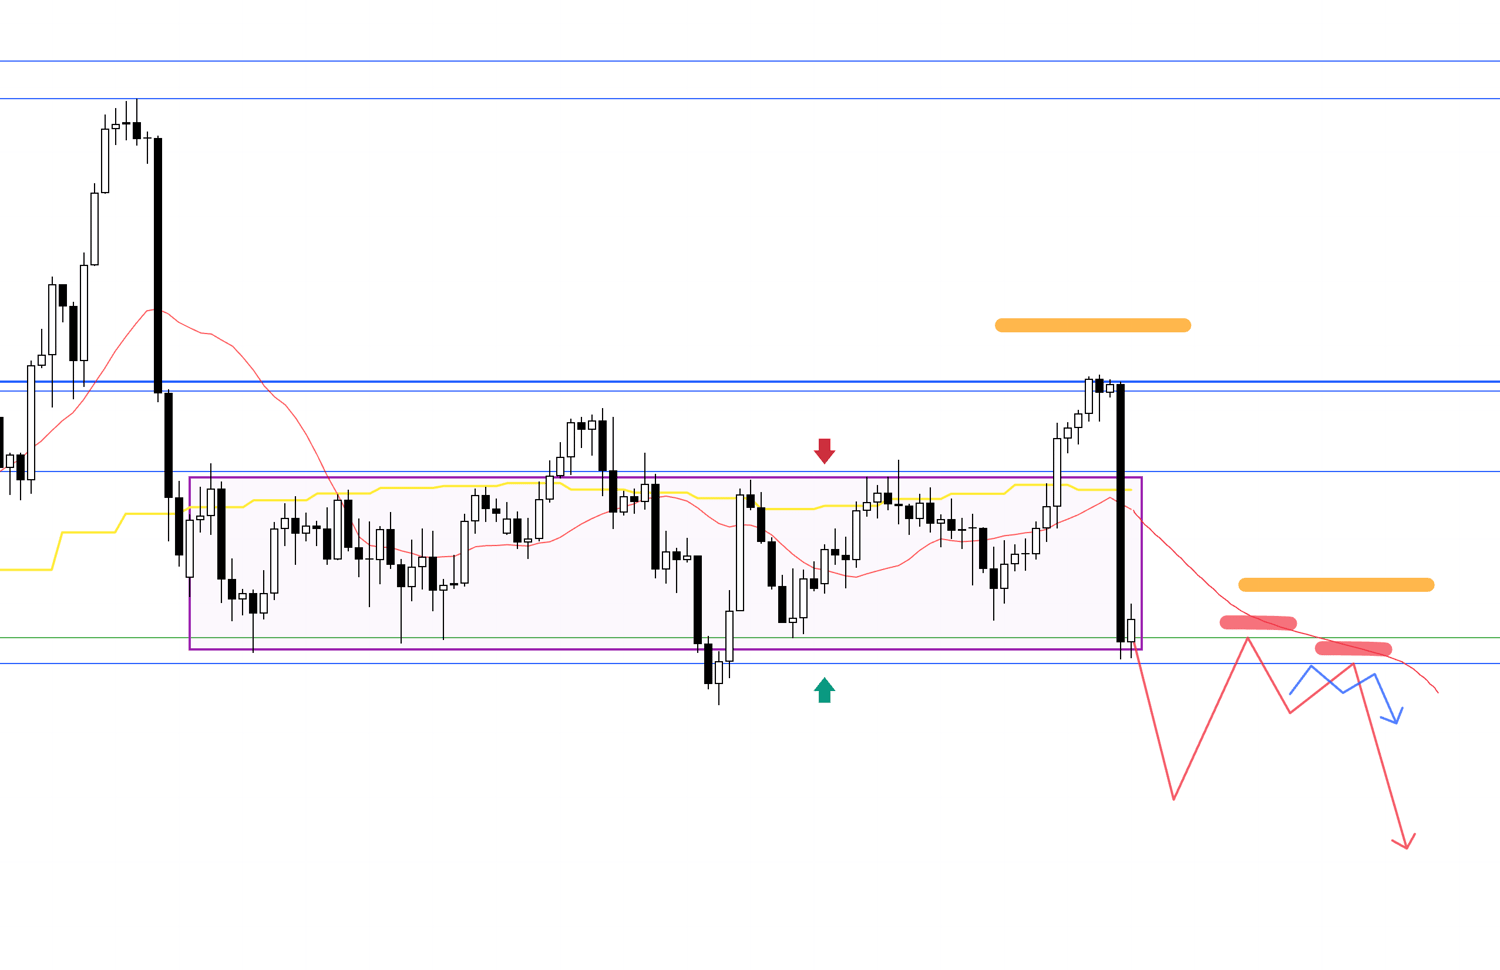
On the short side: if price breaks below the support line, then returns to form a new lower high on the daily, I would look for an entry on the lower timeframe within the 4-hour structure of lower highs.
If price then reverses from that decline and sets up for a buy, the plan looks as follows:
4H
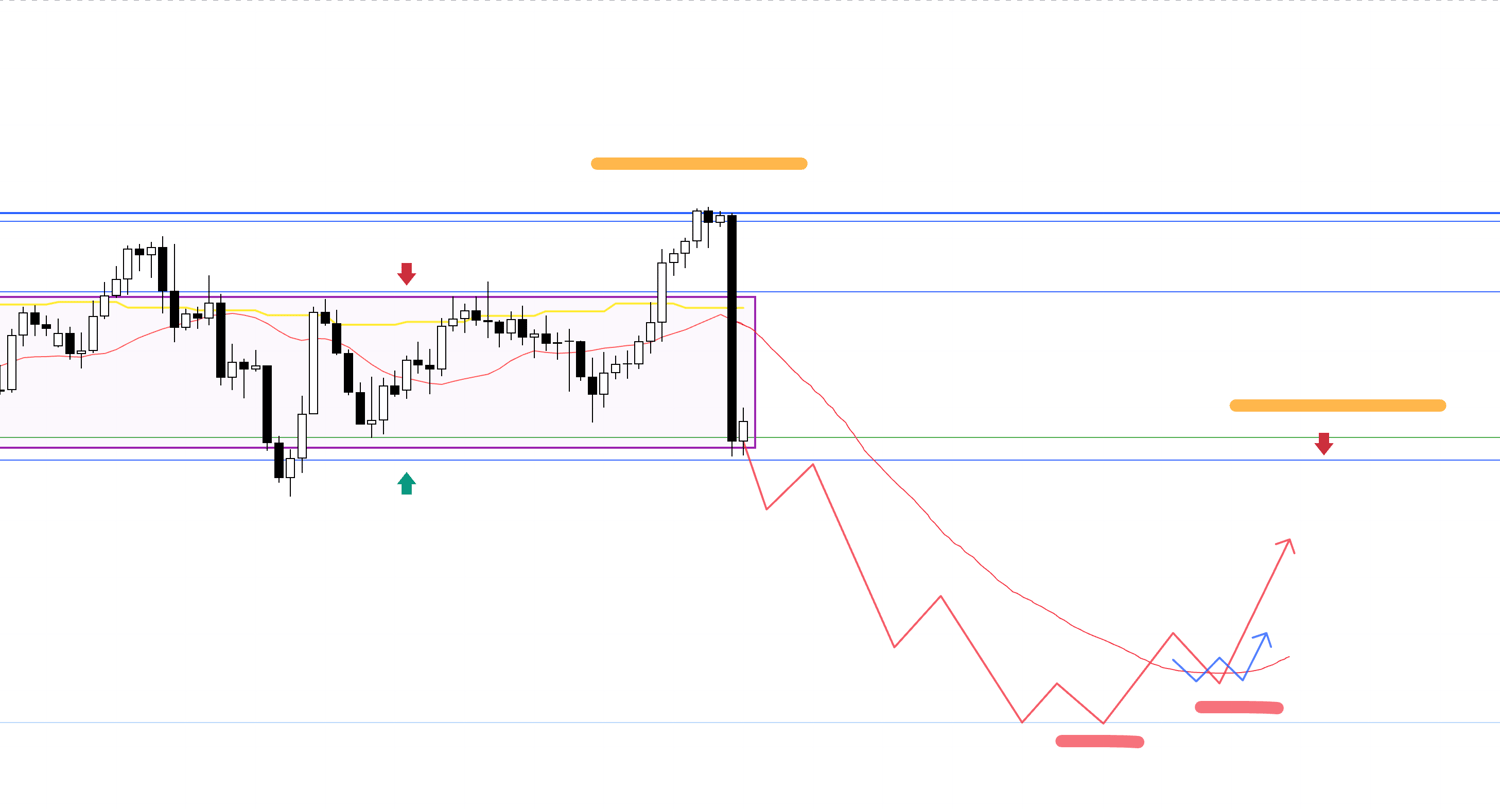
If the 4-hour shows signs of bottoming and turning up, I would consider an entry within the higher-low structure, ideally on the lower timeframe.
This move would represent a daily pullback, driven by profit-taking from the prior 4-hour downtrend.
In this case, the daily break of lows means a downtrend is already in play, and sellers will be looking to sell rallies.
Lines currently functioning as support could flip into resistance, increasing selling pressure.
The key will be whether attractive entry points emerge with a favorable risk-reward setup.
Now, let’s also consider the bullish scenario.
4H
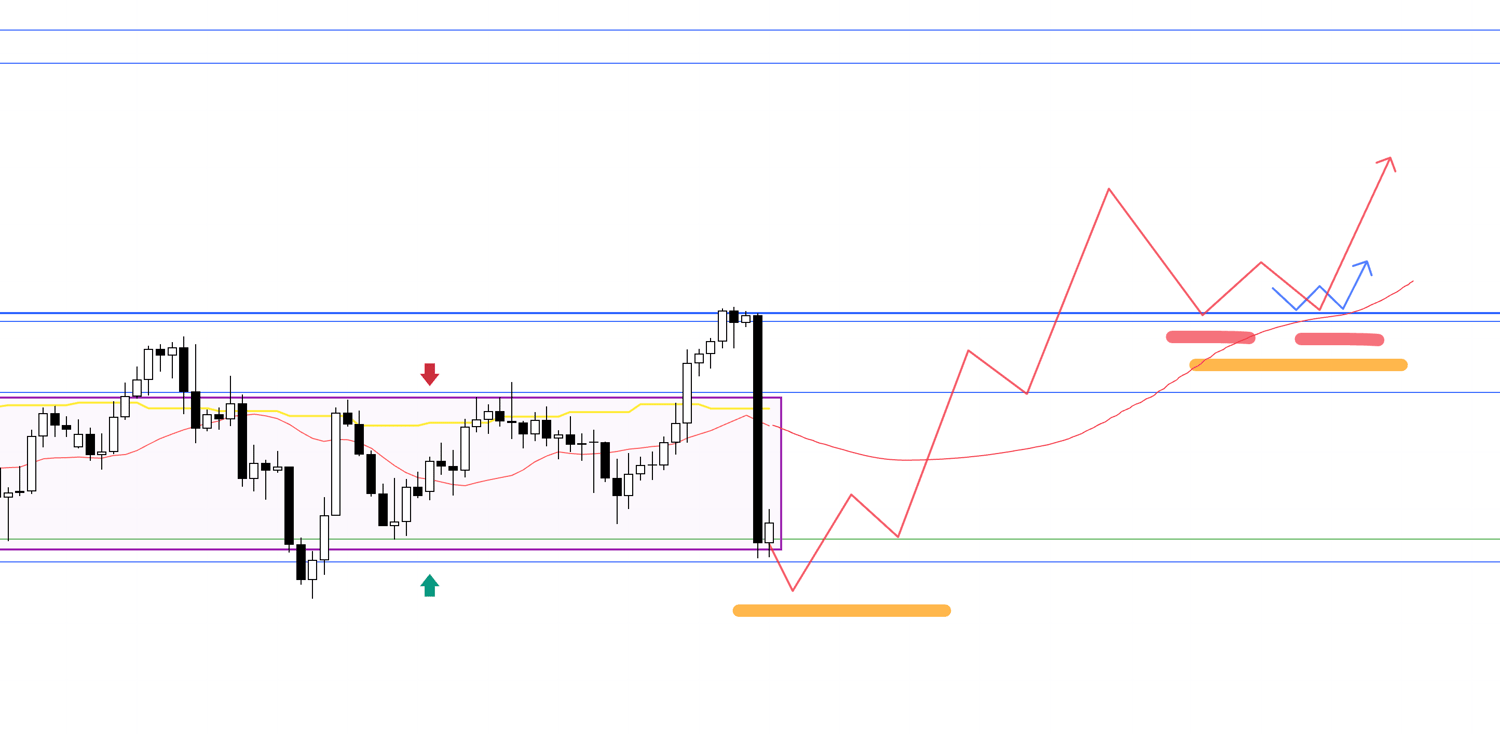
If price breaks out above the range and forms a higher-low on the daily, the buying bias strengthens.
If the 4-hour also forms higher-lows within that daily structure, I would consider an entry on the lower timeframe.
Now, let’s turn to EURUSD.
〜・〜・〜・〜・〜・〜・〜・〜・〜・〜・〜・〜・〜・〜・
EURUSD
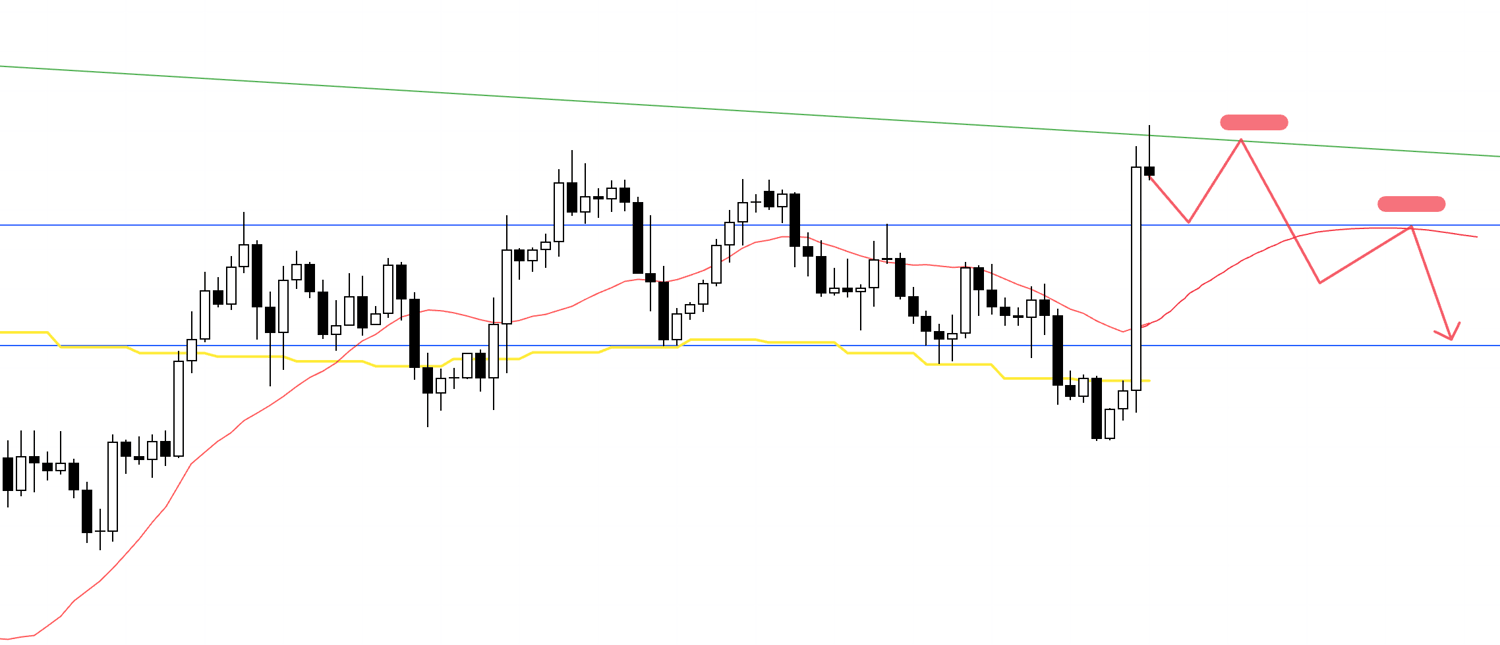
Daily
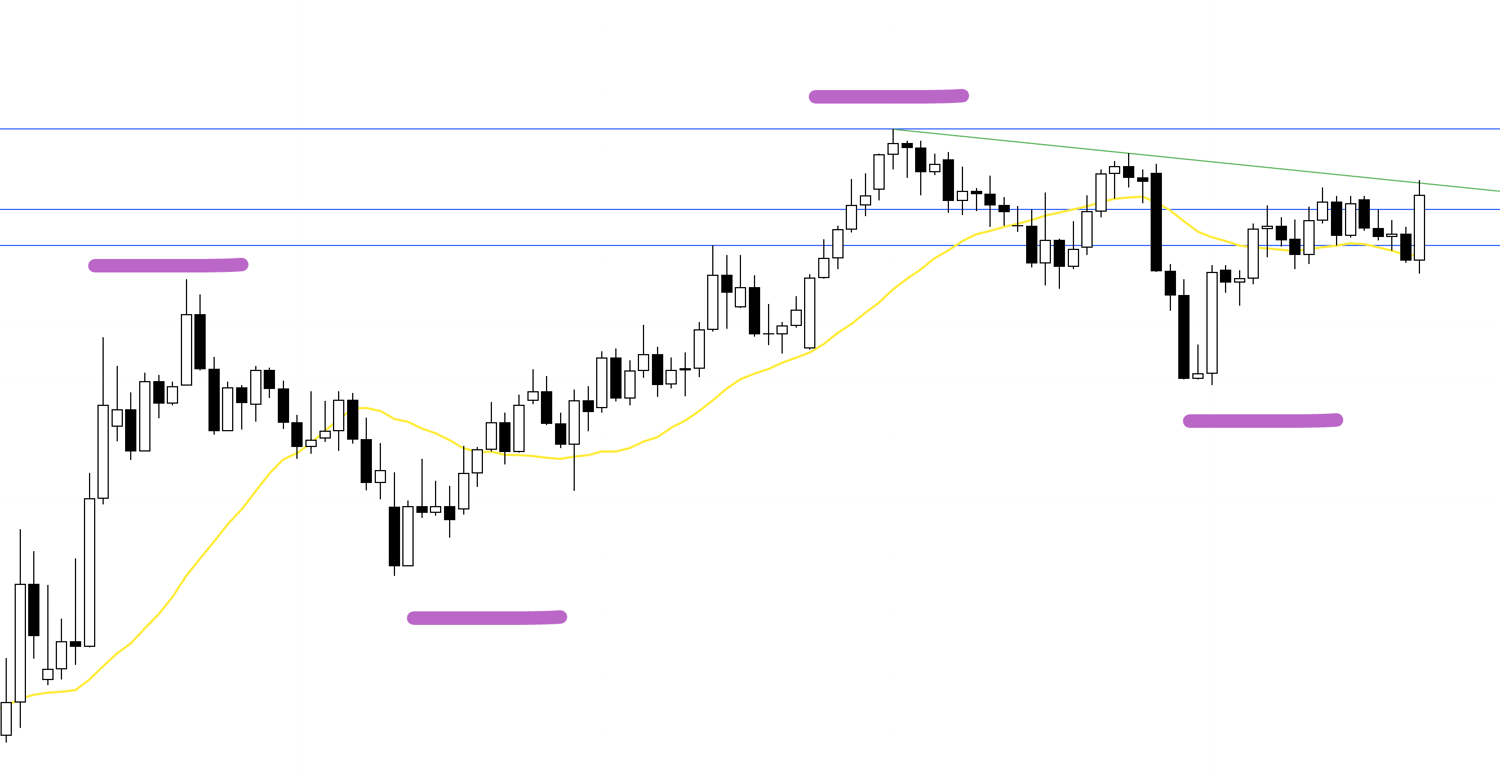
On the daily, the recent uptrend looked like it might break down, but instead price quickly pushed to new highs.
If a new higher-low forms, the uptrend could resume.
In that case, the weekly would frame it as a buy-the-dip.
(Weekly movement is shown in purple on this daily chart.)
However, as noted last week, the weekly chart also shows lower highs capped by a green trendline.
Both buyers and sellers are pressing, creating a fragmented order flow.
That balance must be considered when mapping scenarios.
Now the 4-hour.
4H
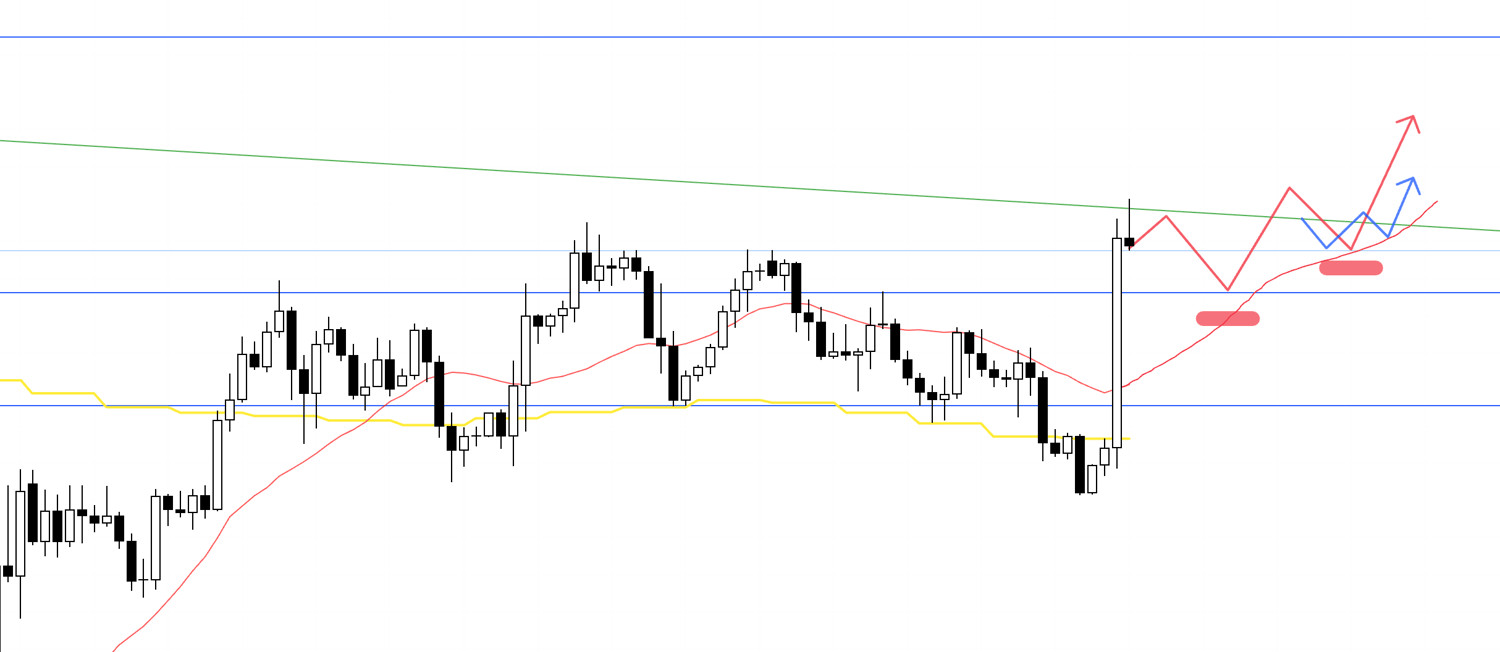
If the 4-hour shows higher-lows supported by the daily structure, I would look to buy on the lower timeframe, following the daily buy-the-dip move.
4H
It could unfold like this, though the actual path is uncertain.
What matters is the process: with the daily showing new highs, dips are more likely to be bought, so I would focus on identifying buy opportunities in real time.
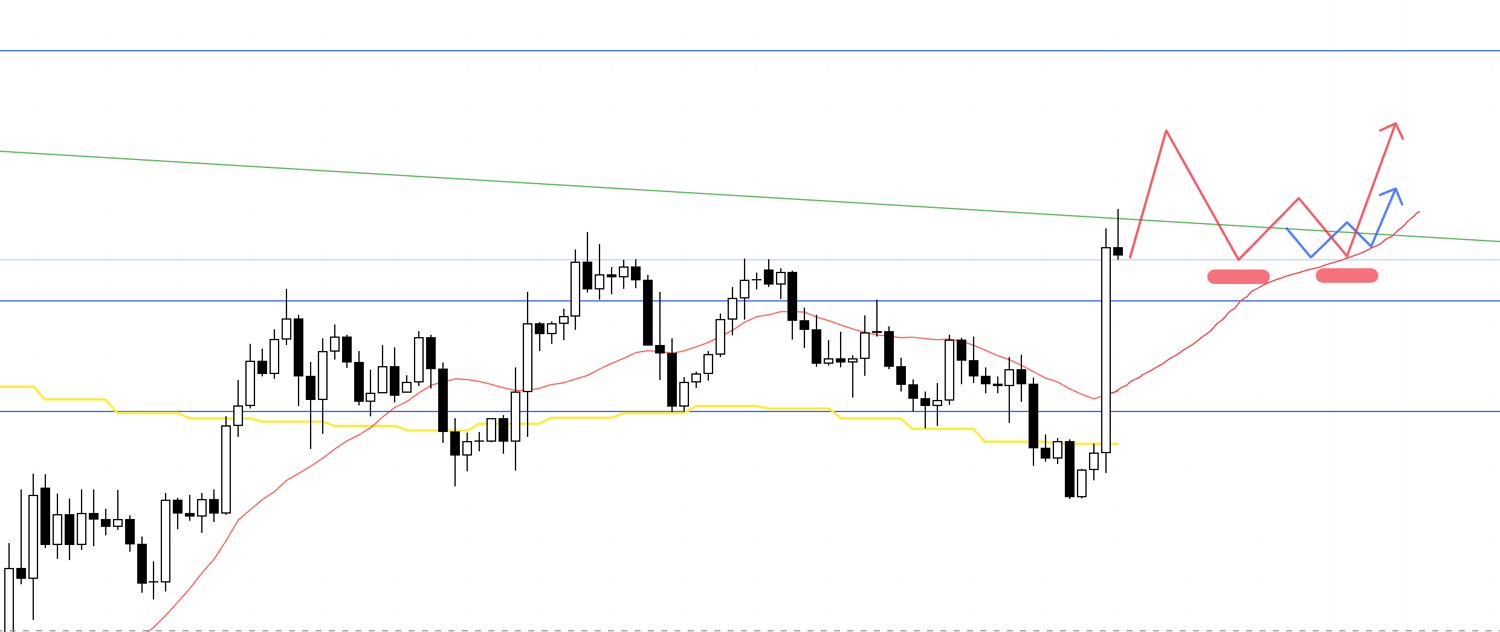
Now let’s consider where I might flip to a sell.
4H
If price fails to clear the weekly highs and breaks trend on the 4-hour, I would trade the daily pullback as the beginning of a 4-hour downtrend.
In that case, daily would still be framed as buy-the-dip, meaning lower prices attract stronger buying pressure.
Again, the key is whether entries appear with favorable risk-reward.
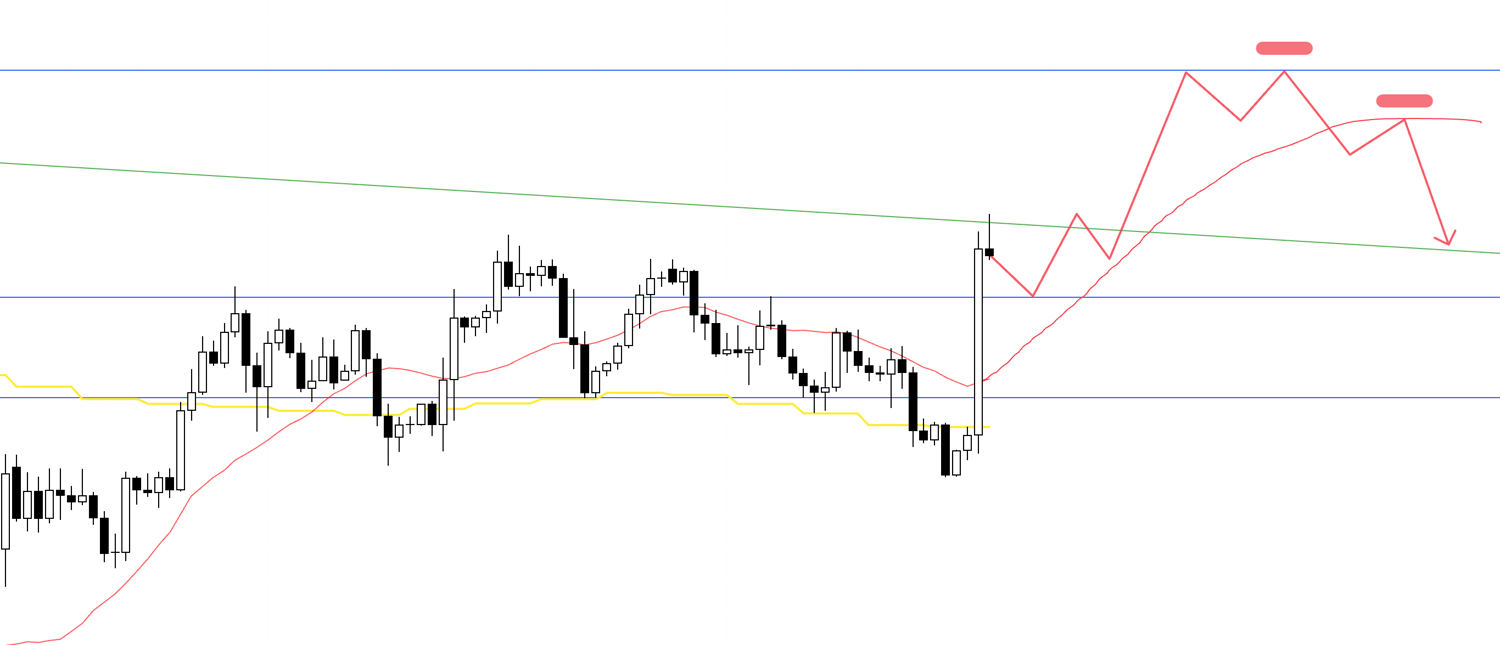
4H
Alternatively, if price continues to respect lower highs along the green trendline, another leg down could emerge.
But here, daily lacks clear direction and price is trapped between support and resistance.
Unless an exceptionally clean setup with strong risk-reward appears, I would not trade.
A safer short setup would be as follows:
4H
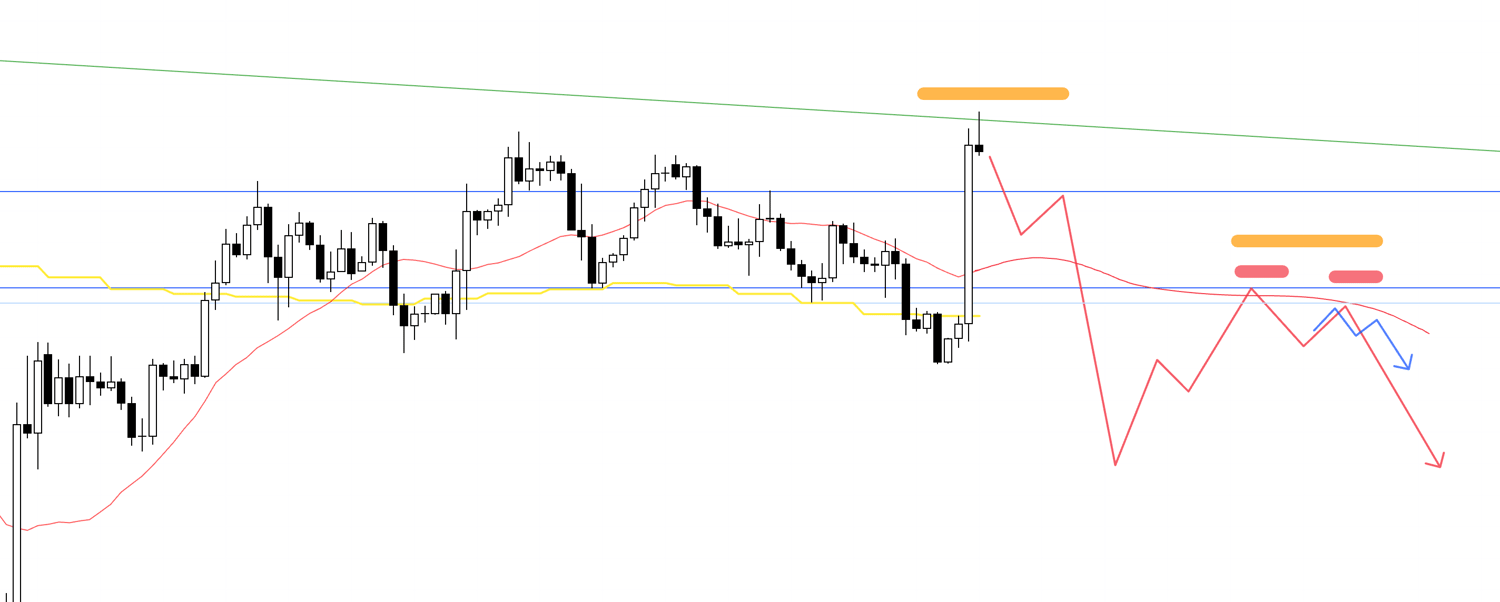
If the daily breaks prior lows, forms a new lower-high, and the 4-hour aligns with resistance at a clear line, the case for a daily downtrend strengthens.
In this case, I would look to short from the lower timeframe.
〜・〜・〜・〜・〜・〜・〜・〜・〜・〜・〜・〜・〜・〜・
That’s all for now.
These are only current scenarios.
As the week unfolds, I will update or rebuild them depending on actual price action.
As noted last week, both USDJPY and EURUSD remain difficult to trade.
But remember: it only feels “difficult” if you try to force trades.
The key is to wait patiently for clear opportunities.
By understanding when higher timeframes create conditions for concentrated order flow—and when fragmented flow creates risk—you gain the ability to wait for clean setups without stress.
I hope this provides some value.
This is purely my personal trading plan.
If you are still developing your own approach, perhaps it can serve as reference.
But if your trading is already established, do not be swayed by my plan—stick firmly to your own rules.
Thank you for reading to the end.