

Hello.
I’ll lay out my trading scenarios for the coming week.
I publish this “Trade Scenarios” blog every Sunday.
And every Saturday I post a “Weekly Trade Report” where I explain how I actually thought about the market and executed my trades during the week.
By reading this trading-scenario blog together with the Weekly Trade Report, I think you’ll be able to use my process as a practical reference for how to think ahead of time, what to wait for, and how to execute in a consistent way.
For the underlying strategy, please refer to my blog posts on Dow Theory and multi-timeframe analysis.
A “scenario” is not a forecast.
It is not a prediction, but my personal plan that says, “If the market does this, I will do that.”
I don’t try to predict the market, and this is not intended as such, so please keep that in mind.
Nor is this a set of instructions telling you what to buy or sell, or a service providing trading signals.
It does not guarantee any future profits; it is provided purely for educational purposes, using my own consistent process as the example.
I cannot take responsibility for any outcomes of the trades you place, so please trade at your own risk.
With that, let’s start with USDJPY.
(On my charts, the colors of the lines I draw represent each timeframe: orange for the daily, red for 4h, blue for 1h, and green for 15m.)
USDJPY
Daily

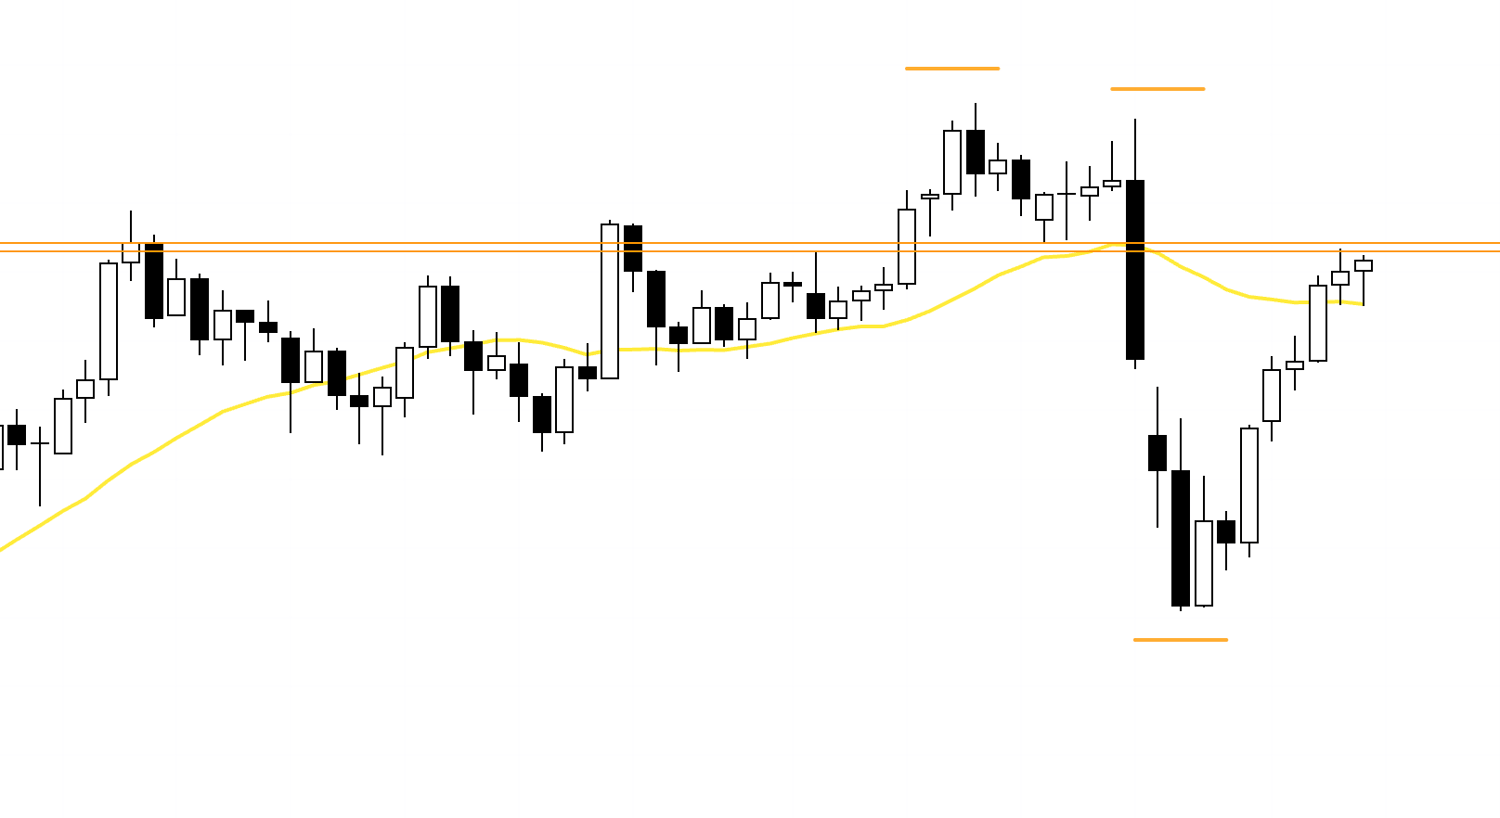
On the daily chart, price has printed a lower high followed by a lower low, confirming a shift into a downtrend, which means the current rally is merely a retracement within that broader decline.
The most recent high is being capped by a line drawn from the neckline of the previous double top and from prior highs before that.
This line is clearly being respected by the market, so I intend to watch how price behaves around it and make my decisions accordingly.
That said, since the daily trend remains bearish, it is difficult to consider buying unless price forms a higher-low structure significant enough to be recognized on the daily timeframe.
My base case is to look for short entries on daily-timeframe pullbacks.
4h
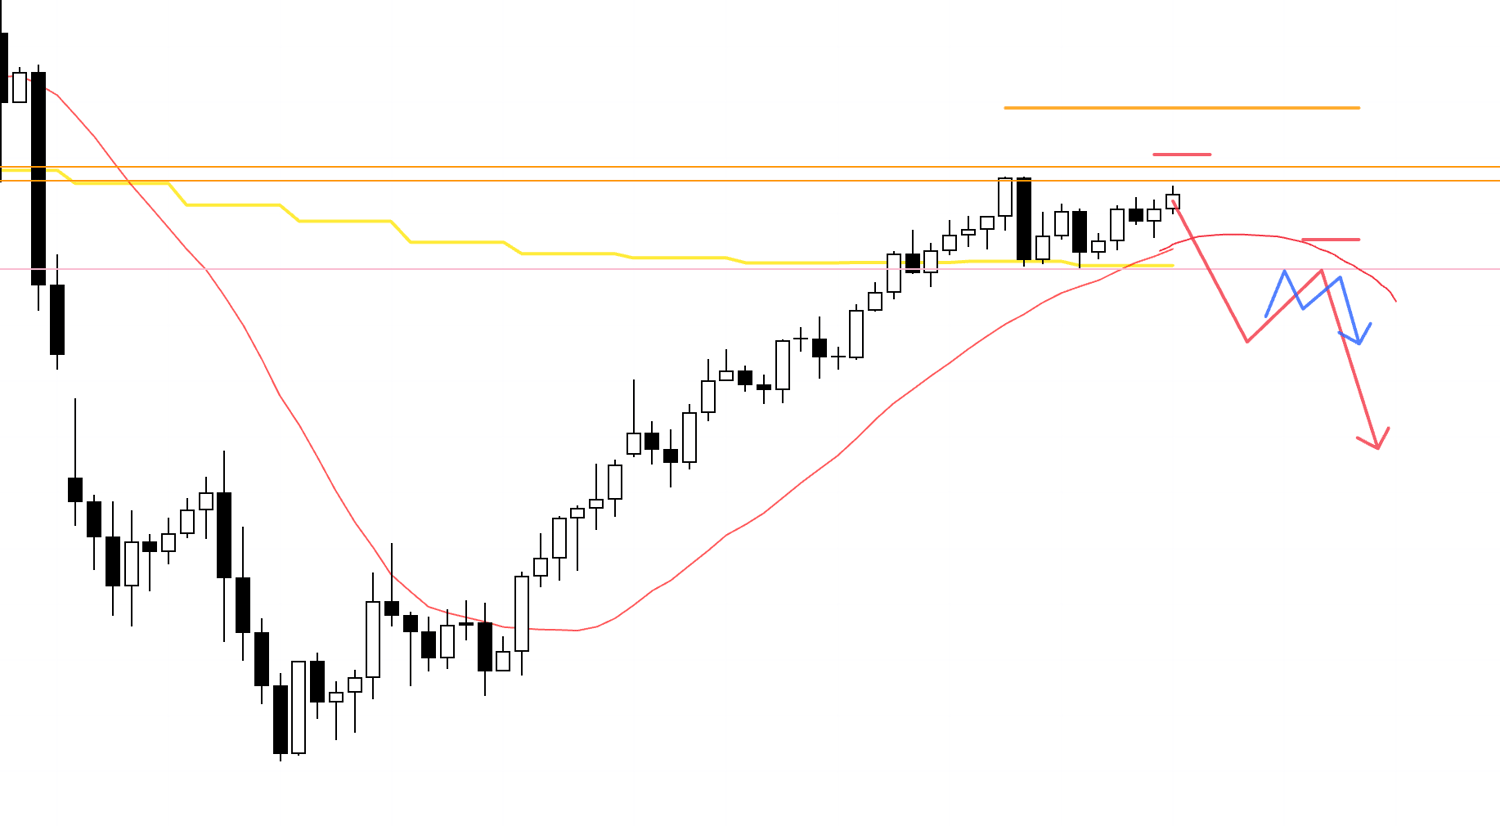
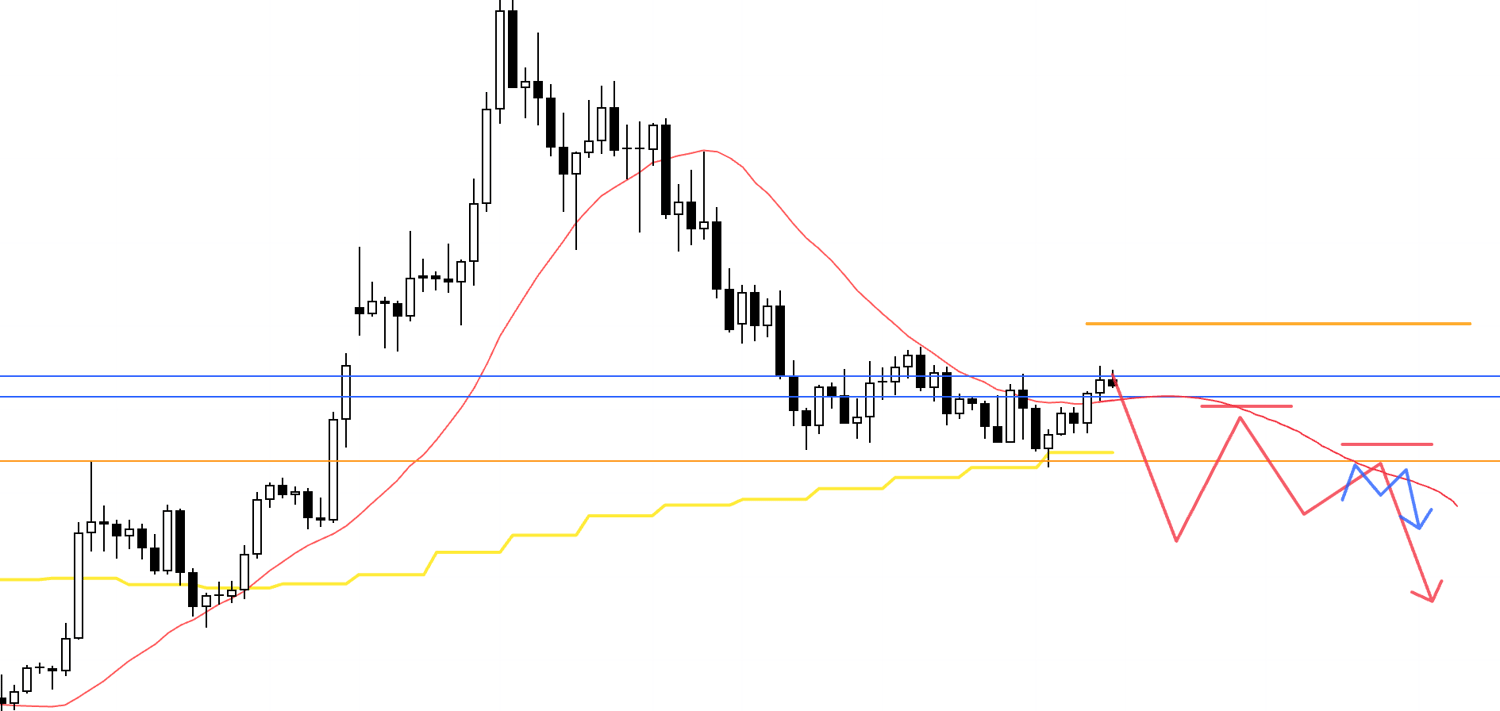
For example, if the 4h chart terminates the recent uptrend and initiates a new downtrend, that would be a point where selling pressure aligned with the daily pullback-short thesis is likely to kick in — making it a level where I would look to sell on the lower timeframes.
4h
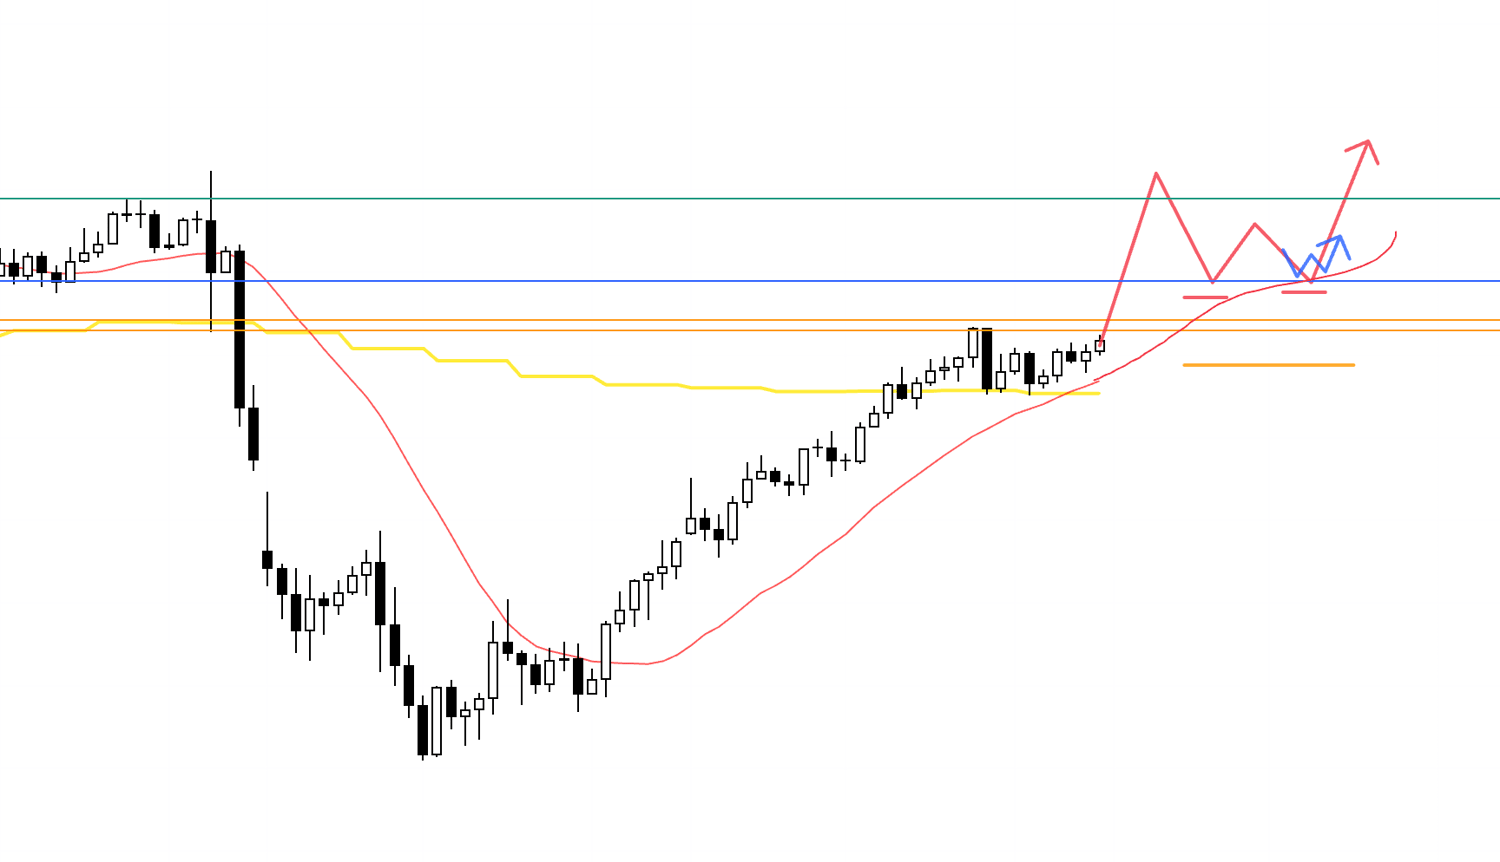
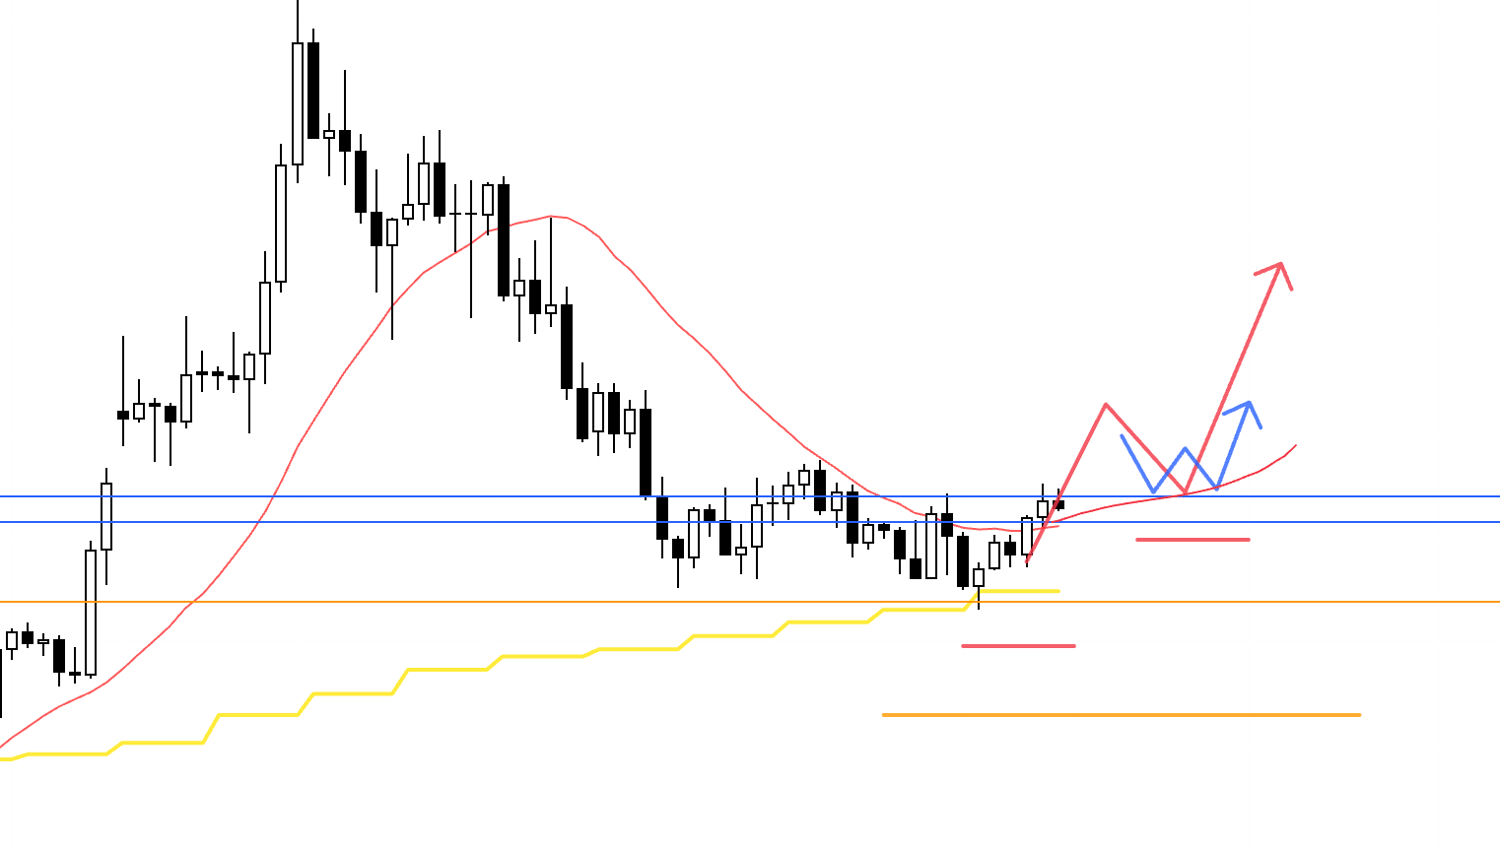
If I were to consider buying, it would only be after price breaks above the orange line and forms a higher-low structure recognizable on the daily chart.
However, just above the orange line sits the blue line, which is also likely to act as resistance, so caution is warranted.
If price forms a higher-low structure on the 4h around this blue line, a long could be considered — but the green line looms further above, and that too demands attention.
Ultimately, whether or not to take the trade comes down to whether an entry point presents itself with an acceptable risk-reward profile.
There are numerous resistance lines clustered in this price zone, so extra care is needed when considering longs.
Now, let's move on to EURUSD.
EURUSD
Daily
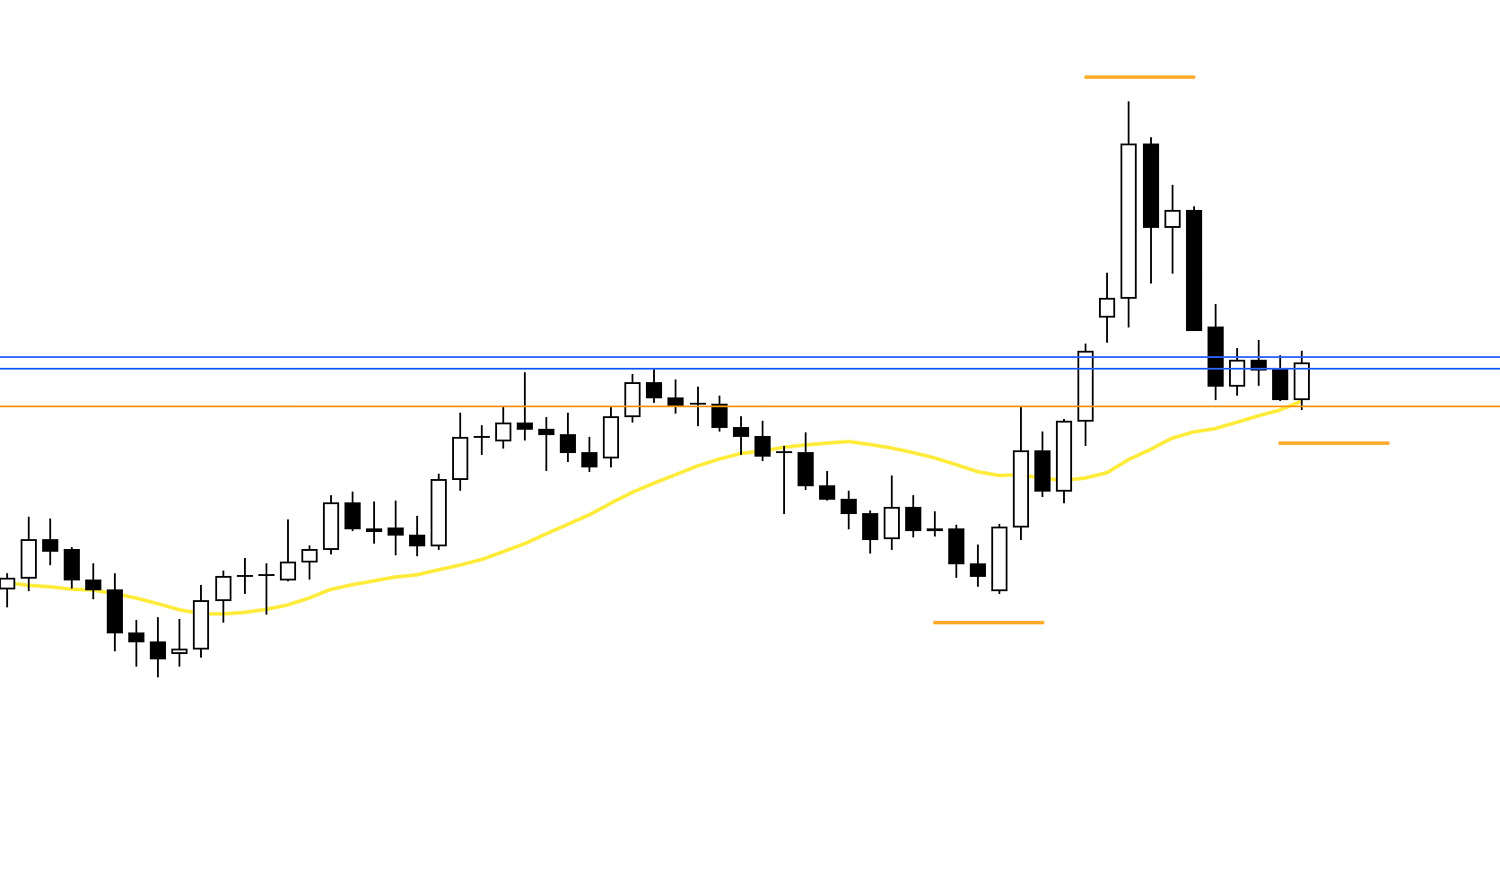
EURUSD has shifted into an uptrend after taking out the most recent high and is currently sitting in a buy-the-dip zone.
However, price remains below the previous high (blue line), indicating that bullish and bearish forces are in a standoff at current levels.
I would prefer to wait for one side to gain a decisive edge and then position accordingly.
4h
The most favorable buying scenario would be if the 4h chart forms a higher-low structure with price being supported around the blue line.
In that case, I would look to buy on the lower timeframes at the low that terminates the preceding downtrend and marks the origin of a new uptrend.
This would also be a point where daily-timeframe dip-buying interest is likely to step in, making it an ideal setup.
4h
As things stand, price is being supported by the daily moving average (yellow) and the orange line, which makes it difficult to sell right away.
If price first breaks below these levels and then forms a lower-high structure on the 4h — with the moving average and the orange line acting as resistance from above — I would look to sell on the lower timeframes.
That's all for today.
Every chart is unique, yet what I do is exactly the same every time.
It is precisely because my decision criteria remain constant that the law of large numbers works in favor of that consistent behavior.
The real question is whether that consistent behavior carries an edge — and to what extent you have tested it, practiced it, and built genuine conviction around it.
Between "knowing" something and actually executing it with unwavering consistency, there is an enormous gap.
No amount of intellectual understanding can substitute for exhaustive testing and practice.
Whether you have truly done that preparation is something the market will always test.
Once the preparation that truly matters is complete, trading transforms into something remarkably simple and calm.
I hope you find some of this useful.
These are scenarios as of this moment; once the week begins and price action unfolds, I plan to update and rebuild these scenarios in real time as conditions evolve.
This trade plan is strictly my own.
If you are still in the process of developing your trading approach, I hope it serves as a useful reference for building your own strategy.
But if you already have a well-established method, please do not let my plan distract you — stick to your own rules.
Thank you for reading to the end.