

In order for us to profit in trading, we need two things: a "time difference" and "other participants".
This is a fundamental principle of the market and it does not change.
In other words, repeating trades at an advantageous point can be rephrased as "repeating trades at a point where it is expected that many people will 'buy after' the point where you bought".
In this blog post, I will explain the importance of trading where orders concentrate and where orders cascade, and how I actually apply those concepts in my trading.
There are many different strategies, so I’m not claiming this is the absolute right answer, but I hope it can serve as one example of how I think and translate that into a strategy.
〜・〜・〜・〜・〜・〜・〜・〜・〜・〜・〜・〜・〜・〜・
◆It is too late to take a position after the uptrend is already clearly visible
In a situation where the rise is recognizable to everyone and many people are trying to participate, excellent traders already have their positions and are gauging the timing for their next exit.
The point where I trade is a place where many traders will place orders after my entry, and by the time many participants are thinking of joining, I am already thinking about the timing of my profit-taking.
For this purpose, I grasp the market on multiple timeframes and use Dow Theory to identify the points where orders will cascade from a trend reversal on a lower timeframe up to a higher timeframe, and I continue to repeat my actions at those points.
(For details on Dow Theory and multi-timeframe analysis, please read my previous blog posts.)
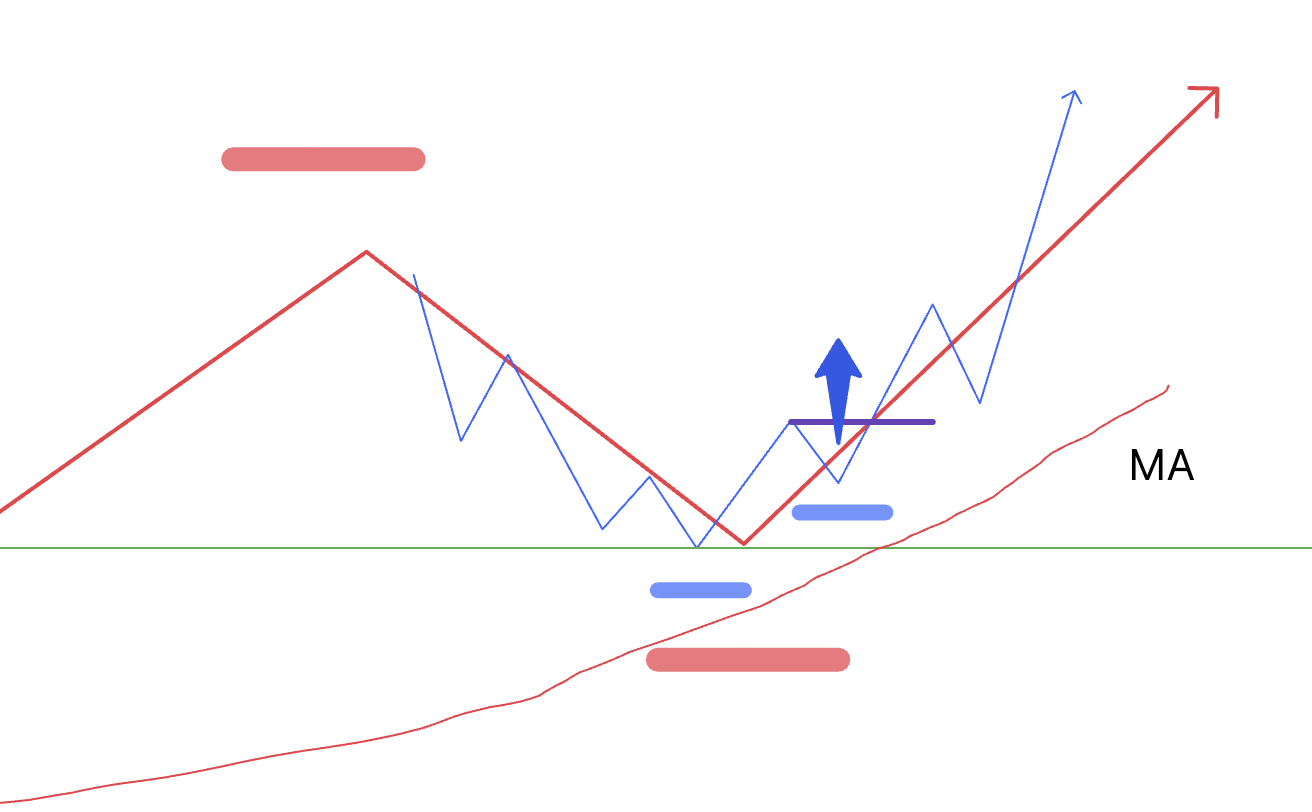
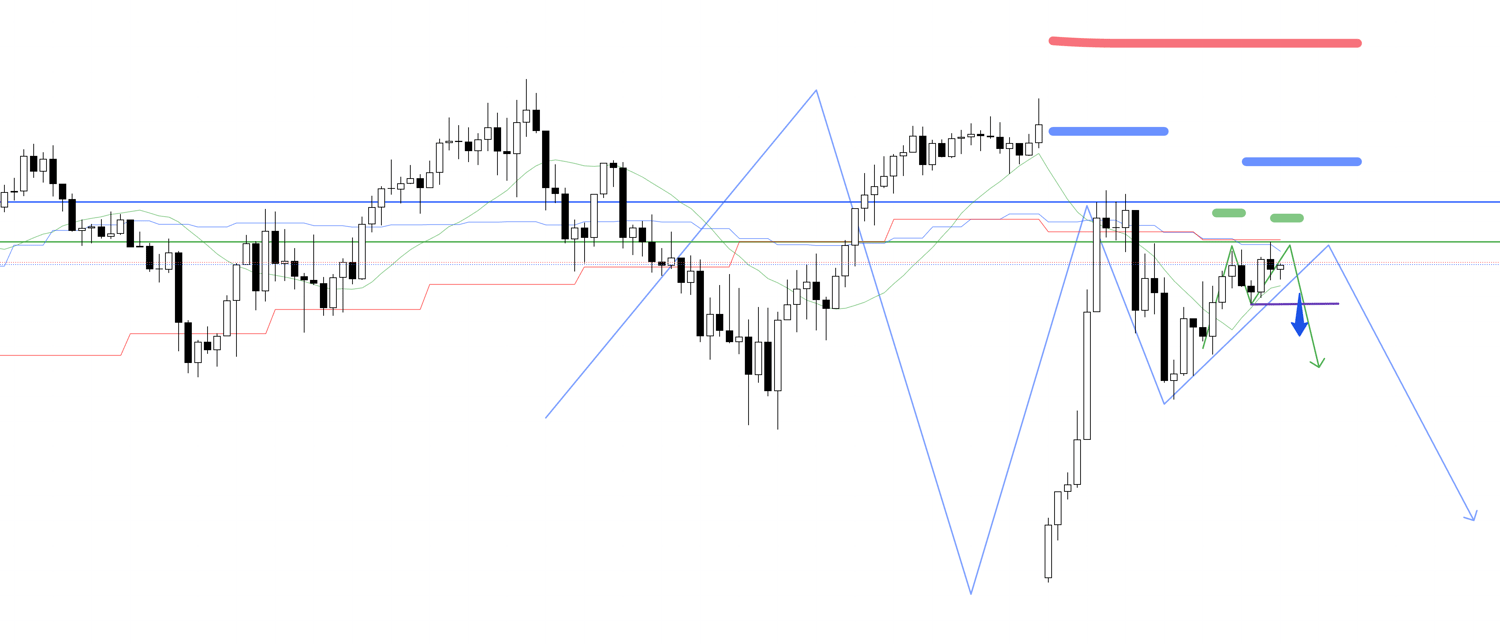
The points where I trade are simply illustrated below.

In this way, for a pullback on the higher timeframe shown in red, I gauge the entry timing on the lower timeframe drawn in blue.
The point where the price breaks above the line indicated in purple is the point where the lower timeframe makes a trend reversal.
This becomes the first point of an uptrend reversal—from a downtrend of making new lows and lower highs to an uptrend of making a new high and a higher low—on the lower timeframe until then.
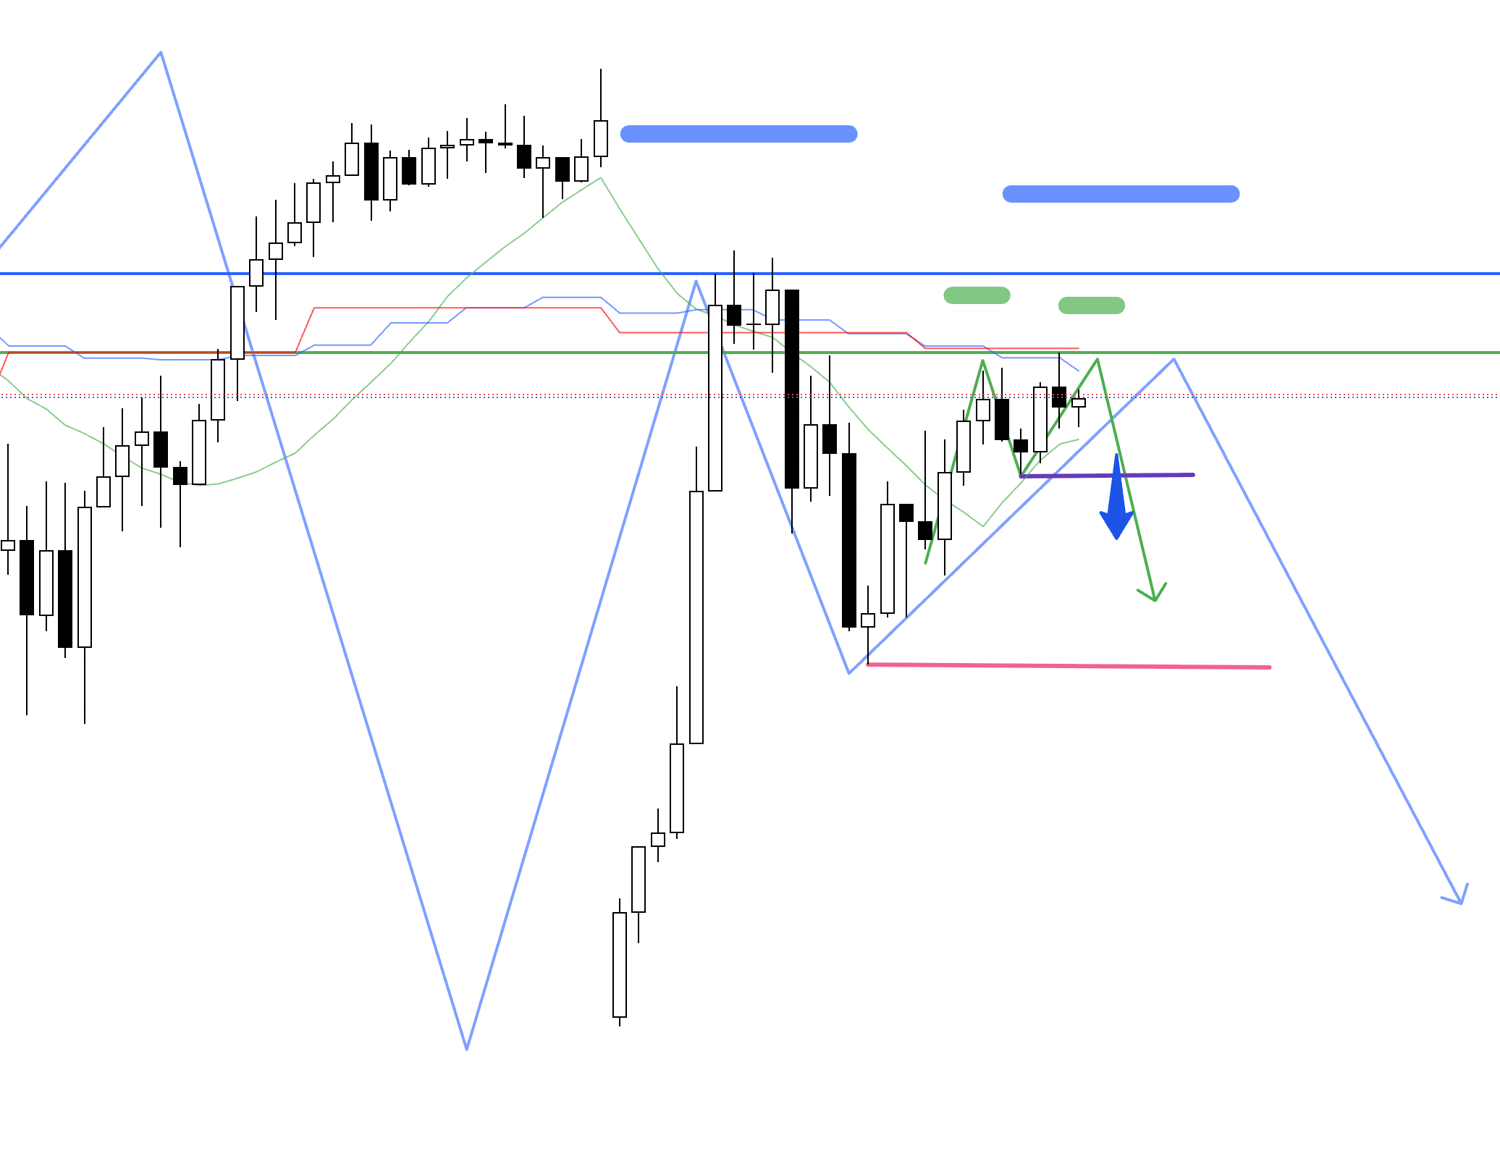
The points that confirm an uptrend reversal or continuation on the higher timeframe are the points below.
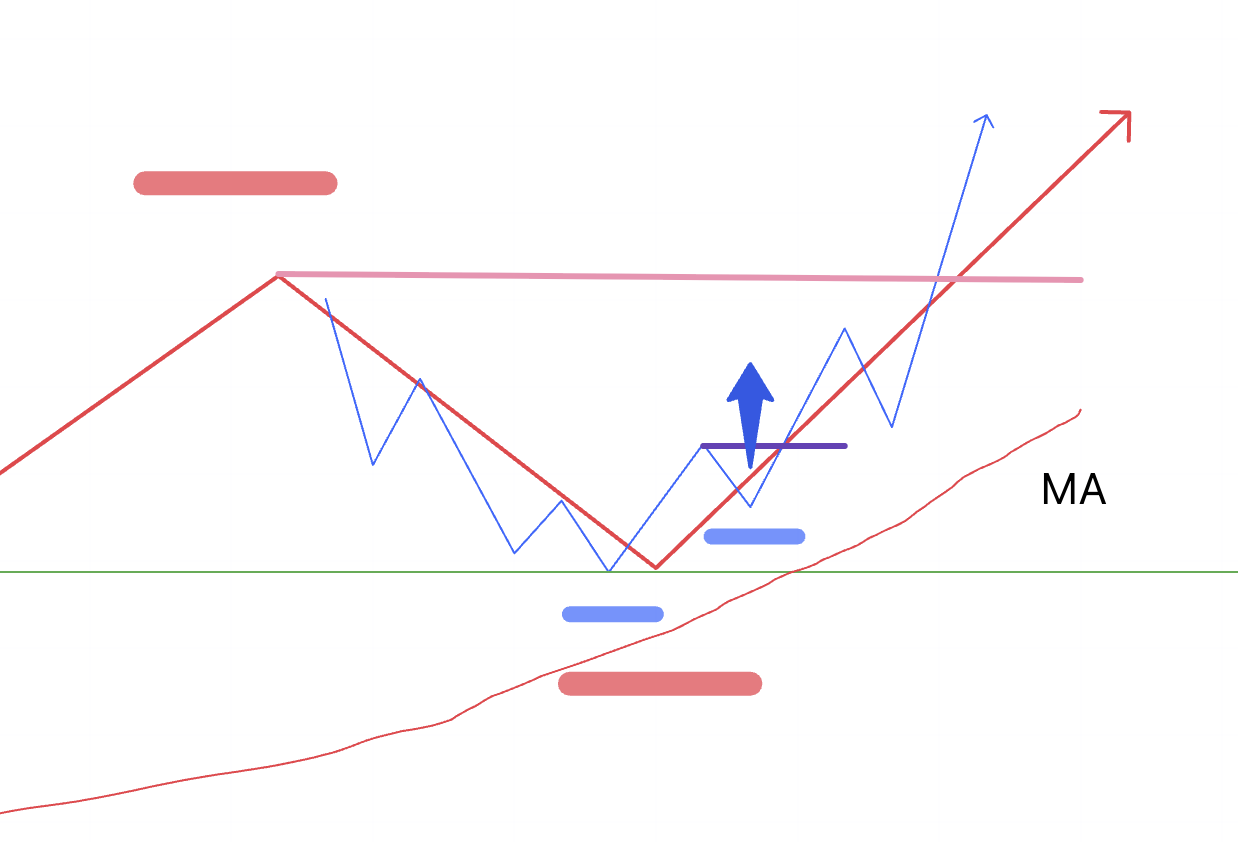
I have drawn the point that confirms a new high on the higher timeframe with a pink line.
By breaking this pink point, the higher low is "confirmed", which in turn confirms the trend reversal or the continuation of the uptrend on the higher timeframe.
A trend begins on the lower timeframe, and then, by breaking the high on the higher timeframe, the trend reversal or continuation is confirmed on the higher timeframe as well.
Of course, the uptrend on the lower timeframe may sometimes be pushed back without breaking the high on the higher timeframe, and short-term results are affected by randomness, but if that rise does cascade to the higher timeframe, it becomes possible to "trade the rise on the higher timeframe with the stop-loss width of the lower timeframe", allowing for trades with a very good risk-reward.
After entering on the lower timeframe, as the price rises and makes a new high on the higher timeframe, it becomes possible to trigger new orders and stop-loss orders from the higher timeframe.
Now, let's look at one of my actual trades.
Please see the chart below.
4h chart
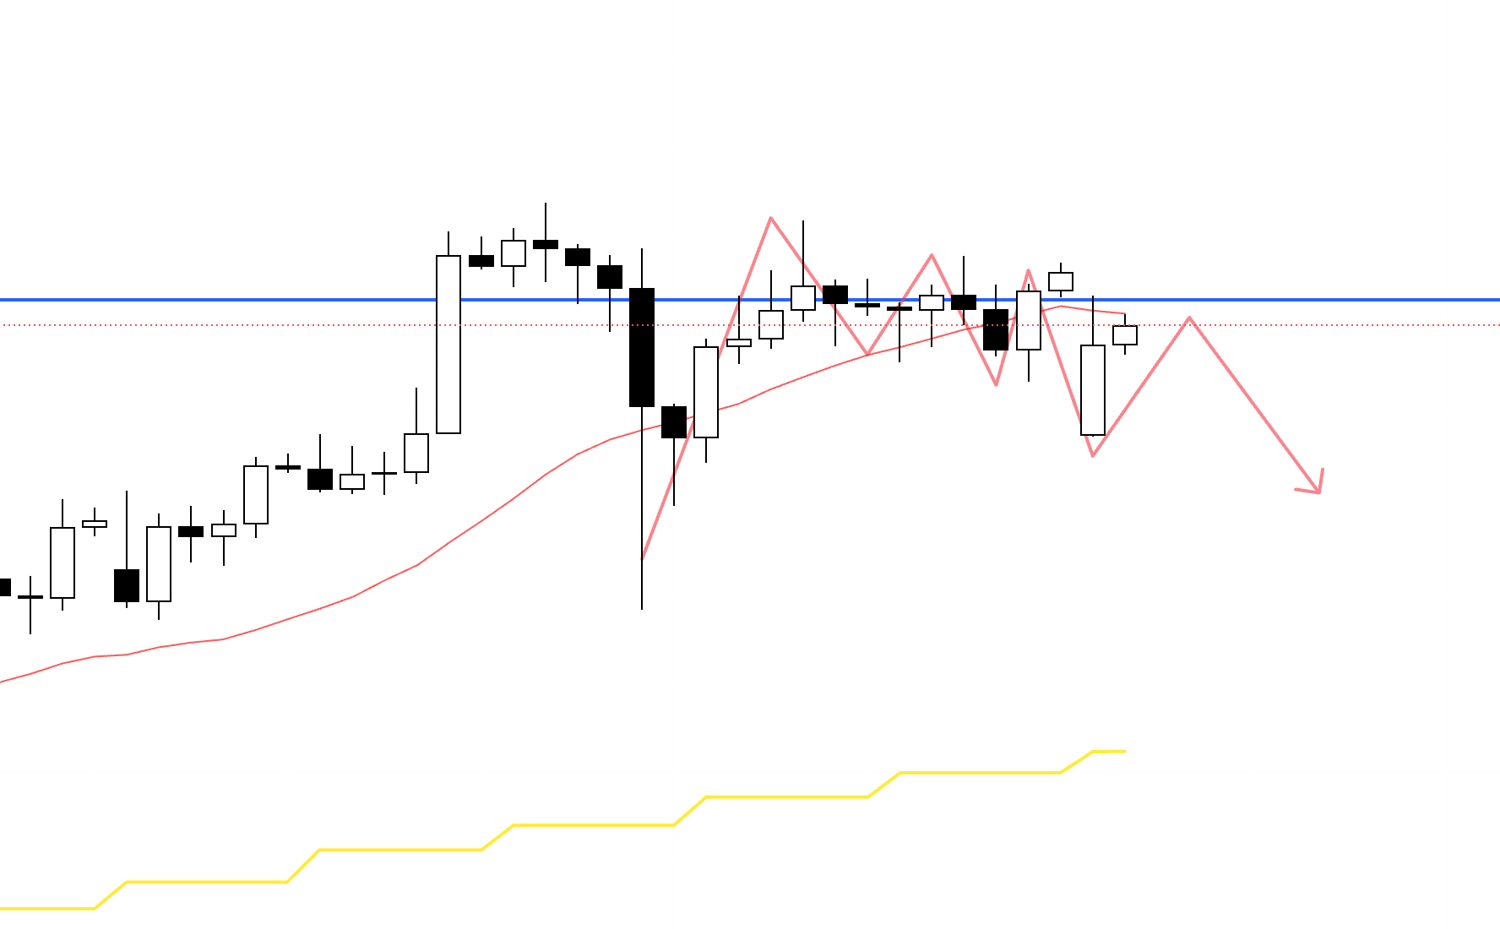
This is a recent sell trade I took on USDJPY.
This is the 4h chart before entry, at a point making a lower high.
Let's look at this on a still lower timeframe, the 1h chart.
1h chart
The 1h chart is also trying to create a point of a lower high.
If I were to enter on a break of this low, I would be trading the wave on the 1h chart.
I made an entry one step earlier on an even lower timeframe.
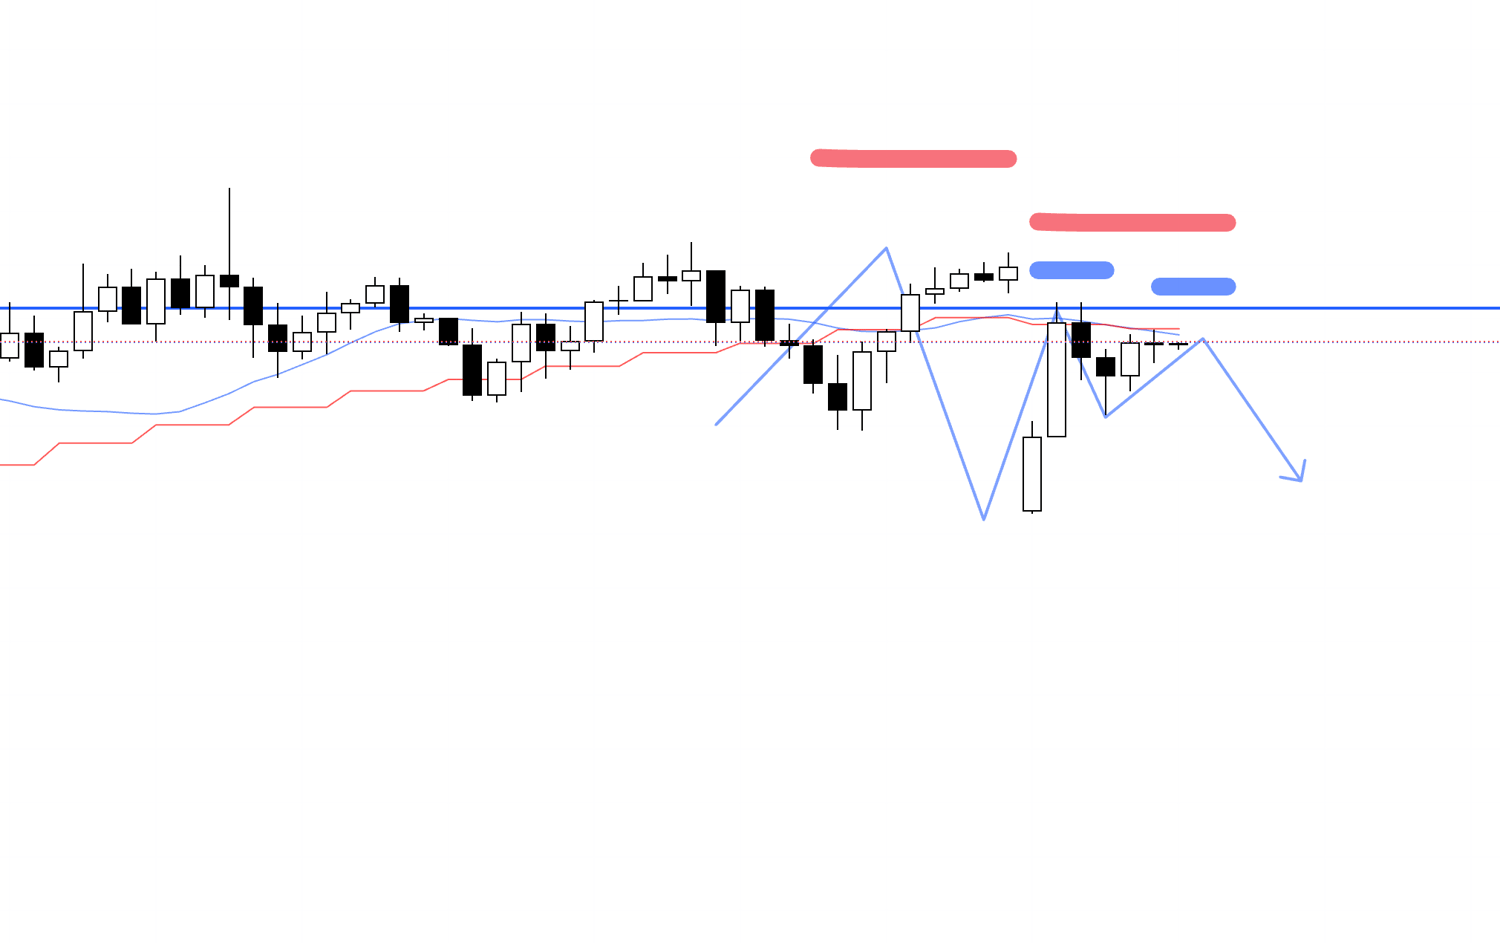
15m chart
This is the 15m chart, and within the point of the 1h lower high, the 15m was preemptively forming a double top and trying to make a new low, and that point became my entry point.
On the 15m chart, this is the first point that ends the recent small uptrend and reverses into a downtrend.
If the price falls after this entry and proceeds to make a new low on the 1h chart, the probability increases that traders who trade on the 1h will place sell orders, triggering orders from traders on higher timeframes.
15m chart
The low indicated in pink is the 1h low, and breaking this confirms a new low and a lower high on the 1h chart.
I mentioned earlier that if I were to trade on this break of the low, I would be trading on the 1h, and for traders who trade on the 1h, breaking this low confirms a lower high on the 1h, making it easier for new sell orders to come in.
This does not mean that only new sell orders increase.
If the price breaks this low and fails to make a new high, traders who held buy positions until then will be forced to take a stop-loss, and the stop-loss orders from traders with buy positions = sell orders, so in addition to new sell orders, it is highly likely that the price will fall while triggering many sell orders, such as sell-side stop-loss orders.
This means it is a "point where there is a basis to believe sell orders will exceed buy orders".
Then, if it further makes a new low on the 4h chart, it will confirm a new low and a lower high on the 4h.
In this way, it becomes possible to trade at points where, after your own entry, you trigger and cascade orders from traders on various timeframes.
Regarding this actual trade, I will explain the flow from entry to exit in detail in this Saturday's "Weekly Trade Report".
〜・〜・〜・〜・〜・〜・〜・〜・〜・〜・〜・〜・〜・〜・
That is all for this time.
Charts have this "fractal structure", and by being able to read through multi-timeframe analysis which traders on which timeframes are watching "which highs and lows", where they set their stop losses, where they move their trailing stops, and where they will place new orders, it becomes possible to conduct high-edge trades that utilize the fundamental principles of profiting in trading: the "time difference" and "other participants".
The footprints of traders who already hold positions are visible as the chart, their objective is also to make a profit, and to realize a profit, they must close their positions.
On the other hand, to enter newly, one must take a position.
These are laws from which no one can escape, and that is precisely why it is extremely important to consider at which highs and lows these actions will be concentrated.
Therefore, I am not simply looking at chart patterns, but am repeating trades that follow fundamental principles while considering the rationale behind these charts.
There are always other people behind the chart, and as long as the objective of all participants is to "make a profit", trading that follows fundamental principles, logical trading, will not become obsolete.
Countless strategies exist in trading, and there is no single right answer, but I hope the ideas introduced in this blog post can be a hint for building your own strategy.