

Technical analysis is the act of identifying the concentration of orders on a chart.
In this blog post, I will explain what it means to "buy low".
I previously wrote a blog post about Dow Theory and multi-timeframe analysis.
I use these to identify where and what kind of orders are being placed, and I make it a point to trade at points where more orders are concentrated.
If you haven't read that post yet, please read it first to understand Dow Theory and multi-timeframe analysis before reading this one.
When you learn this kind of technical analysis, it's easy to get caught up in only the shapes on the chart, but what's more important is to fully understand "where and what kind of orders are placed, and why you are trading there," and to trade while "always considering that background".
In this blog post, I will explain that background and further your understanding of the logical basis for your trading points.
〜・〜・〜・〜・〜・〜・〜・〜・〜・〜・〜・〜・〜・〜・
First, the fundamental principle for making a profit in the market is to "buy low and sell high".
It may sound obvious, but to make a profit, you need two things: a "time difference" and "people who will buy after you".
This is a fundamental principle of the market; it doesn't matter if humans are trading, algorithms are trading, or who is trading, and it is a fundamental principle for making a profit in the market that will absolutely never change in the future.
This means what's crucial is being able to enter at a point that "you define as a low price" and "where other people's orders will come in later".
I simply watch carefully for "making a higher high and a higher low" and "making a lower low and a lower high" according to Dow Theory.
What's important is how you refine this simple basic principle until you can use it in practice.
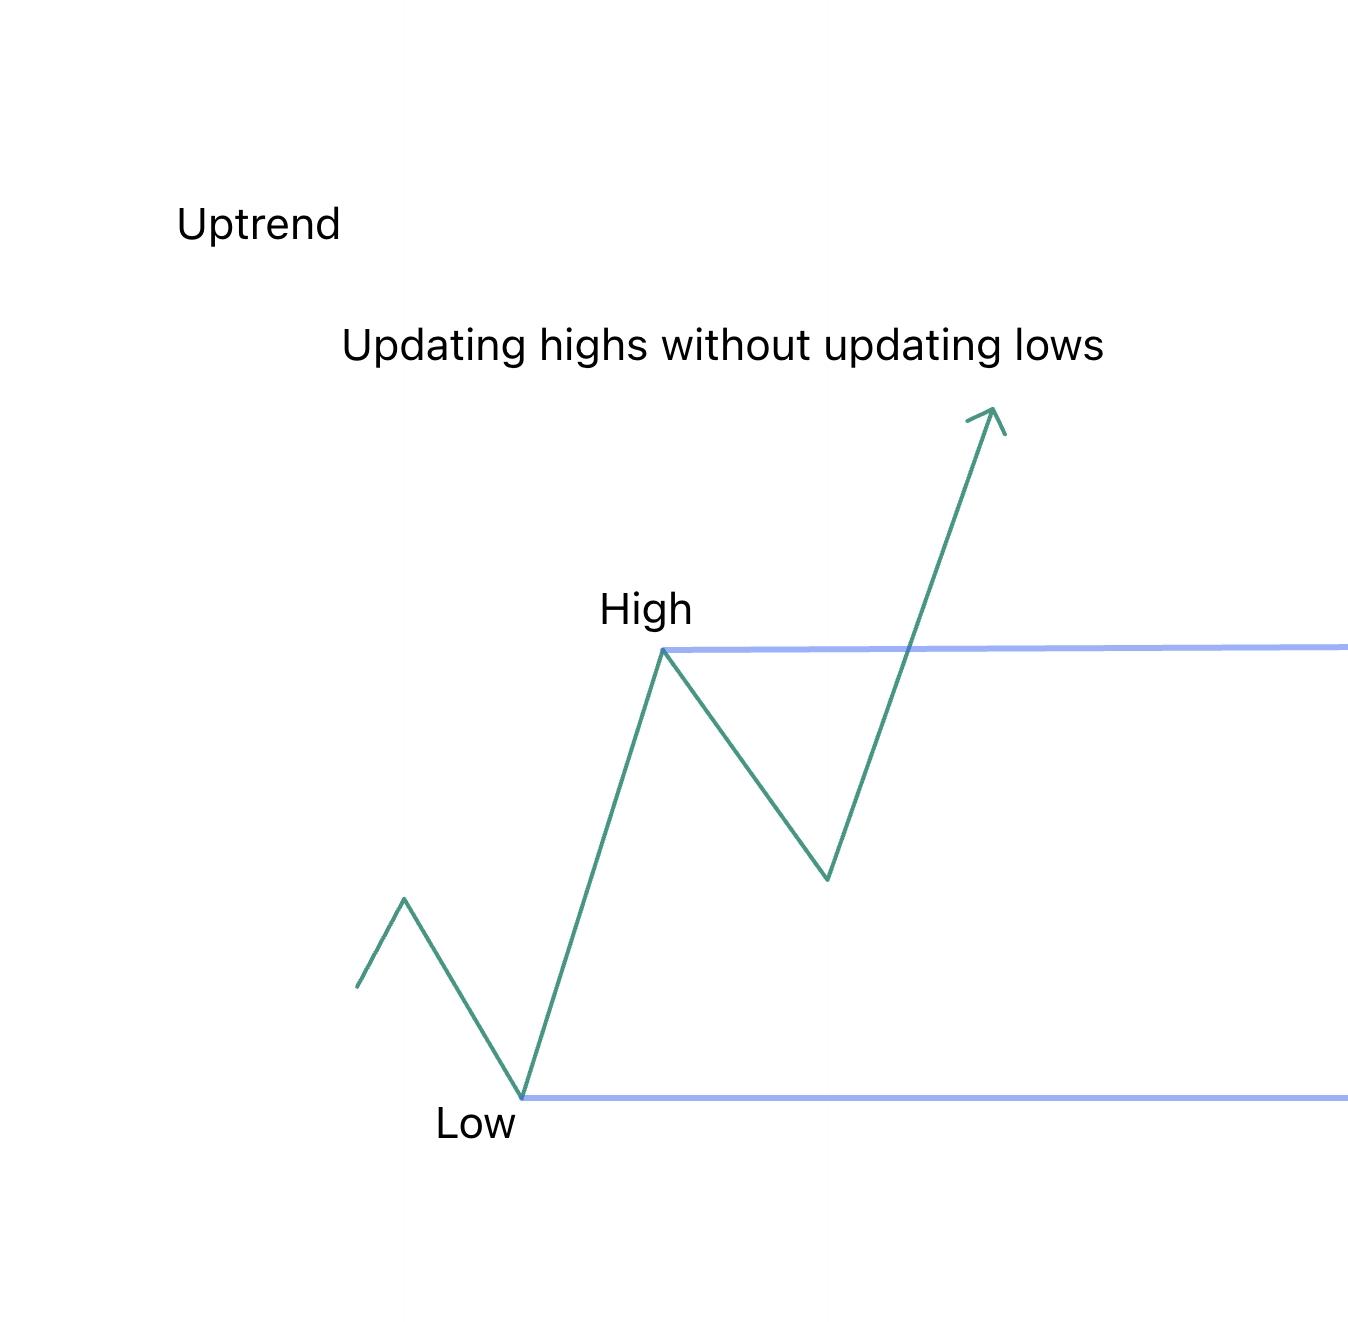
This shows that by making a higher high and a higher low, it failed to make a lower low, which means that at that point, the demand from traders who "want to buy even if it's high" is increasing.
Now, please take a look below.
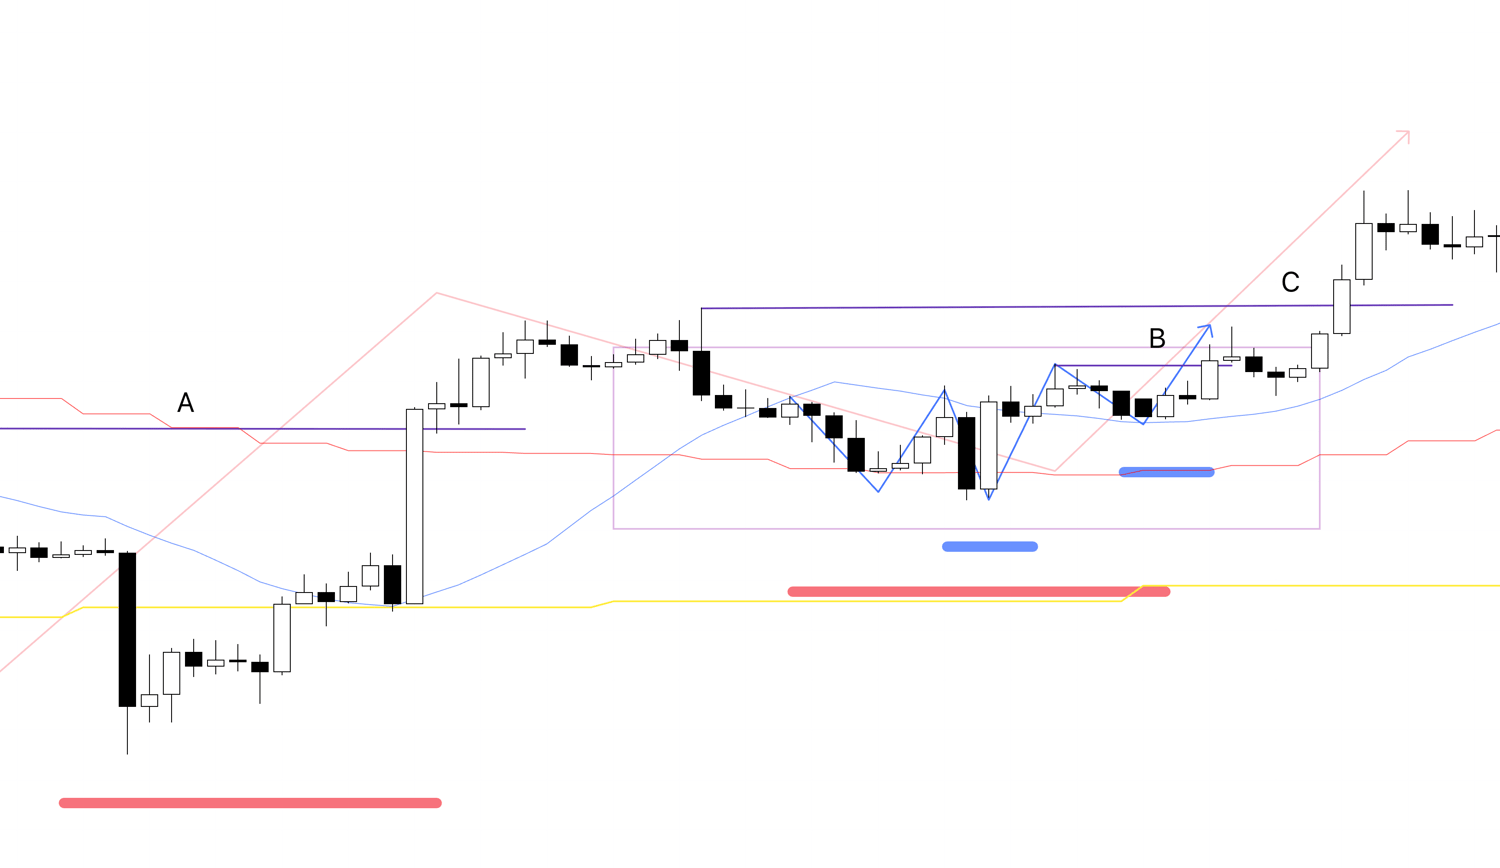
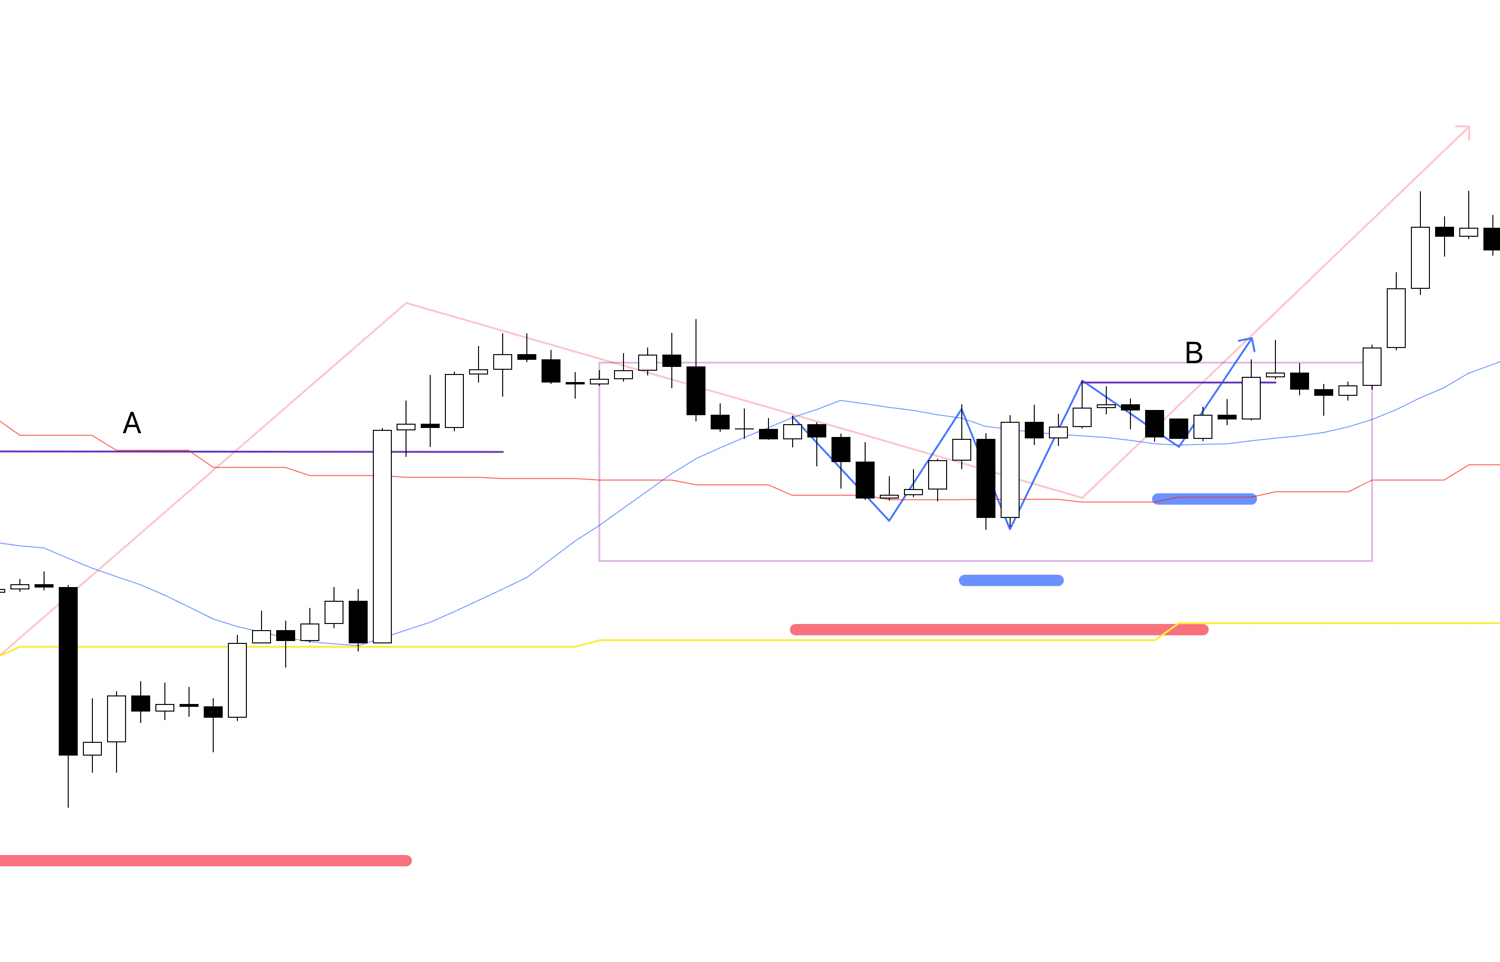
4h Chart
For example, let's say the chart has been making lower lows and lower highs, as seen on the left side of this chart.
At this time, many selling traders are profiting from their short positions, but when the price breaks above point A, the last high that was made, it ends the series of lower highs, signifying that the downtrend has ended.
At this point, buy orders are concentrated, including trailing stops from traders with unrealized profits from their short positions, and stop-loss orders from traders who entered short late (a selling trader's stop-loss order = a buy order). When this point is broken, the buying force becomes greater than the selling force.
When this happens, skilled traders, along with the end of the downtrend, begin to prepare for the initial move of an uptrend.
At this stage, you need to wait for the decline to stop in order to buy at the next "low price". (The area enclosed in the square)
If, at that low price, you then see a higher high and a higher low, it is the first pullback of a potential uptrend and becomes the first low point.
We were looking at the 4h chart, but let's look at a lower timeframe, the 1h chart.
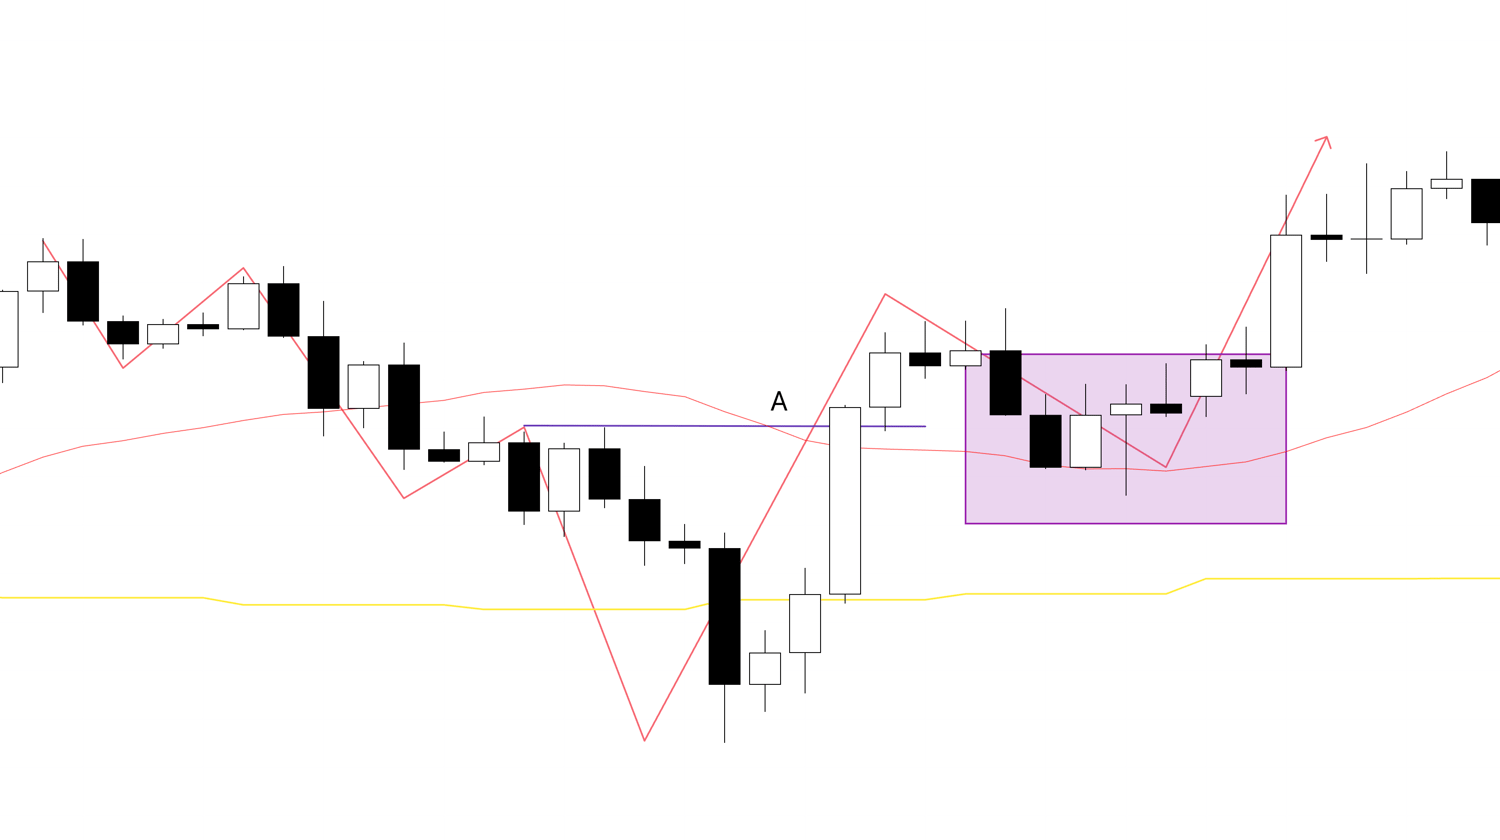
1h Chart
This is the 1h chart view of the decline after point A was broken.
Looking at it this way, the 1h chart is making lower lows and lower highs.
However, I do not trade this downtrend.
As we saw on the 4h chart earlier, the 4h chart has just ended its downtrend, and now the number of traders who "want to buy when it gets low" is increasing.
In other words, this downtrend on the 1h chart is a decline where "the lower it goes, the more buying pressure increases".
The point where this 1h chart's downtrend ends is the "lowest point" to enter on the 4h chart's pullback.
The first point that ends the downtrend on the 1h chart and confirms a new uptrend is as follows.
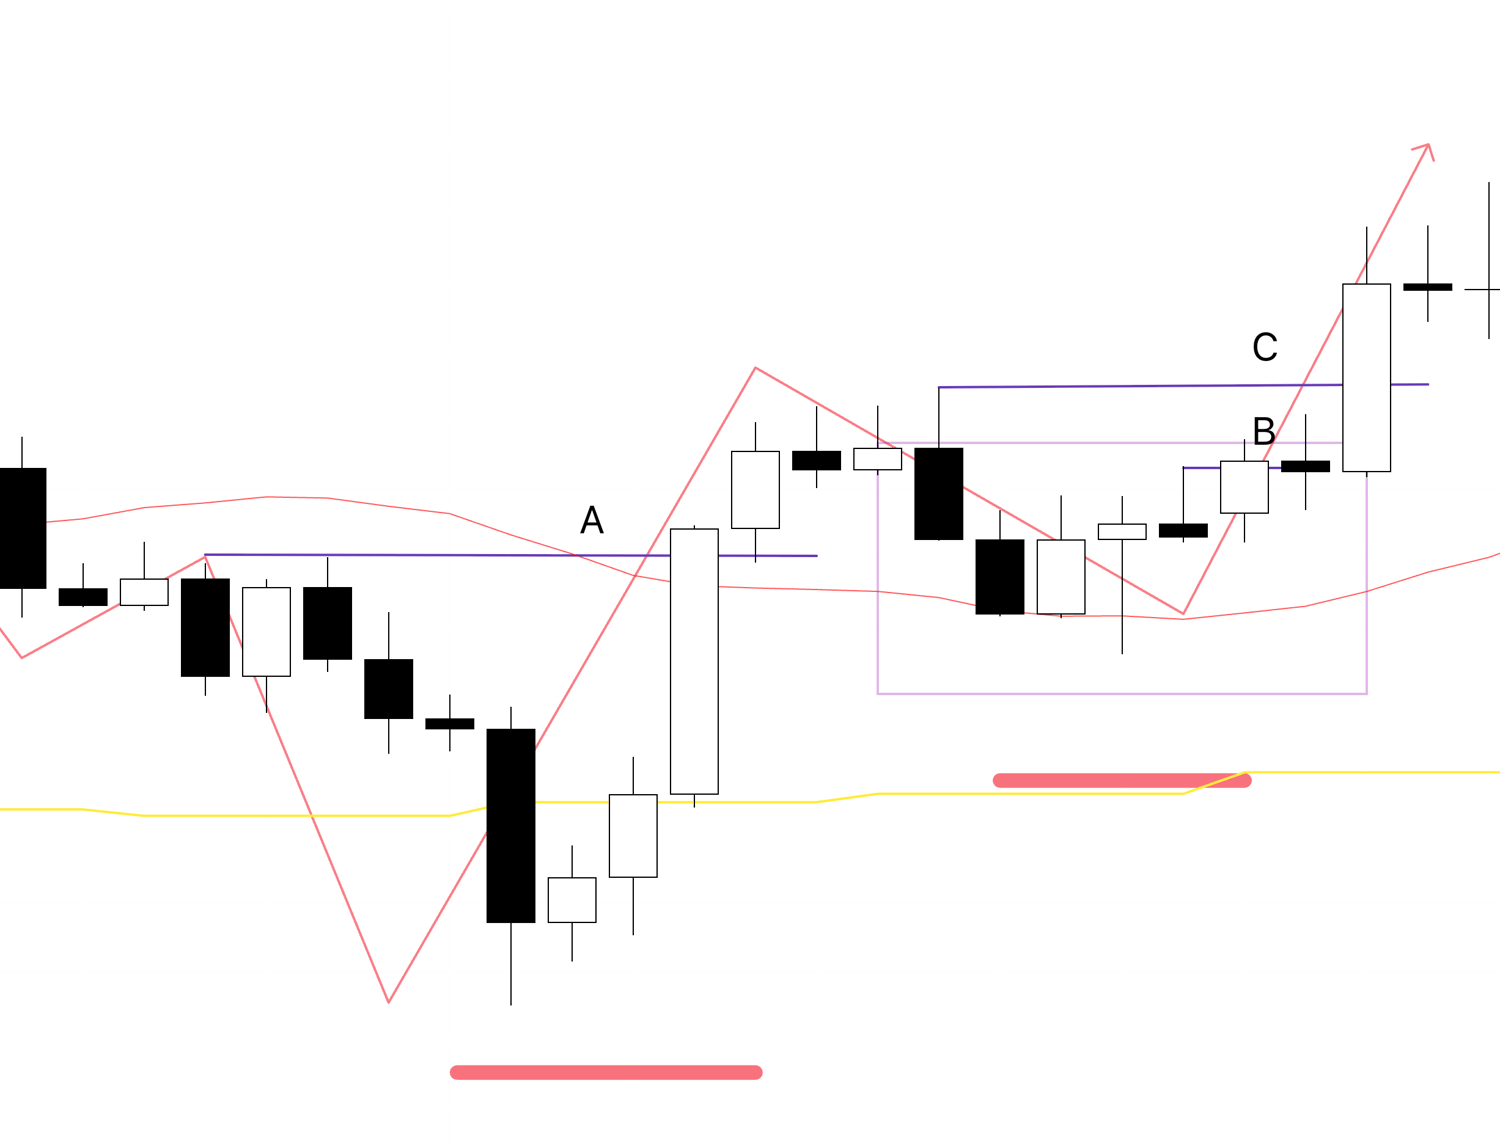
1h Chart
On the 1h chart, after the previous downtrend has ended, Point B is the subsequent point where breaking above it makes a new higher high and "confirms" the higher low.
This becomes the "lowest point" on the 1h chart after the trend reversal to an uptrend.
Some traders may see this as "buying at a high point" because it's breaking a high, but that's because they are only looking at the chart on a single timeframe; if you can grasp the market in multi-timeframe, you can understand that this is the low point where the "turn to an uptrend" begins.
1h Chart

After that, when the price breaks above point C, it will then make a higher high and confirm a higher low on the 4h chart, marking the first rise that begins the 4h chart's trend.
Let's look at this on the 4h chart as well.
4h Chart
As you can see on the 4h chart, by breaking above point C, it makes a higher high and confirms the higher low.
Furthermore, since you were able to enter one step earlier on the 1h chart, you can aim for the 4h chart's rise with a 1h chart's stop-loss size, leading to a trade with a good risk/reward ratio.
And because traders on multiple timeframes are looking in the same direction, the price can rise while sweeping up even more buy orders.
If you were to only look at a single timeframe, you might think a trend is occurring when you are actually going against the trend.
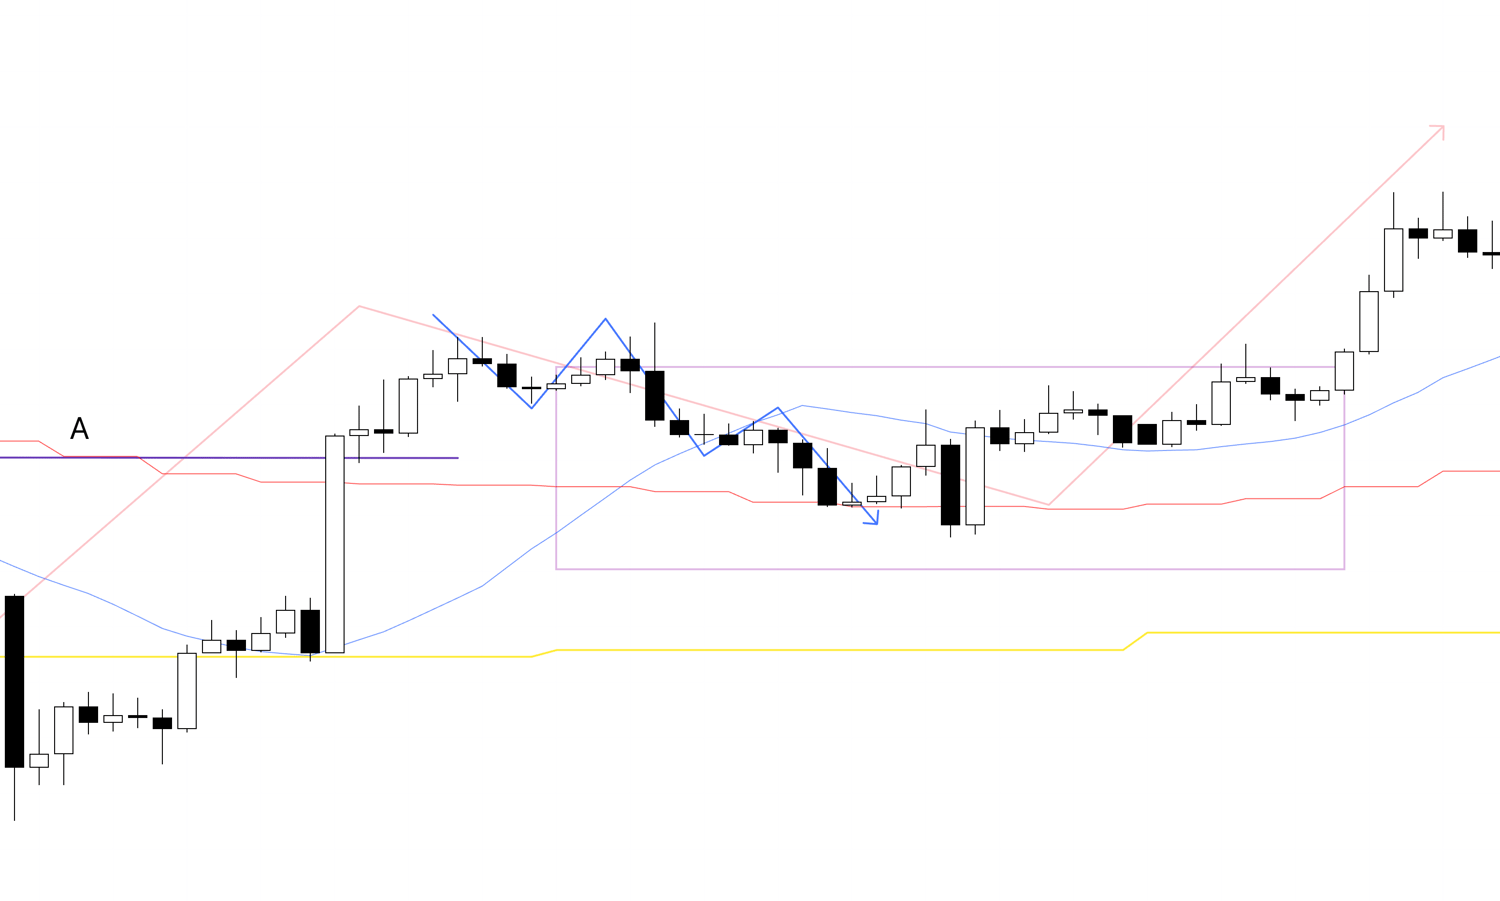
1h Chart
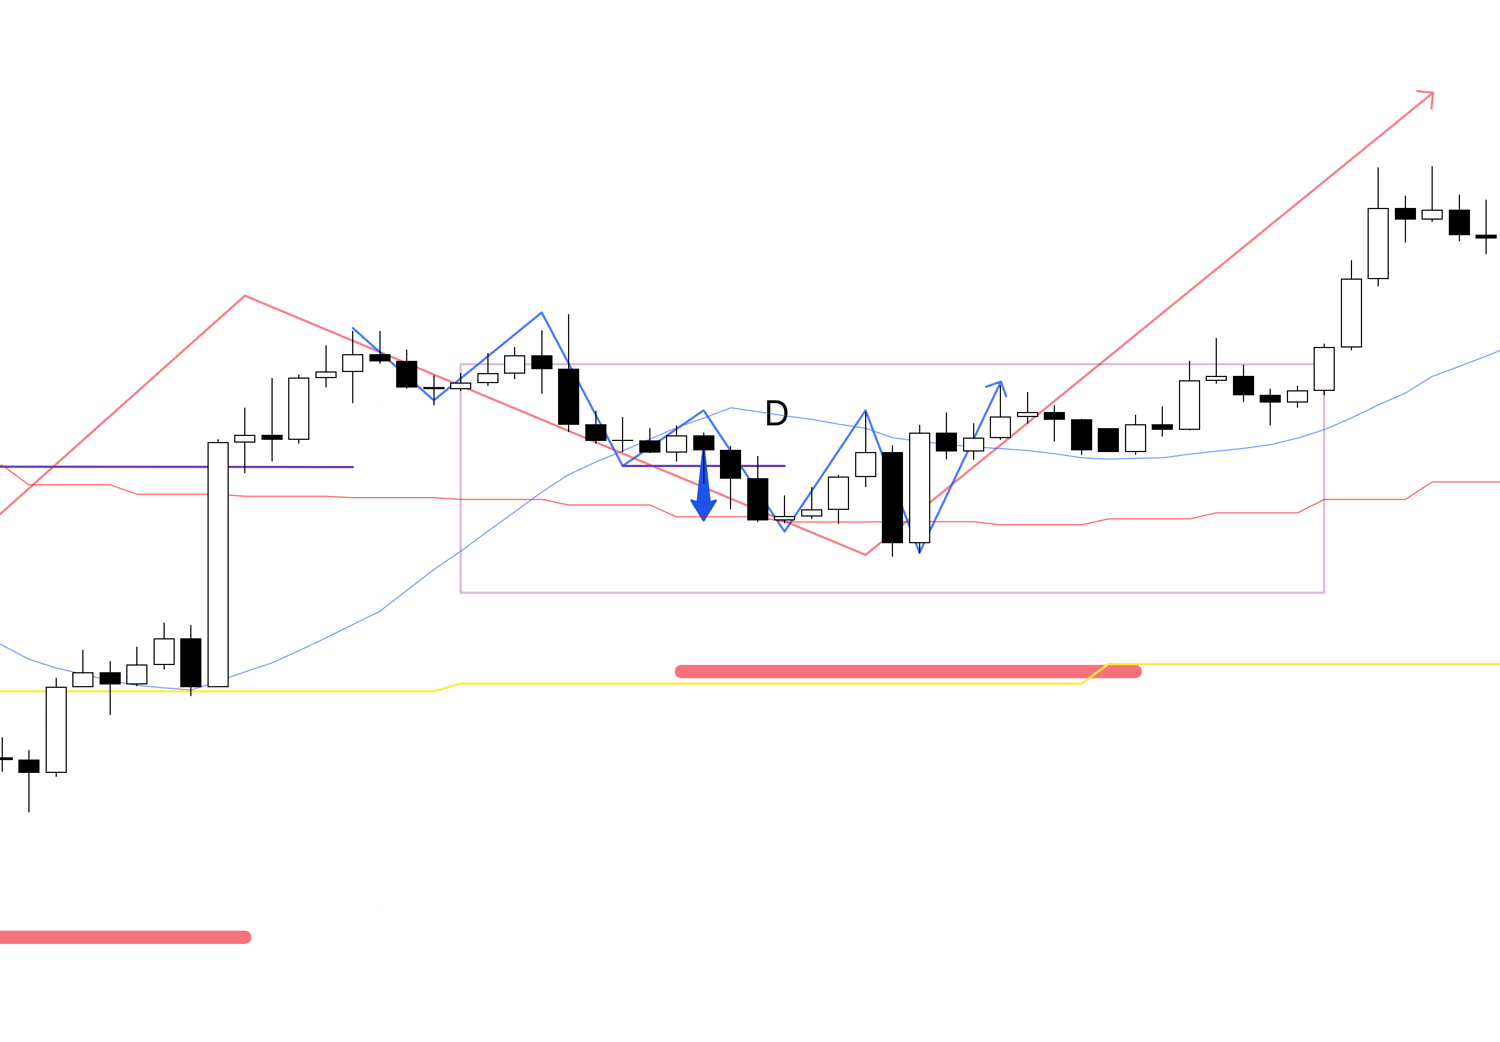
For example, this is the area where I previously said, "I do not trade here".
Even if you think, "This is a downtrend because it's been making lower lows and lower highs" and enter at a point like D, the higher timeframe, the 4h chart, is in a state of waiting for a pullback buy, so the advantage of a decline is low.
This is because the orders from each timeframe are not concentrated, and the selling force (1h) is clashing with the buying force (4h).
Therefore, this decline is not a decline for trend-following, but a "decline for waiting for the next buying opportunity".
As you can see, by only looking at a single timeframe, it becomes difficult to discern whether that is truly a point where orders will concentrate for a buy.
Many traders only look at a single timeframe and lament that "a chart pattern that used to work has stopped working," but you cannot judge whether the market environment is right for that pattern without looking at the higher timeframe.
In other words, even if it looks like the same chart pattern, its meaning changes significantly if the higher timeframe's market environment changes.
Once you can grasp the market in multi-timeframe like this and understand the chart's "fractal structure", you will come to understand the meaning of "buying low".
You will become able to define the "low point" after a downtrend has ended and the trend has reversed to an uptrend.
With this understanding, please try reading the previous blog post I wrote about Dow Theory and multi-timeframe analysis one more time.
I'm sure your understanding will deepen.
That's all for this time.
I also analyze even higher timeframes, such as the daily chart, but what I've explained this time is the basic concept.
And, of course, this is not for predicting the future, that "this is what will happen next".
If things don't go that way, what's important is to then draw up the next scenario, keep repeating the process of "if this happens, then I do that," and appropriately deal with the price action you are given at that time.
I hope this blog post will be of help in your own strategy development.