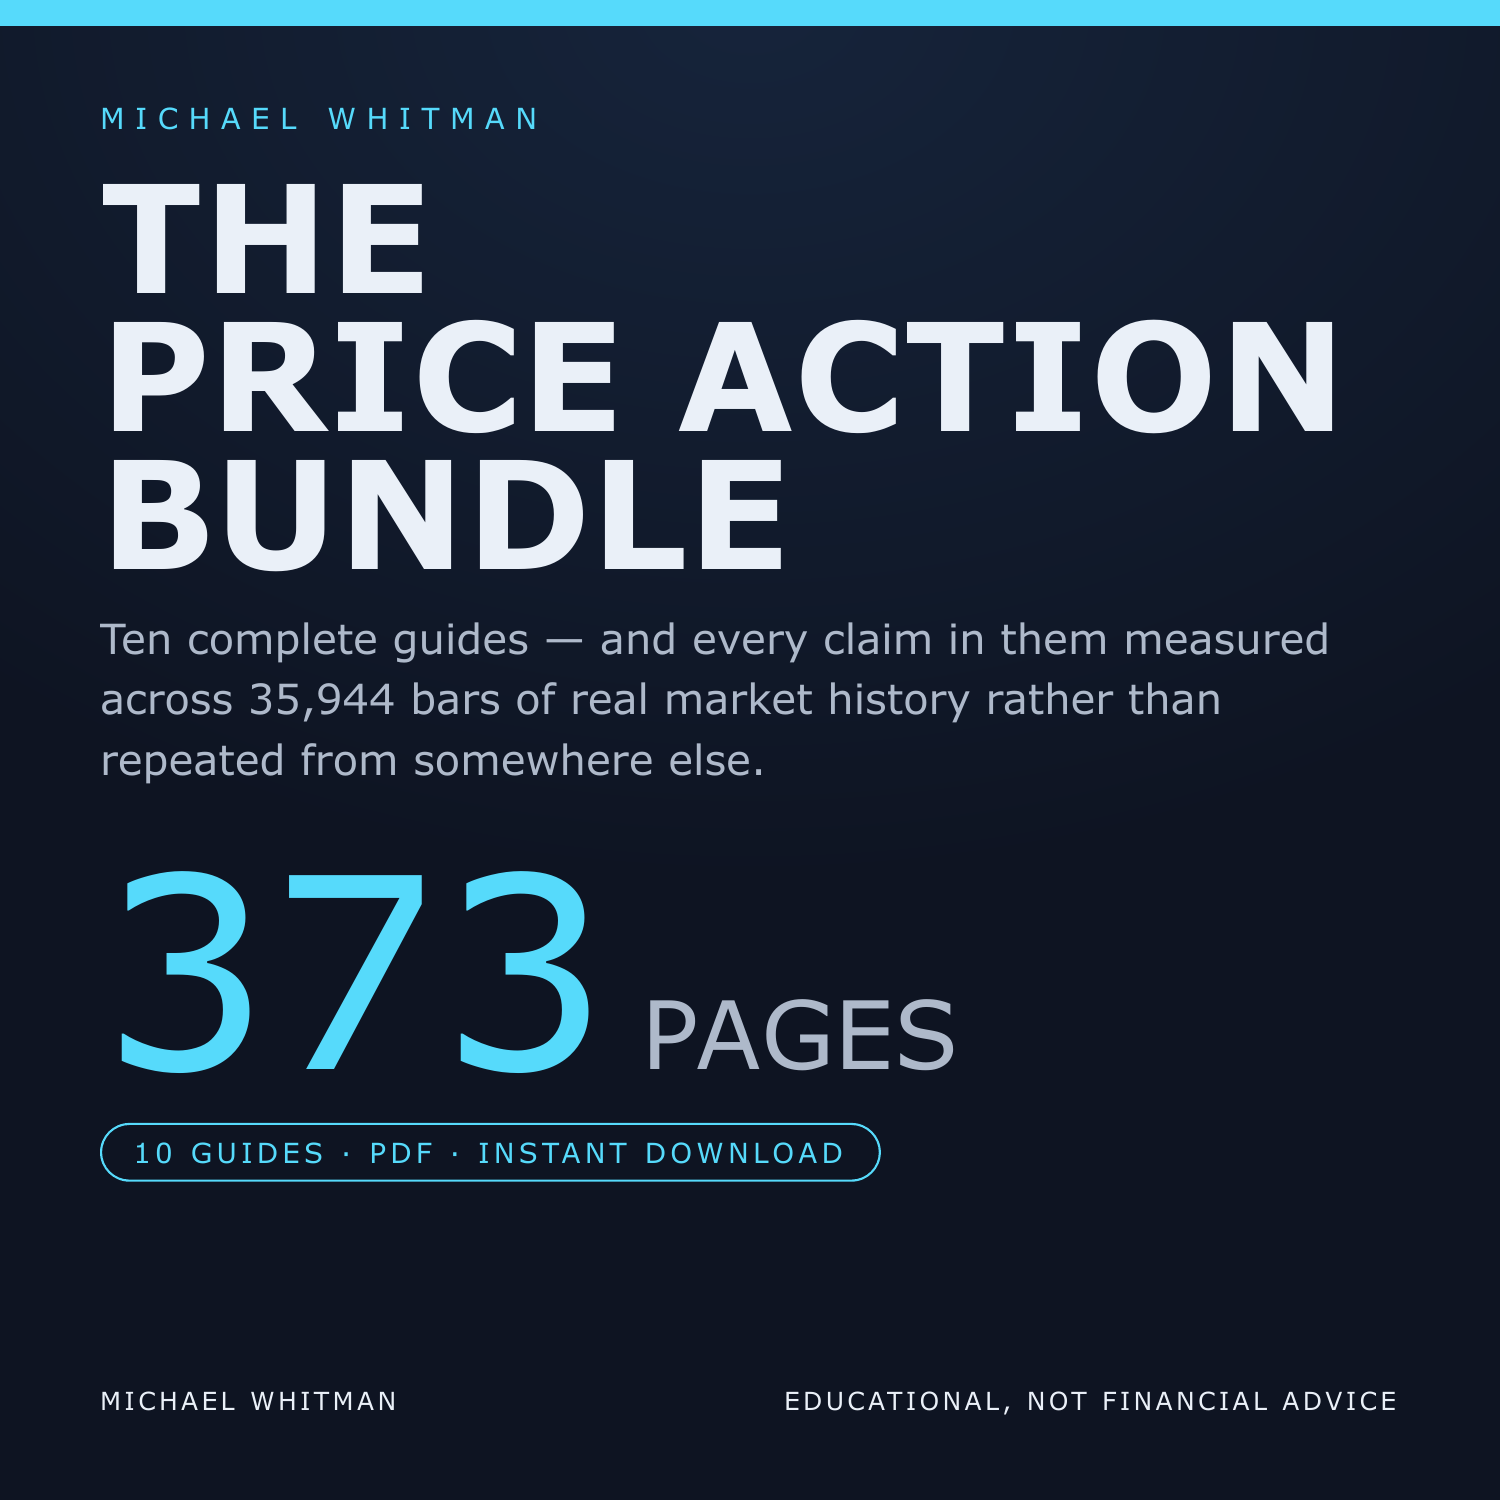








The Price Action Bundle — 10 Guides, Every Claim Measured
You have been told to trade with the trend, to wait for the third test of a level, to mark supply zones, to check the higher timeframe, and to buy the discount. None of it arrived with a number attached.
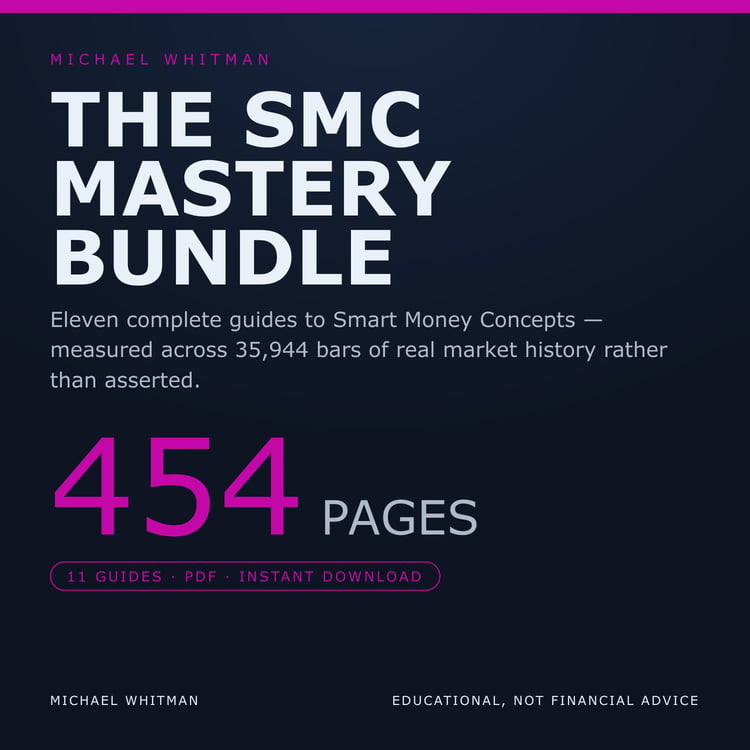
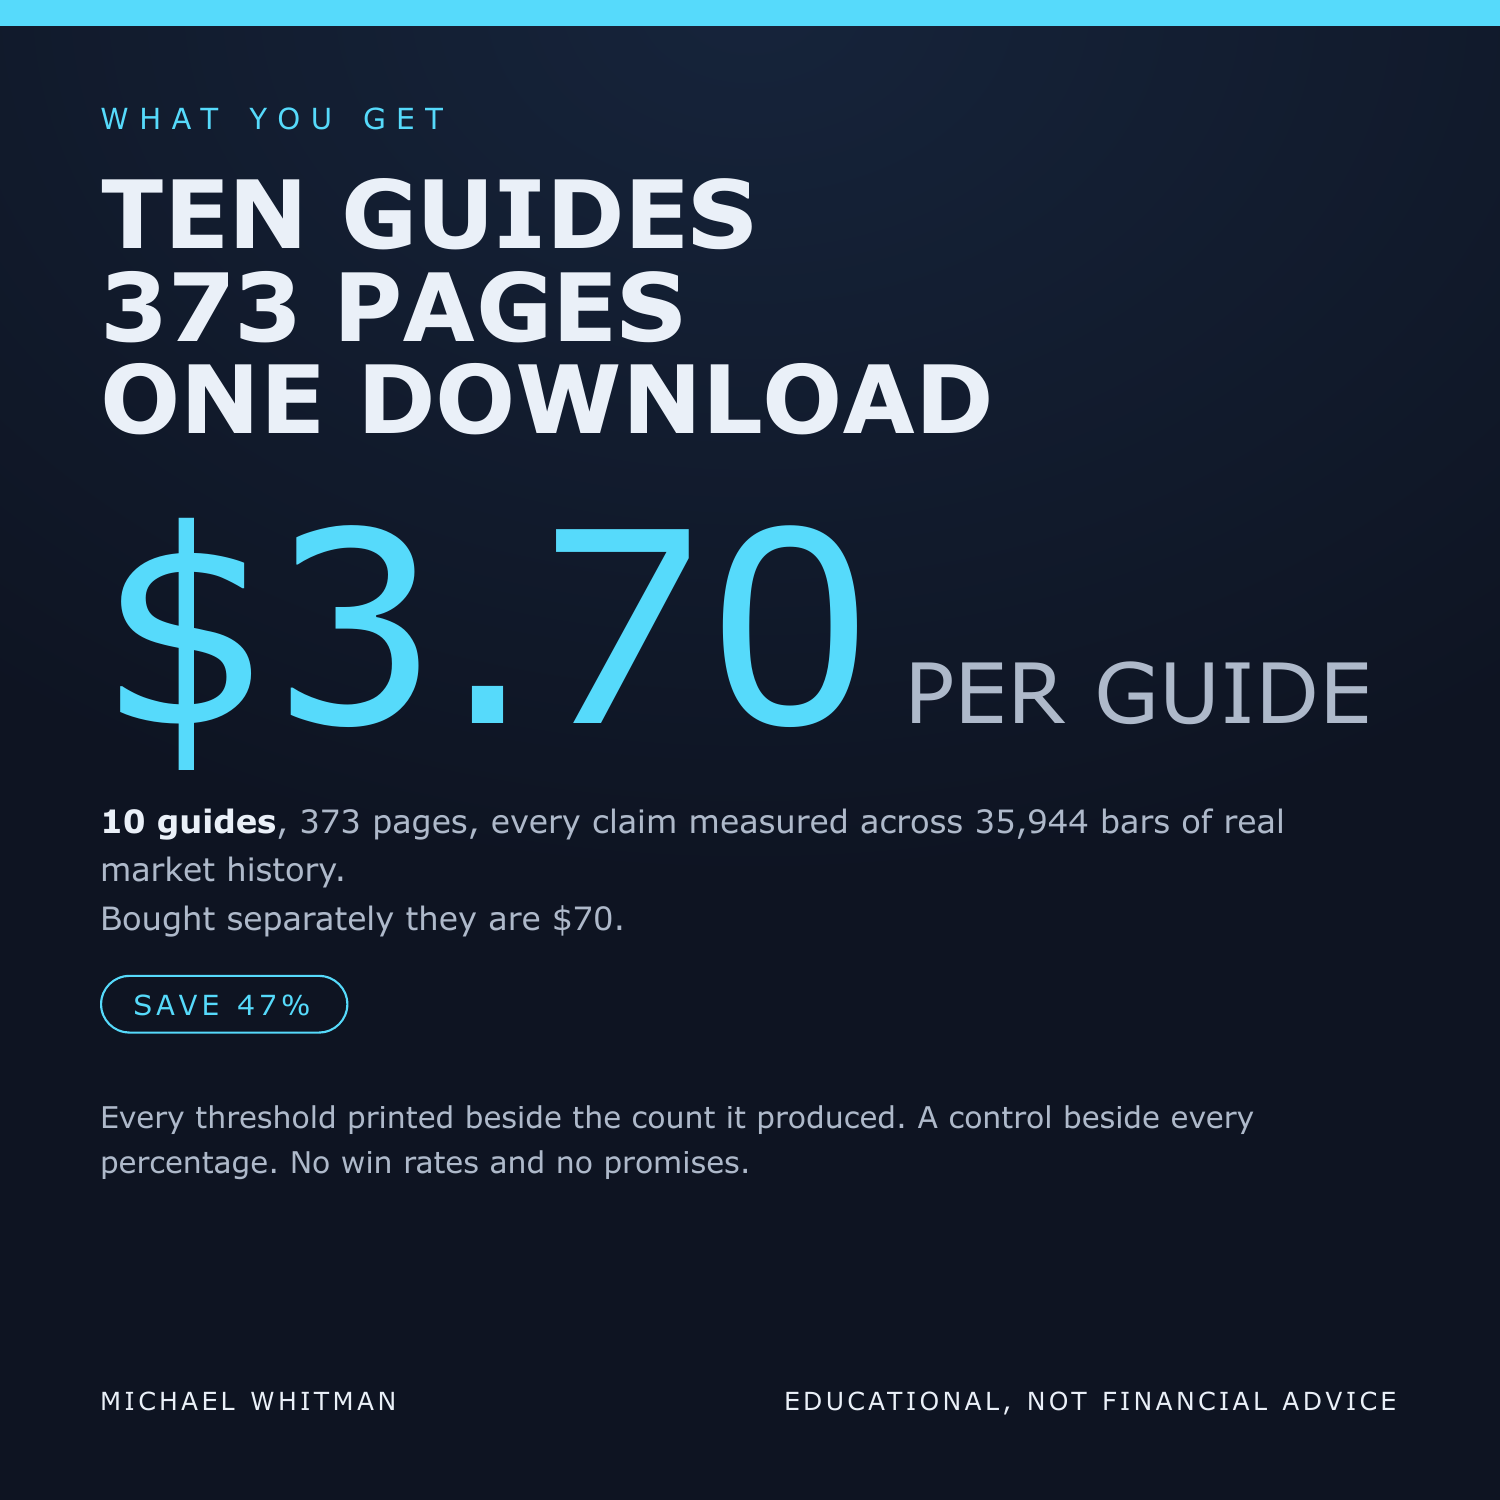
This bundle is ten complete guides, 373 pages, that measure the advice instead of repeating it.
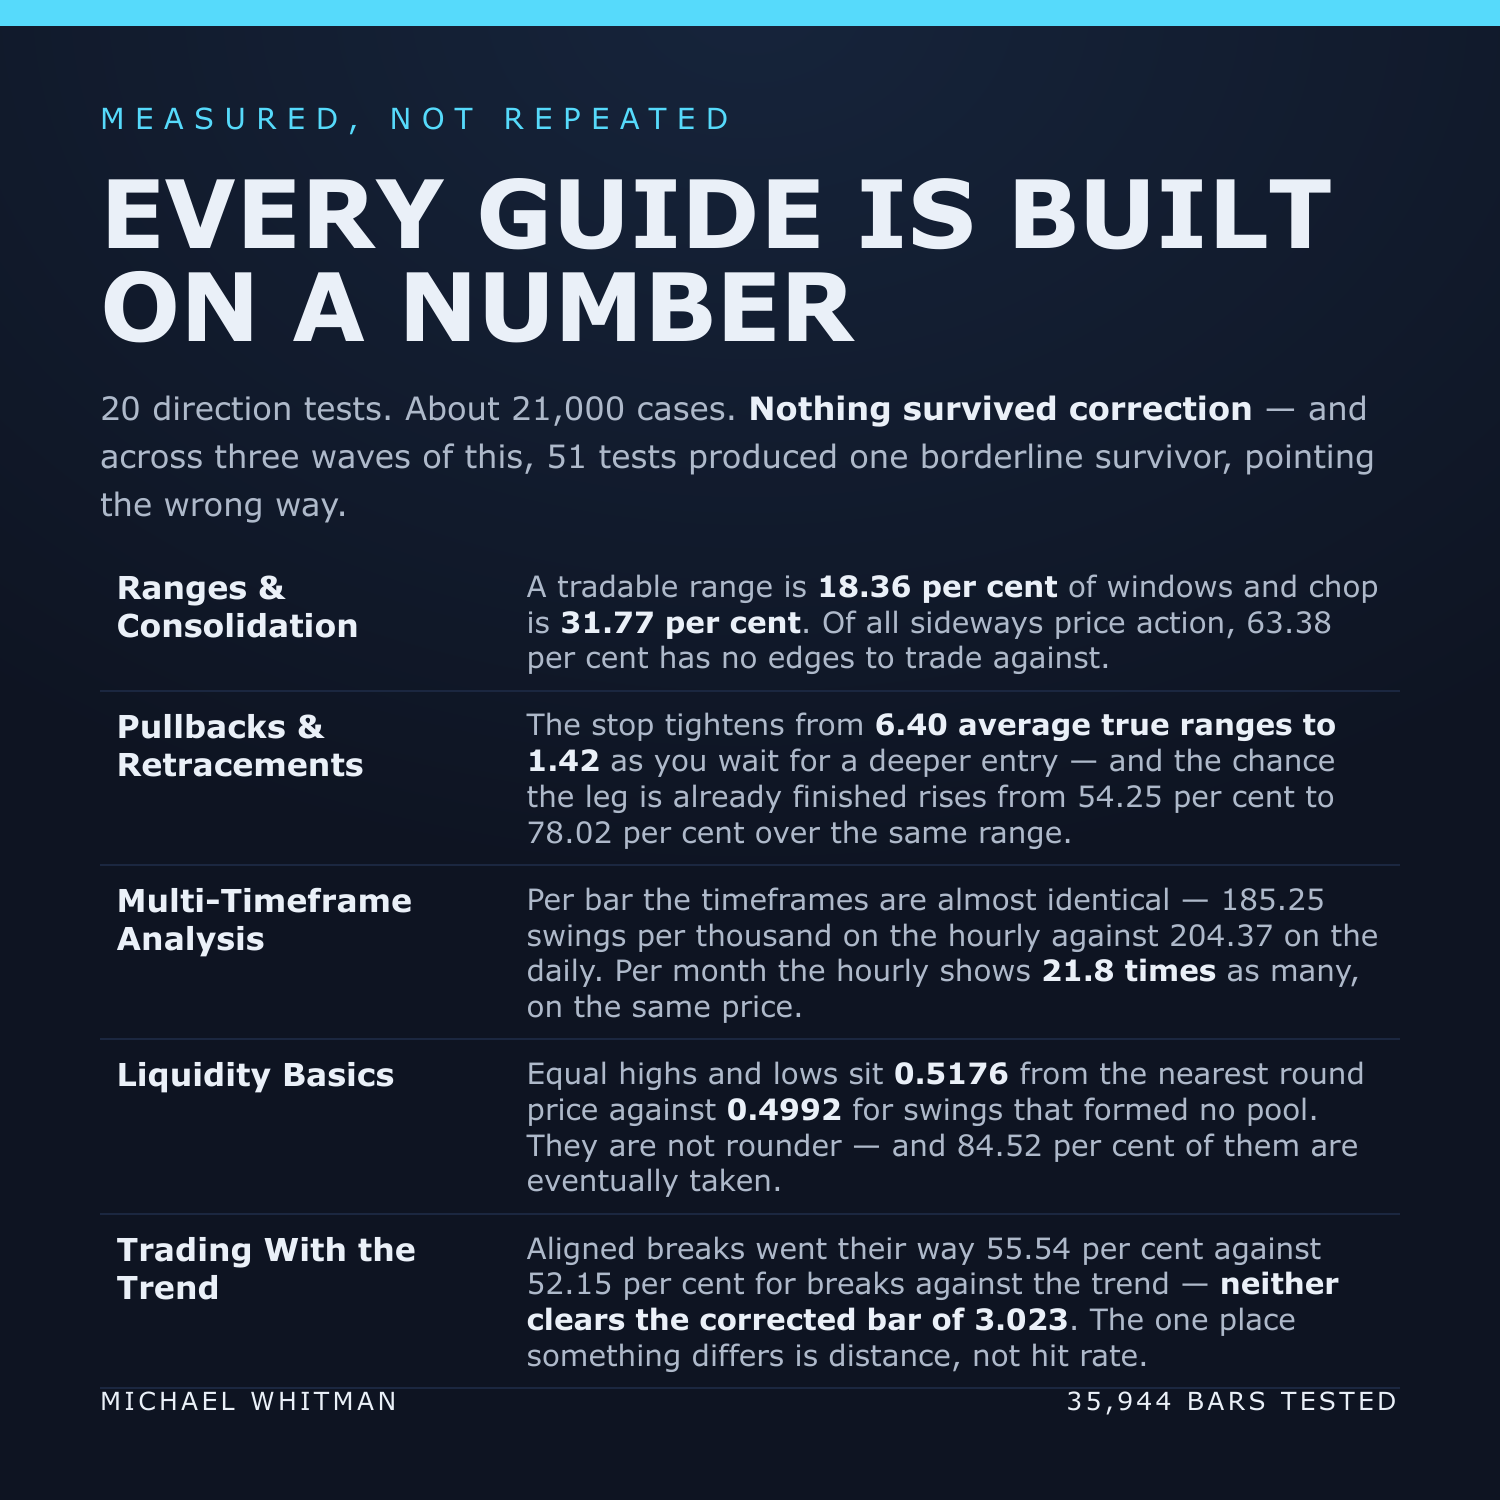
Across 35,944 bars of real market history on ten instruments and three timeframes, every tool that implied a direction was raced against a control: does price travel one average true range the promised way before one average true range the other way? 20 tests, on samples running from 27 cases to 7,563. The corrected bar for 20 tests is a z of 3.023.
Nothing cleared it.
The previous two waves measured candlestick patterns and chart patterns the same way. Across all three: 51 pre-registered tests, one borderline survivor, and it points the wrong way.
WHAT MAKES THESE DIFFERENT
Four of these guides contradict advice you have almost certainly been given. A textbook trend runs a median of 3 swings. A level holds about three quarters of the time at every touch number, so testing does not strengthen it. Three standard definitions of "the trend" agree on 51.19 per cent of bars. And equal highs and lows do not cluster on round numbers.
And guide ten prints seven measurement errors this study made and caught - including one that scored 96.43 per cent and one that was the only result in the wave to survive correction. Both were bugs. A reader who cannot see how a result goes wrong has no way to judge any result.
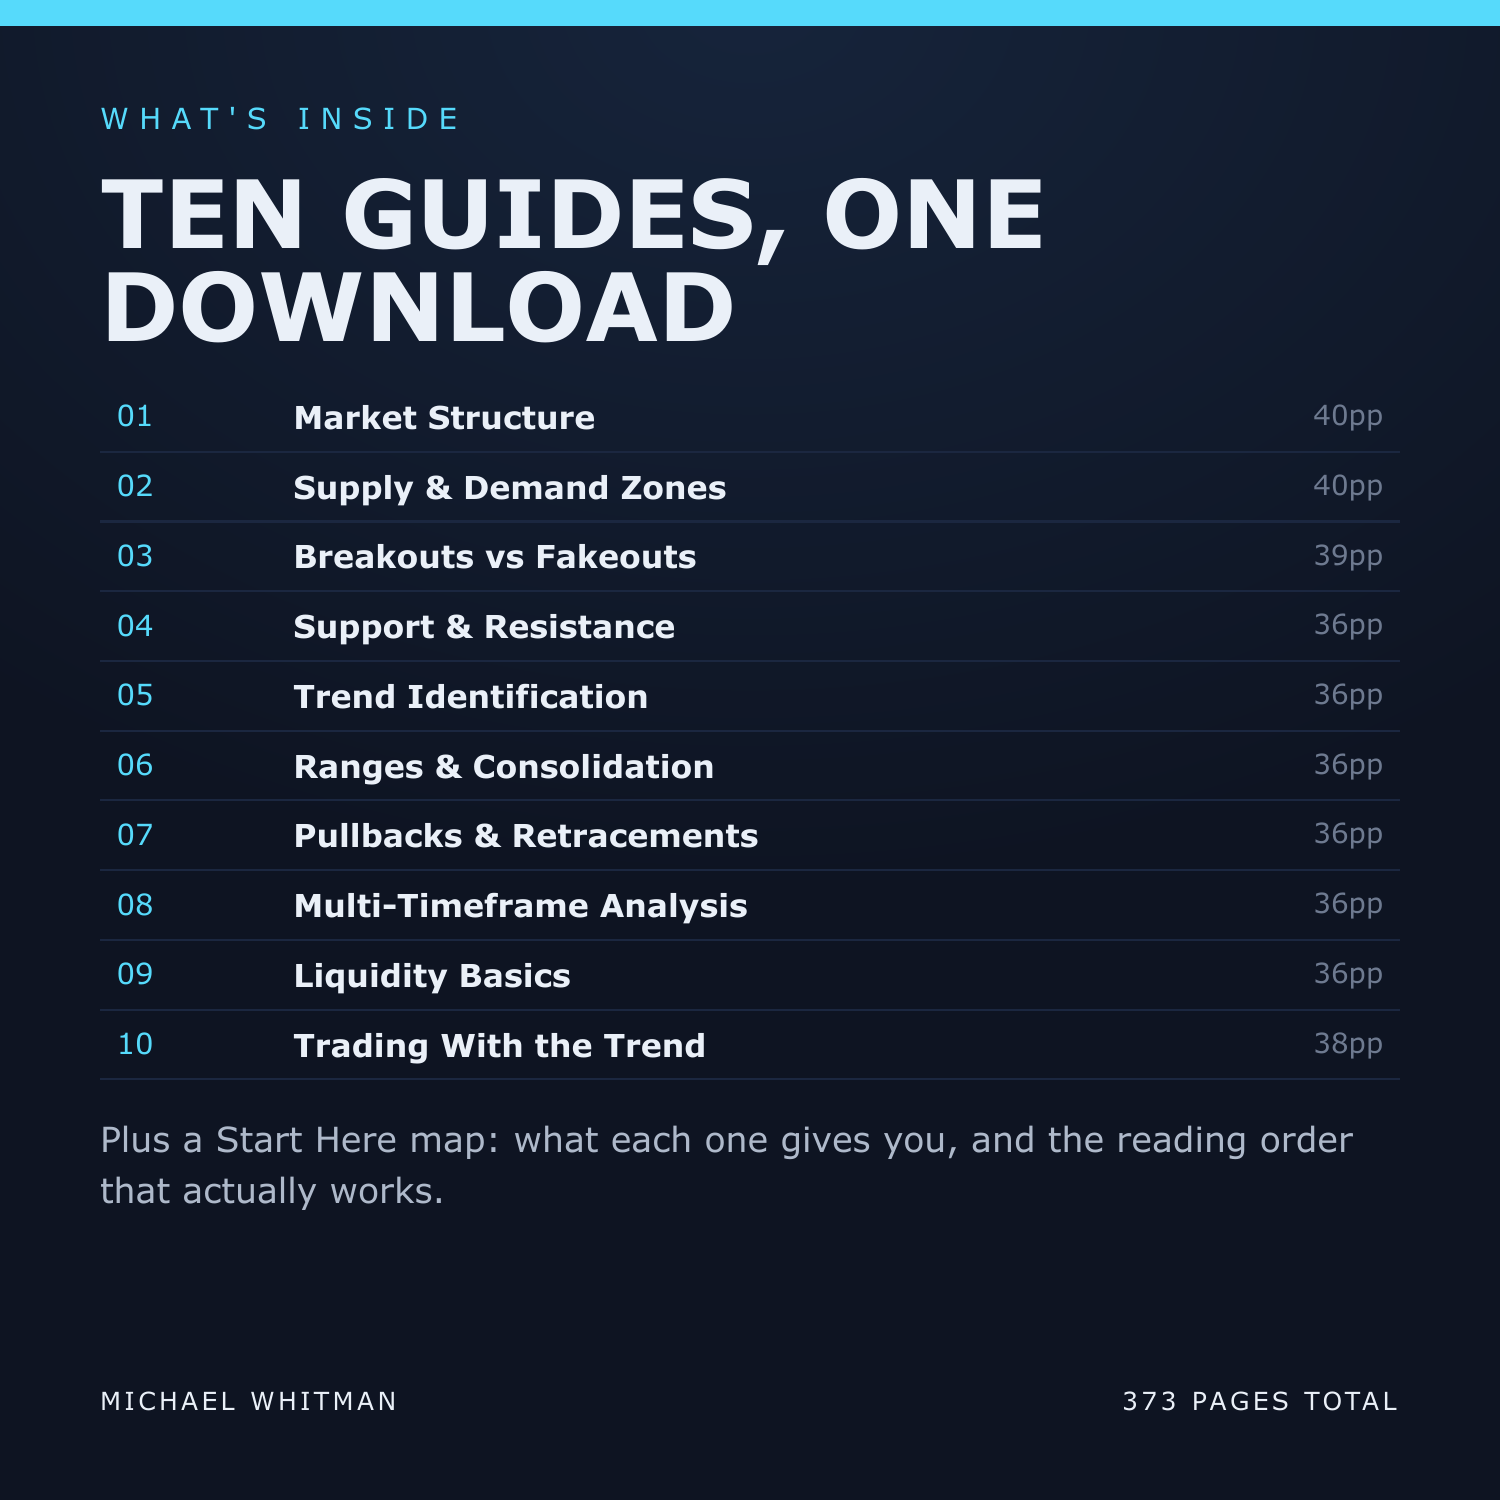
WHAT'S INSIDE
Market Structure (40pp) - The definition every course teaches, applied without mercy for the first time.
Supply & Demand Zones (40pp) - Whether a supply zone and an order block are the same object, settled by counting.
Breakouts vs Fakeouts (39pp) - The most directly usable table in the wave: how far past a level before you believe it.
Support & Resistance (36pp) - Two confident, opposite claims about levels, both measured.
Trend Identification (36pp) - Why two careful people look at one chart and disagree about the trend.
Ranges & Consolidation (36pp) - The distinction that decides whether range trading works at all.
Pullbacks & Retracements (36pp) - Both halves of a trade-off that is always sold as one.
Multi-Timeframe Analysis (36pp) - What changes when you switch chart, and the larger half that does not.
Liquidity Basics (36pp) - One piece of liquidity folklore survives measurement and one does not.
Trading With the Trend (38pp) - The closing guide: the most repeated advice in the subject, measured.
ONE MEASURED FINDING FROM EACH
Market Structure: A run of higher highs and higher lows lasts a median of 3 swings, and 43.13 per cent of them last exactly two.
Supply & Demand Zones: The retail rule finds 8,515 zones and the Smart Money rule finds 1,882 - and 96.87 per cent of the smaller set sits inside the larger one. The structure break is a filter, not a different object.
Breakouts vs Fakeouts: 61.59 per cent of closes through a level come straight back - and the rate falls from 71.25 per cent to 25.81 per cent as the close through it grows from half an average true range to two.
Support & Resistance: A level holds 75.28 per cent at its first test and 78.71 per cent at its fourth - a spread of 5.34 points across four touches.
Trend Identification: Three standard definitions, computed on identical bars, agree on 51.19 per cent of them.
Ranges & Consolidation: A tradable range is 18.36 per cent of windows and chop is 31.77 per cent. Of all sideways price action, 63.38 per cent has no edges to trade against.
Pullbacks & Retracements: The stop tightens from 6.40 average true ranges to 1.42 as you wait for a deeper entry - and the chance the leg is already finished rises from 54.25 per cent to 78.02 per cent over the same range.
Multi-Timeframe Analysis: Per bar the timeframes are almost identical - 185.25 swings per thousand on the hourly against 204.37 on the daily. Per month the hourly shows 21.8 times as many, on the same price.
Liquidity Basics: Equal highs and lows sit 0.5176 from the nearest round price against 0.4992 for swings that formed no pool. They are not rounder - and 84.52 per cent of them are eventually taken.
Trading With the Trend: Aligned breaks went their way 55.54 per cent against 52.15 per cent for breaks against the trend - neither clears the corrected bar of 3.023.
WRITTEN FOR SOMEBODY WHO KNOWS THE BASICS AND NO STATISTICS
Every guide opens with a plain-English primer: average true range, the control, the sample size, the standard error, z, the correction - plus every price-action word, from swing and clearance to leg, pullback, zone, range, chop and invalidation. All defined before the first number appears, with no mathematics anywhere. If you can read a candlestick chart you can read these.
WHAT YOU'LL BE ABLE TO DO
Mark structure, zones and levels by written rules that give the same answer twice.
State the threshold behind every count you make, and know what moving it costs.
Read any market claim through four questions: against what control, on how many cases, out of how many tests, and could you have been there at the time.
Tell a hit rate from a distance, and know which one your exit needs.
Recognise the market state where nothing in this catalogue applies, which is 31.77 per cent of the time.
AN HONEST NOTE
These are clues, not crystal balls. This bundle contains no win rates, no historical-test results and no promises about what you will make, because nobody can verify those and you should not trust anyone who prints them. It also does not claim price action is worthless - every tool in here locates, classifies or bounds risk, and the guides measure those uses and support them. It is the directional claims that did not survive. Educational, not financial advice.
Instant download. 10 guides, 373 pages, PDF.