


S-Curve Excel Templates
Mastering Project Management with the S-Curve Excel Template
In the dynamic world of project management, having the right tools at your disposal can make all the difference. One such invaluable tool is the S-Curve Excel template. This article will delve into the intricacies of the S-Curve, its importance in project management, and how you can leverage an Excel template to streamline your project tracking and analysis.
What is an S-Curve?
An S-Curve is a graphical representation of cumulative data points, which typically showcase project progress over time. Named for its characteristic ‘S’ shape, this curve is crucial for monitoring the growth, progress, and overall performance of a project.
- Phases of the S-Curve:
- Initial Phase: Slow growth as the project begins.
- Growth Phase: Rapid progress as the project hits its stride.
- Maturity Phase: Slowing progress as the project nears completion.
Benefits of Using an S-Curve in Project Management
Understanding and implementing an S-Curve in your project management process offers numerous benefits:
- Enhanced Monitoring: Track project progress against planned milestones.
- Predictive Insights: Forecast future project performance and potential delays.
- Resource Management: Efficiently allocate resources based on project needs.
- Performance Evaluation: Assess the productivity and effectiveness of project strategies.
Why Use an S-Curve Excel Template?
Excel remains one of the most accessible and versatile tools for project managers. Using an S-Curve Excel template provides a user-friendly and customizable solution for tracking project progress.
- Ease of Use: Simple input and analysis of project data.
- Customization: Tailor the template to fit your specific project requirements.
- Visualization: Clear and concise graphical representation of project data.
How to Use the S-Curve Excel Template
Step-by-Step Guide:
- Download the Template: Start by downloading a free S-Curve Excel template.
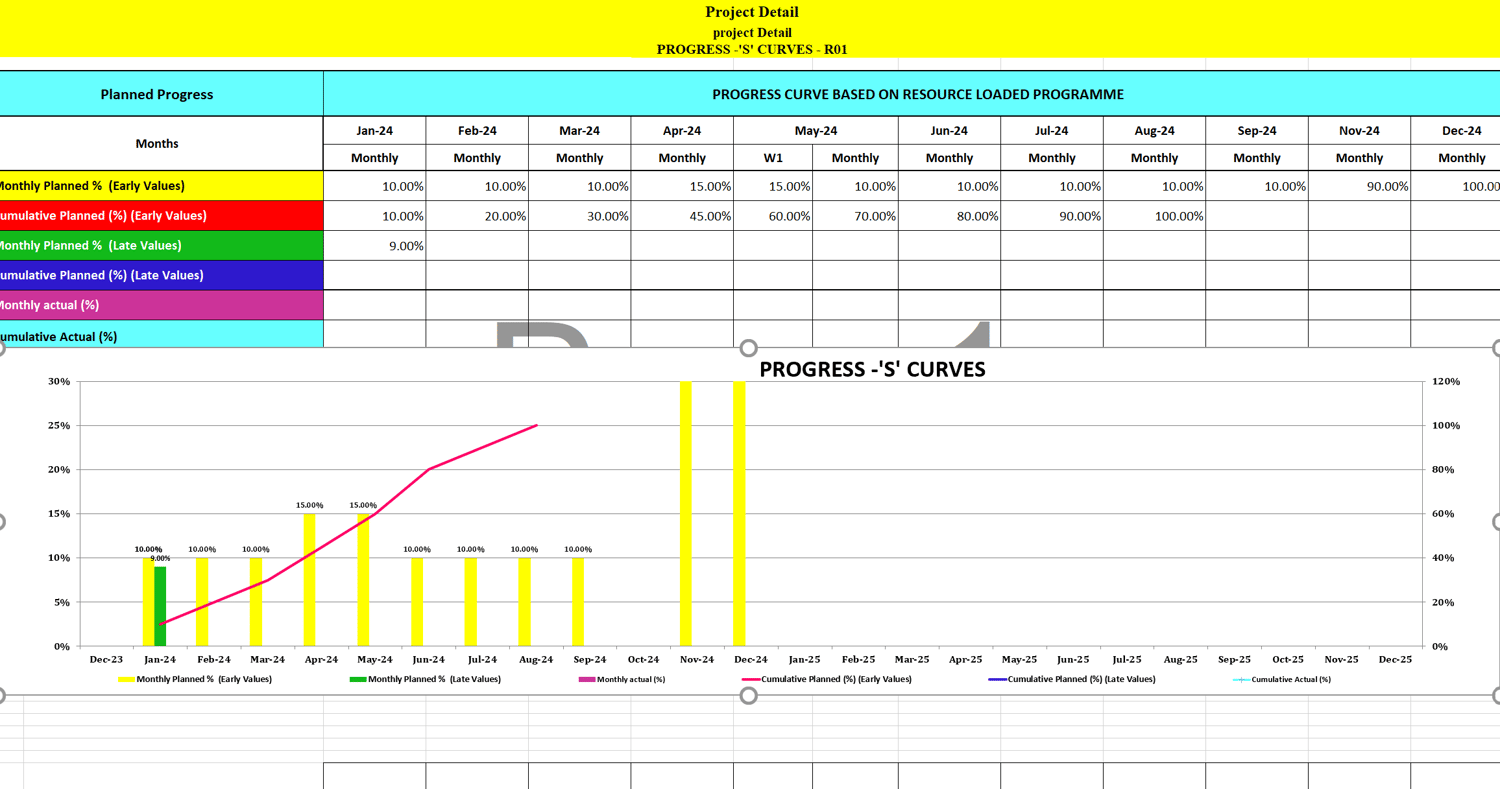
- Input Data: Enter your project’s cumulative data points into the template. This typically includes time (days, weeks, months) and progress metrics (cost, hours worked, tasks completed).
- Generate the Curve: Use Excel’s built-in chart tools to create the S-Curve.
- Analyze the Curve: Compare the actual progress curve with the planned progress curve to identify variances and make necessary adjustments.
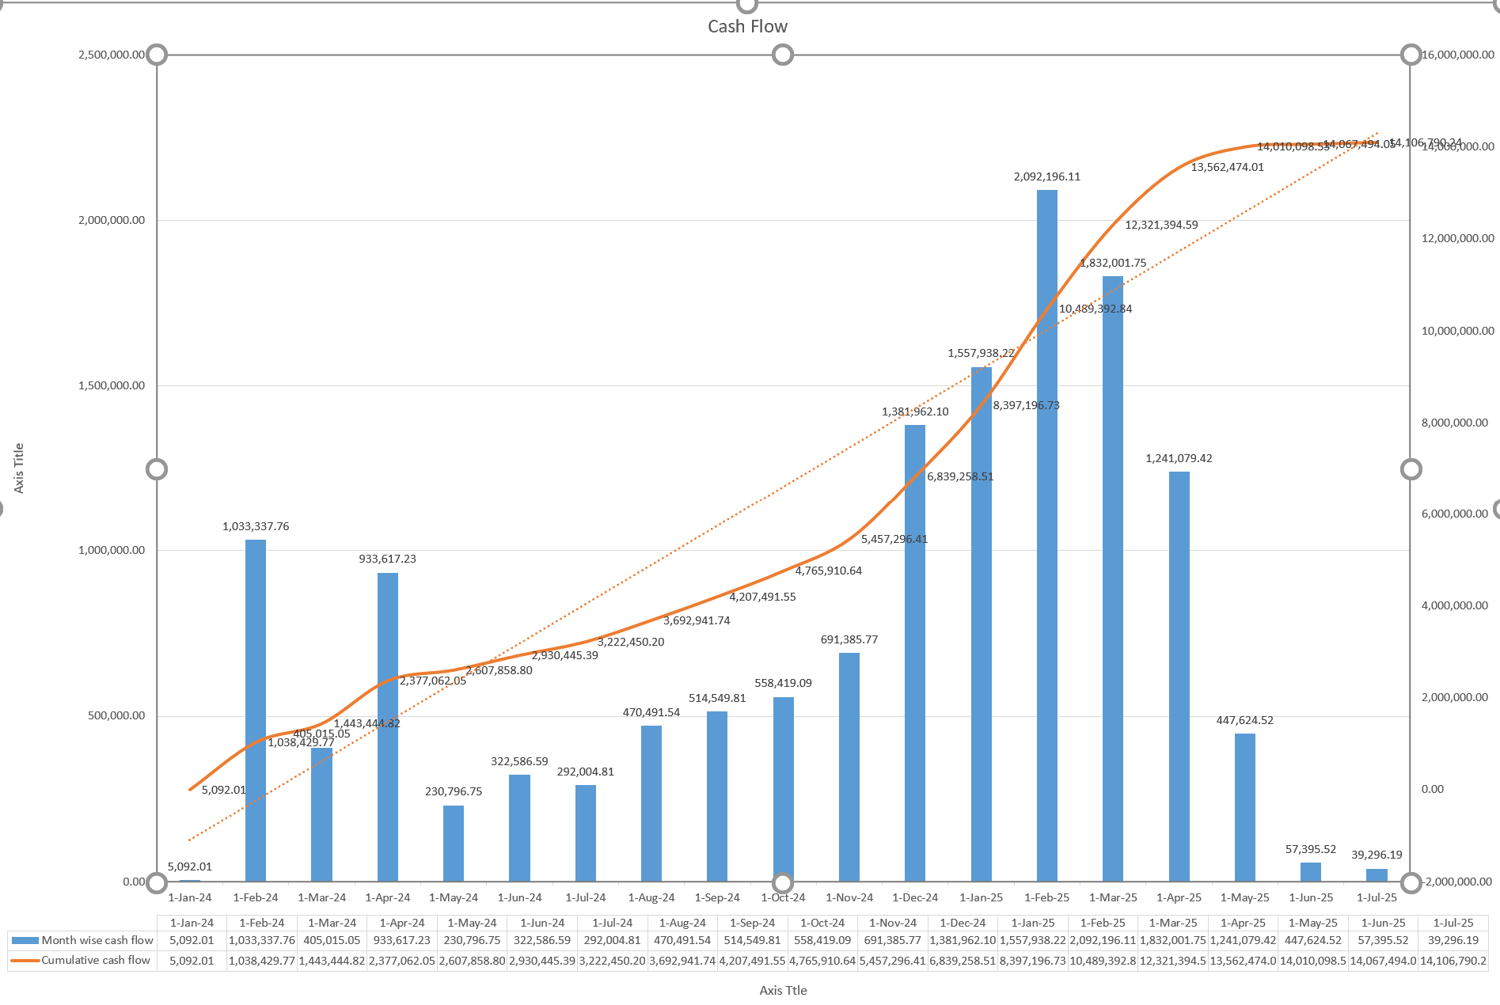
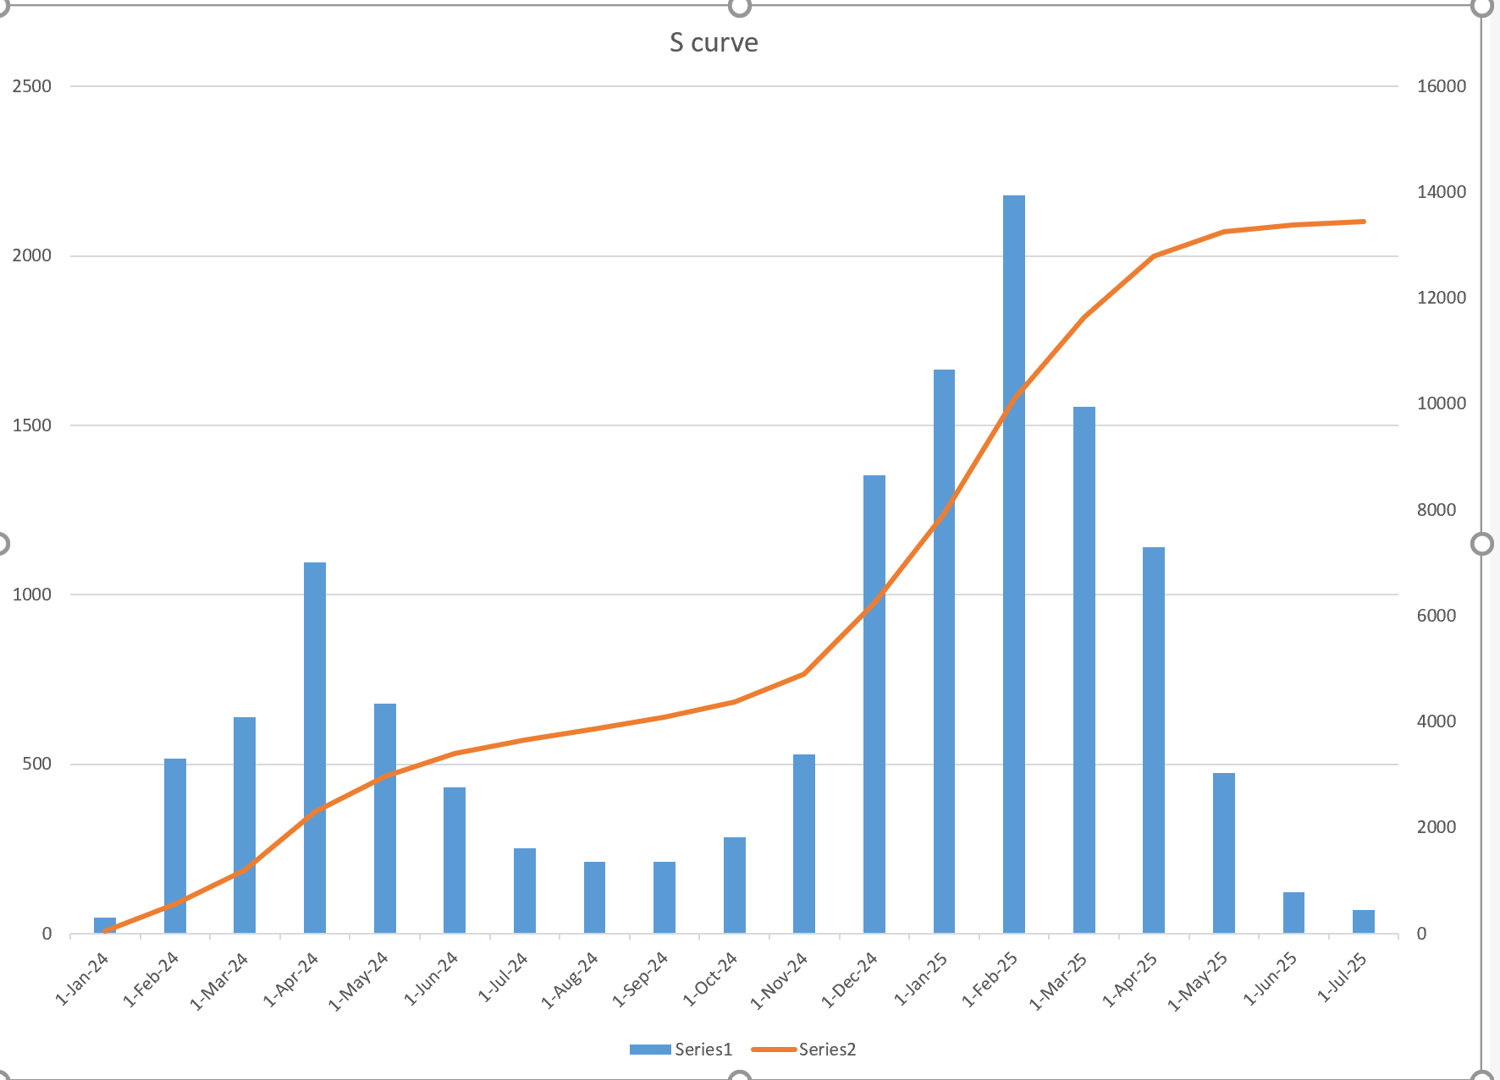
Example: Using an S-Curve in Construction Projects
In construction projects, the S-Curve is particularly beneficial for tracking the project’s financials and timeline. By plotting cumulative costs against time, project managers can visualize whether the project is on budget and schedule.
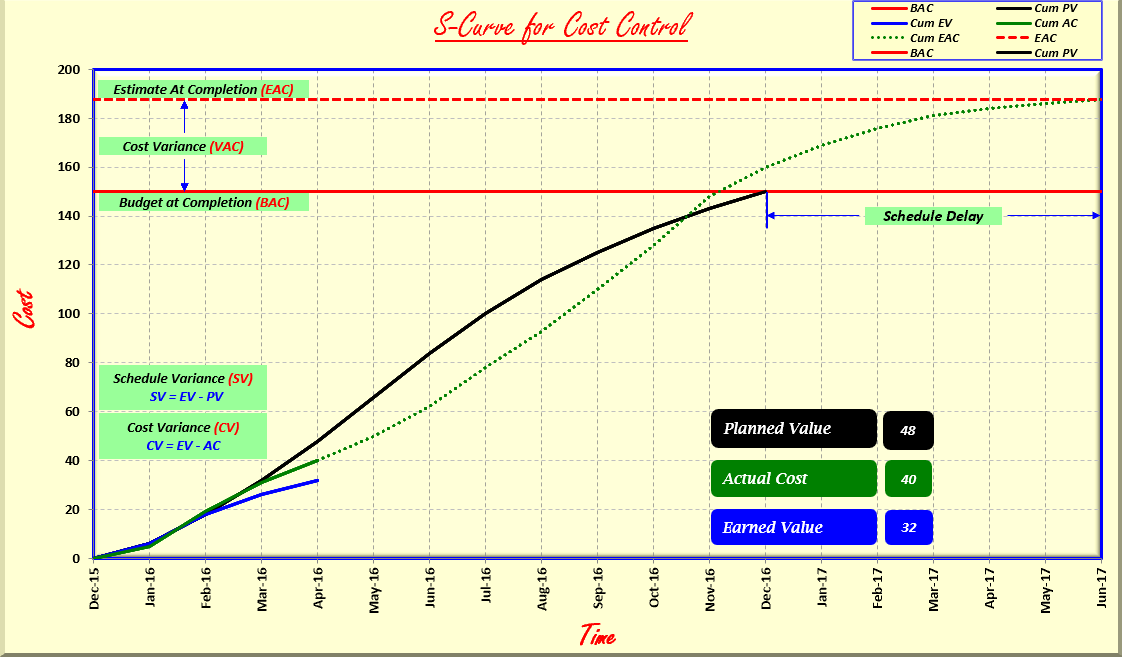
Key Metrics:
- Planned Value (PV): The budgeted cost for work scheduled.
- Actual Cost (AC): The actual cost incurred for work performed.
- Earned Value (EV): The value of work actually performed.
By comparing these metrics, managers can determine Cost Performance Index (CPI) and Schedule Performance Index (SPI), providing deeper insights into project health.
Tips for Maximizing the Use of S-Curve Excel Templates
- Regular Updates: Continuously update the template with real-time data to maintain accuracy.
- Consistent Review: Regularly review the S-Curve to make proactive adjustments.
- Collaboration: Share the S-Curve with your team to ensure everyone is aligned on project status.
Conclusion
The S-Curve Excel template is a powerful tool for project managers looking to enhance their project tracking and performance evaluation. By understanding the phases of the S-Curve and effectively utilizing the Excel template, you can ensure your projects are completed on time and within budget. Embrace this tool to streamline your project management processes and drive your projects to successful completion.