
Kitchen Ticket-Time, Expeditor & Course Pacing Tracker: Ticket Time, 90th Percentile, Late Tickets and Course Gap Tracker for Restaurants
Full description
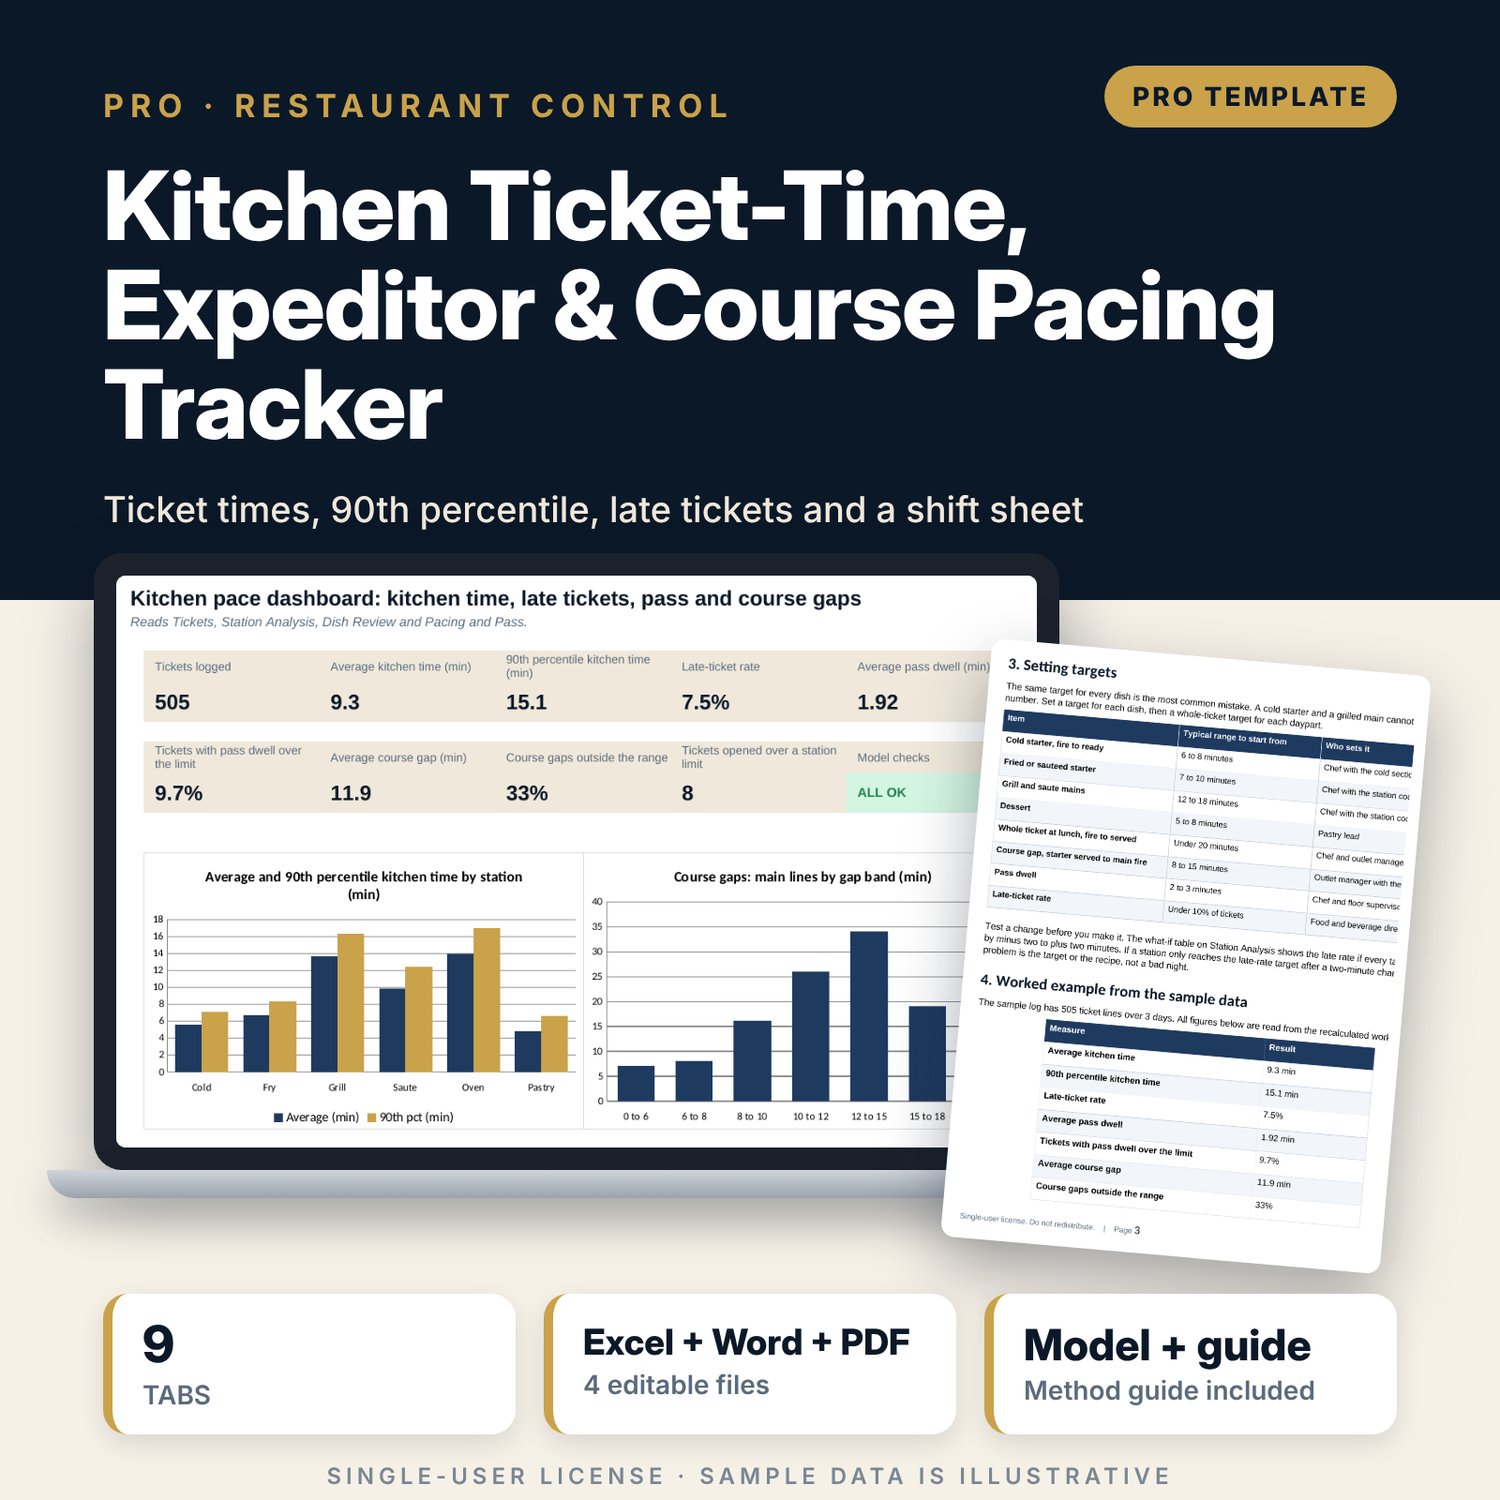
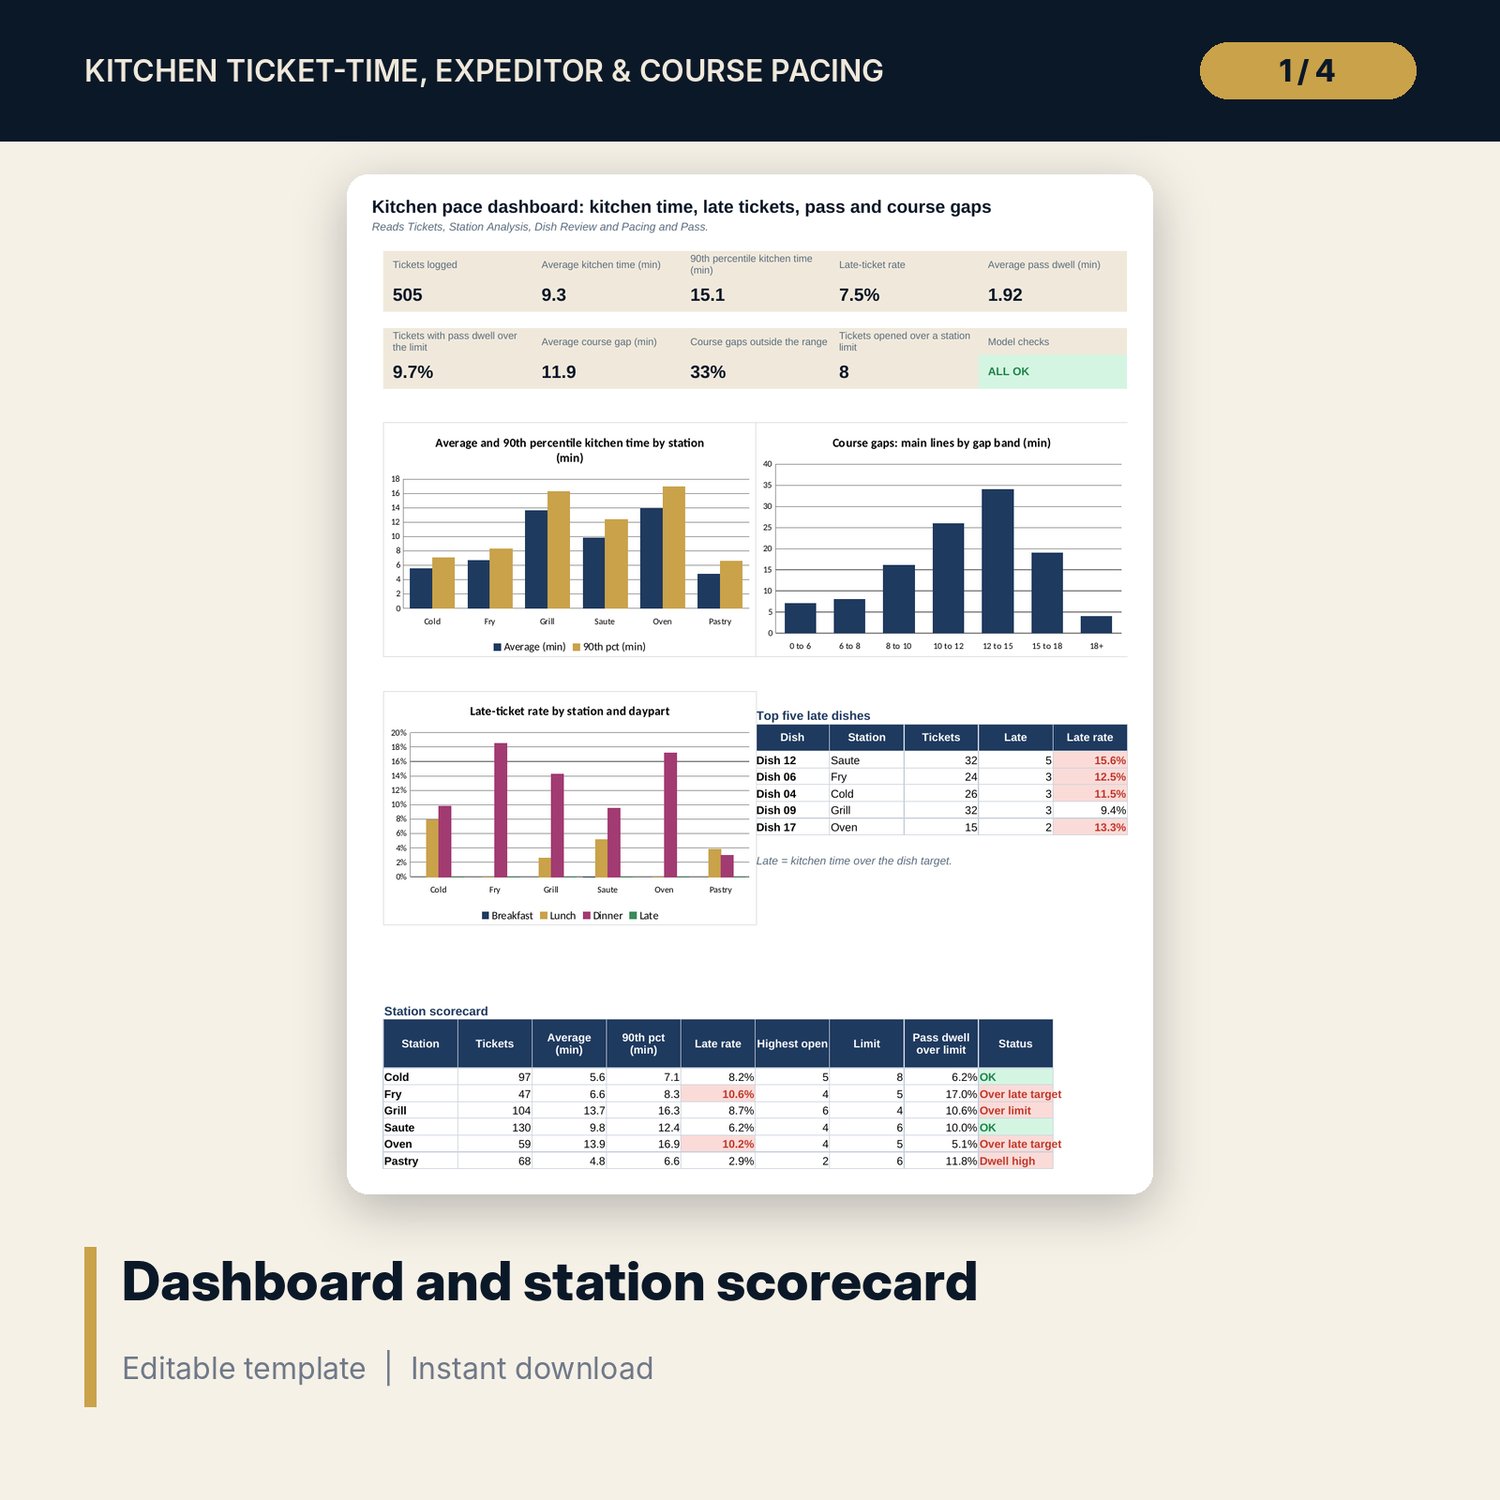
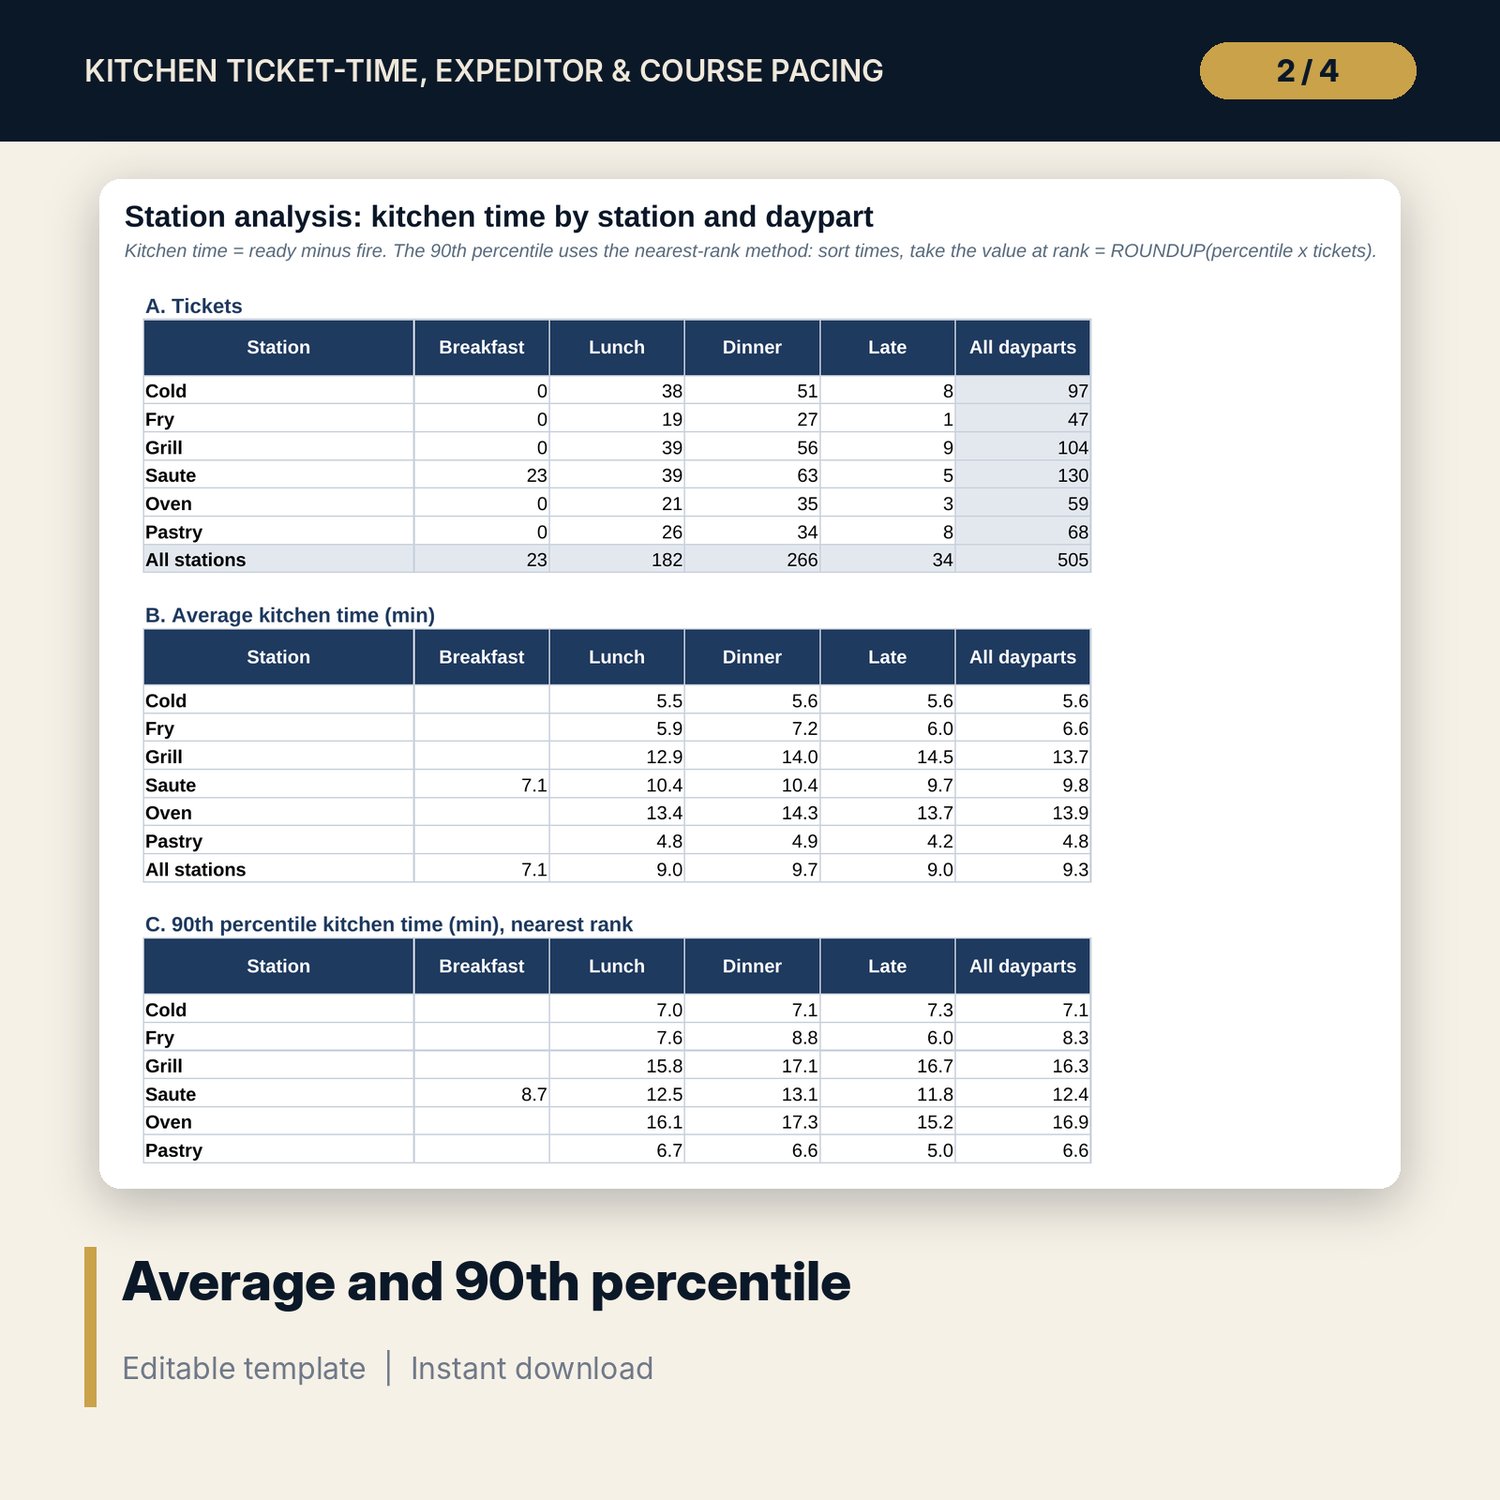
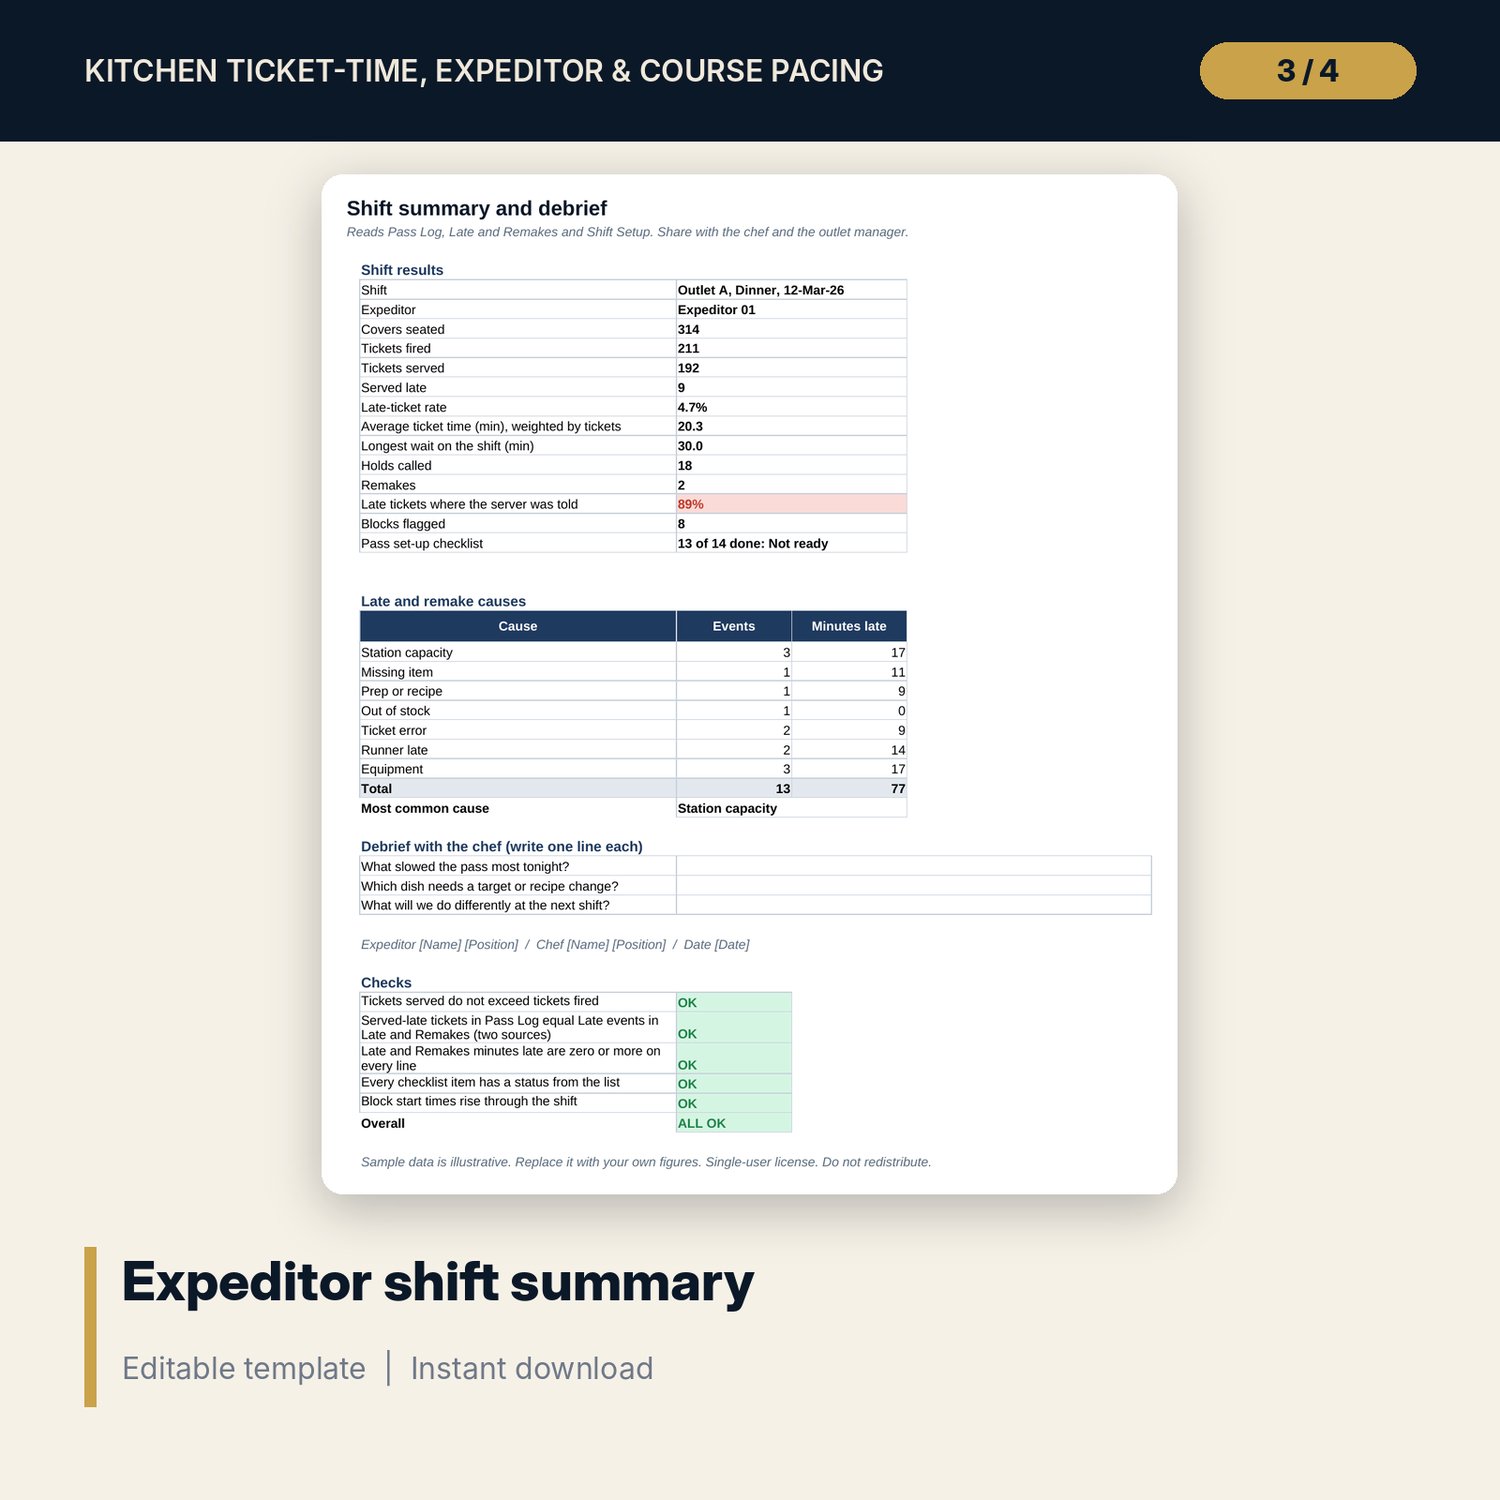
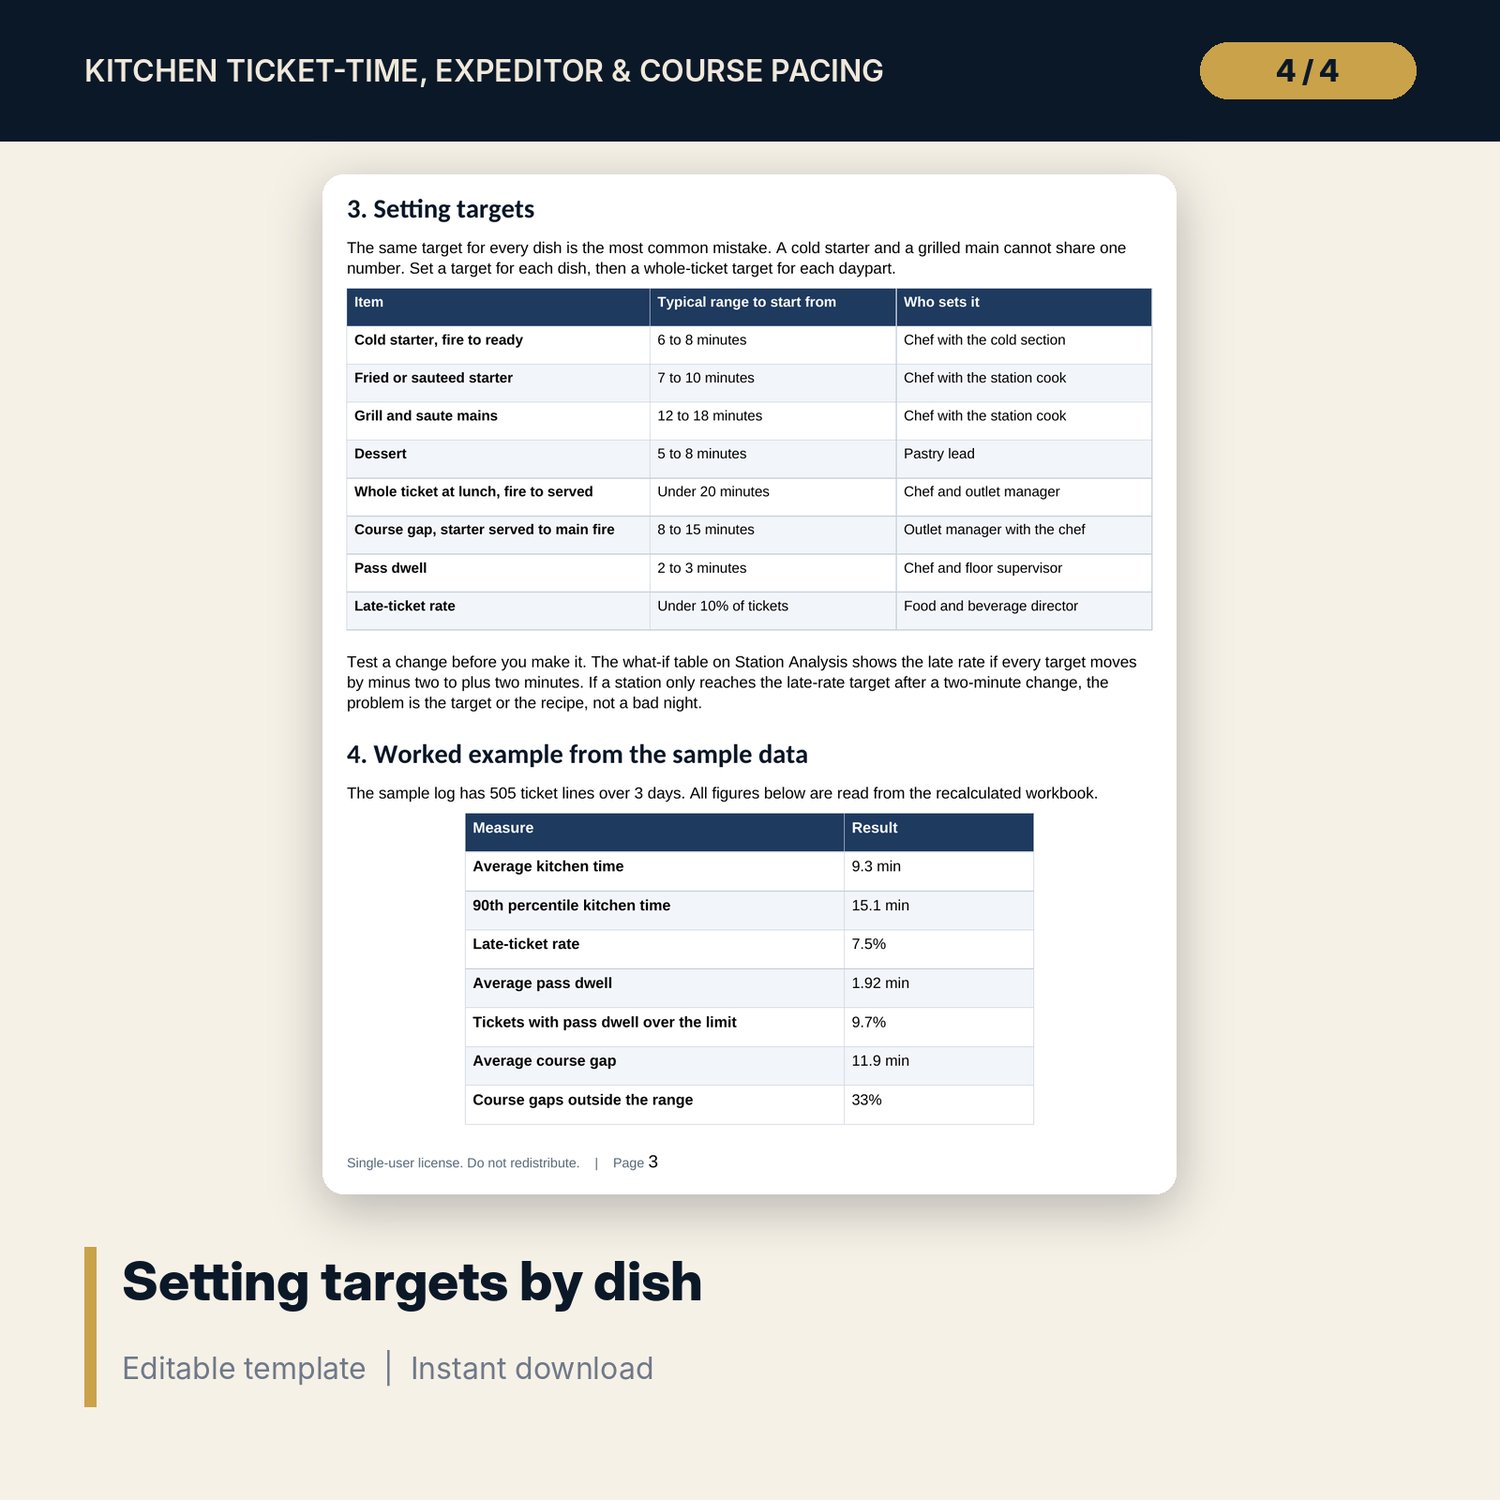
For chefs, expeditors, outlet managers and food and beverage directors who want ticket times measured, not guessed. The main workbook takes one row per ticket line (fire, ready and served time) and measures kitchen time against a target for each dish, pass dwell, total time, station load, course gaps and late tickets. It shows the average and the 90th percentile by station and daypart, the top five late dishes for the weekly review, a what-if table for target changes and a station scorecard. The companion workbook is a one-shift expeditor sheet with a pass checklist, a 15-minute pass log and a late and remake log. The Word guide sets out the method with a worked example, expeditor standards, delay scripts and the weekly review.
What is inside
- Kitchen_Ticket_Time_Tracker.xlsx: 9 tabs, 13,825 formulas, 3 native charts, 9 drop-down and input rules, 9 integrity checks
- Tickets: 505 sample ticket lines plus 40 spare rows, 33 columns including kitchen time, pass dwell, late flags, station load, course gap and rank columns
- Assumptions: 24 dishes with targets, 4 dayparts, 6 stations, thresholds; Station Analysis: 4 tables by station and daypart, peak load and a what-if grid
- Dish Review with a top-five list, Pacing and Pass with a gap distribution and the ten longest gaps, Dashboard with 10 tiles and 3 charts, Method with 12 rows
- Kitchen_Expeditor_Shift_Sheet.xlsx: 4 tabs, 189 formulas, pass checklist (14 items), 16 pass log blocks, 30 event lines, shift summary and 5 checks
- Kitchen_Pacing_Guide.docx and PDF: 8 pages with equations, a worked example read from the workbook, 19 expeditor standards, delay scripts, weekly review and glossary
- README.txt and LICENSE-and-Terms.txt
How it works
- Set targets by dish and daypart on Assumptions.
- Paste ticket lines into Tickets, one row per dish on a check.
- Read the average, the 90th percentile and the late rate by station and daypart.
- Run the weekly review from the top five late dishes and the course gaps; use the shift sheet at the pass.
Details
- Formats: 2 Excel workbooks (.xlsx), 1 Word guide (.docx) and PDF, English
- Software: Excel 2016 or later, or LibreOffice Calc 7 or later
- No macros, no external links, no data tables, no array formulas
- 4 files plus README and license; instant digital download
Good to know
- Sample data is illustrative. Replace it with your own figures.
- Targets, limits and ranges are examples. Set your own with the chef and verify local requirements.
- Single-user license. Do not redistribute.
FAQ
How is the 90th percentile calculated?
Each ticket gets a rank inside its group. The percentile is the kitchen time whose rank is ROUNDUP(0.9 x tickets in the group), found with a SUMIFS. No sorting or array formula is needed.
Can I set a different target for each dish?
Yes. The dish list on Assumptions holds a station, a course and a kitchen target for each dish. The whole-ticket target is set by daypart.
What if I do not record course gaps?
Keep the check number on every line and mark the course on the dish list. The workbook finds the gap between the last starter served and the first main fire.
How many ticket lines can it hold?
The sample has 505 lines and 40 spare rows. Insert rows above the last row and copy the formulas down; the named ranges stretch with the rows.
Do I need macros?
No. Every result is a standard worksheet formula.