Multi-Outlet F&B Performance Comparison Dashboard: Compare Revenue per Seat, Cost and Labour Across Outlets
Full description
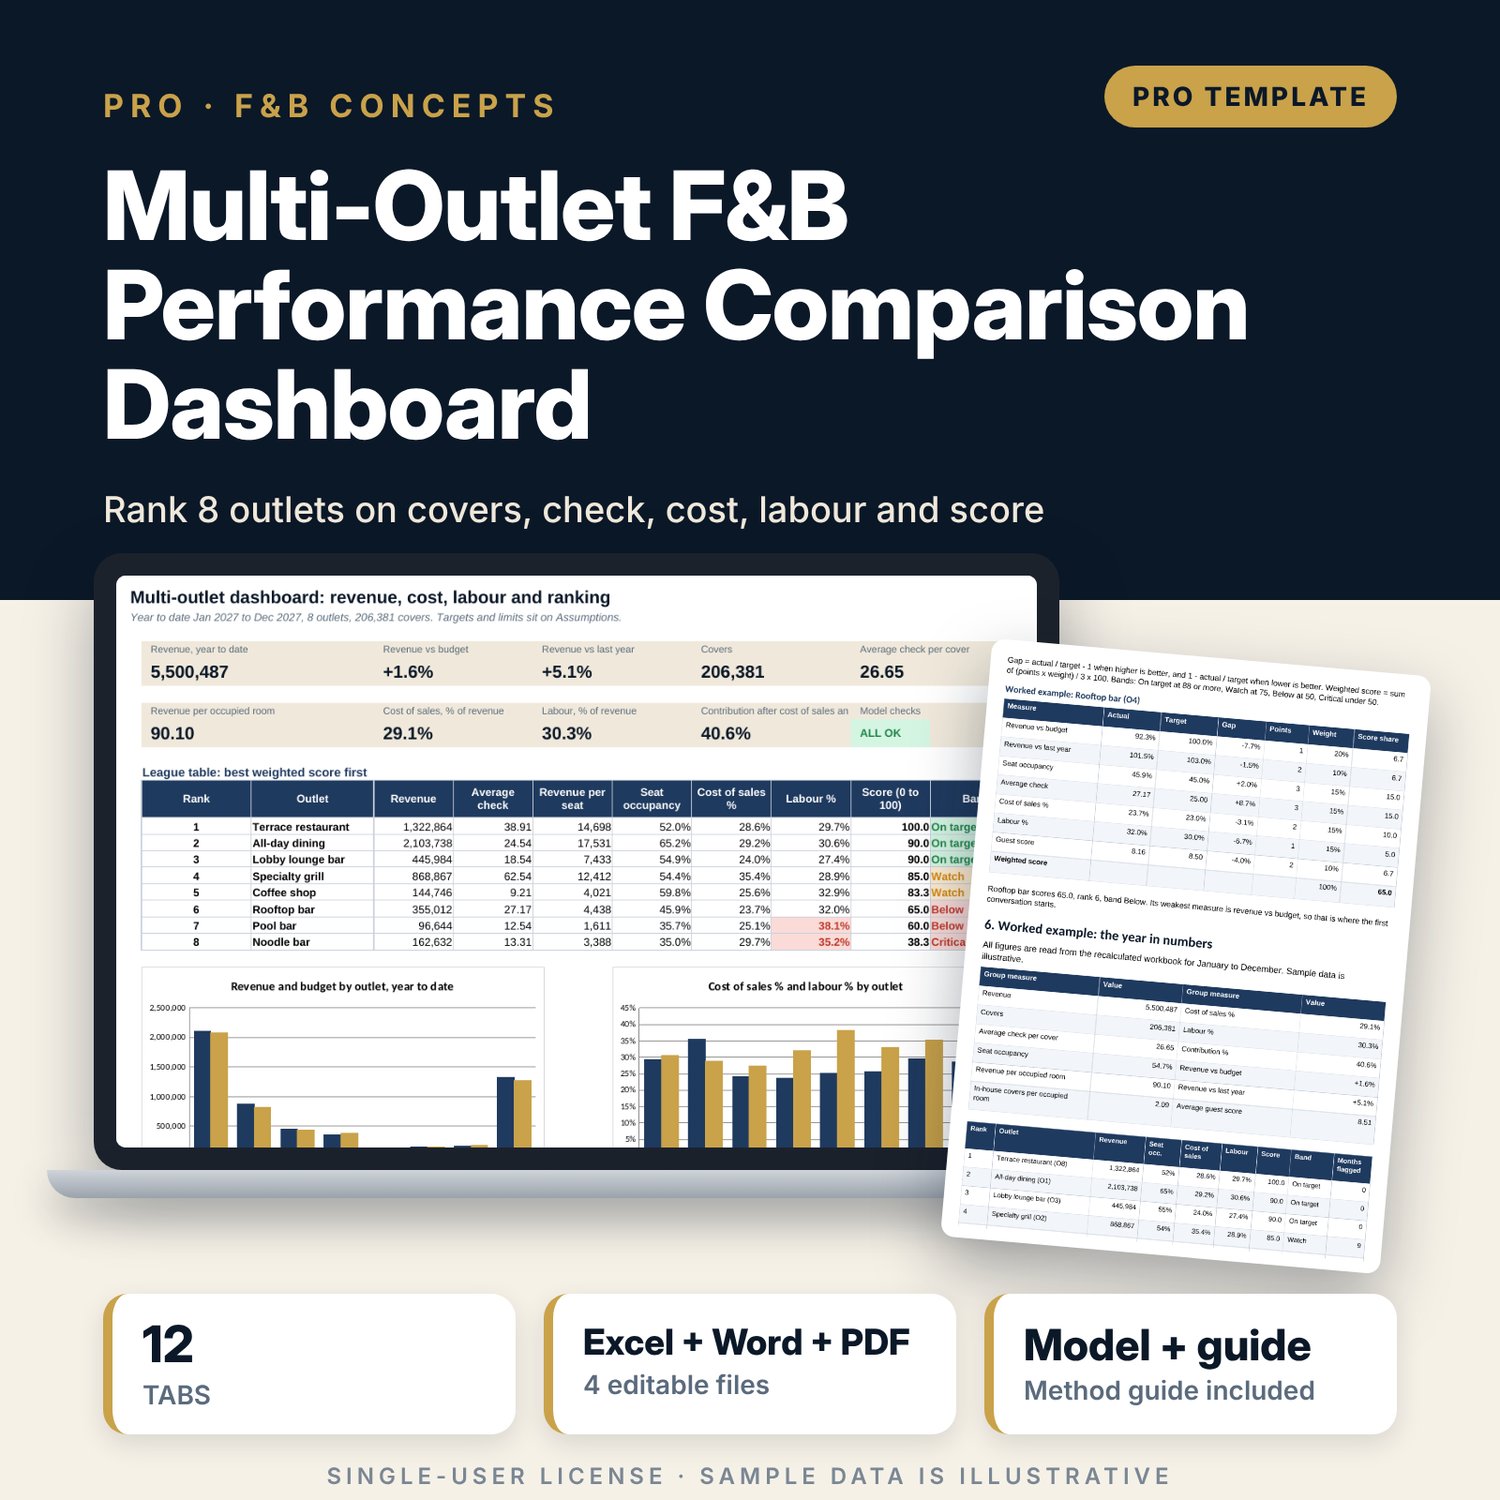
For general managers, food and beverage directors and controllers who run several restaurants, bars and cafes and need one fair comparison each month. The workbook holds 8 outlets with 96 sample outlet-months, calculates seat occupancy, average check, revenue per seat, cost of sales %, labour %, contribution and variance to budget and last year, scores seven measures against targets into a ranked scorecard, shows one measure by month and forecasts the next three months under three scenarios. A companion input sheet collects one outlet month and produces the row to paste, and a 12-page guide sets the definitions, the monthly close and the review forms.
What is inside
- Multi_Outlet_Dashboard.xlsx: 12 tabs, 3,762 formulas, 3 native charts, 23 drop-down and input rules
- Outlets: register of 8 outlets with seats, services, targets, data owner and submission status; Outlet Data: 96 sample rows and 12 spare rows
- Outlet Metrics: 26 columns per row, row flags and a data check; Summary: year to date by outlet and group
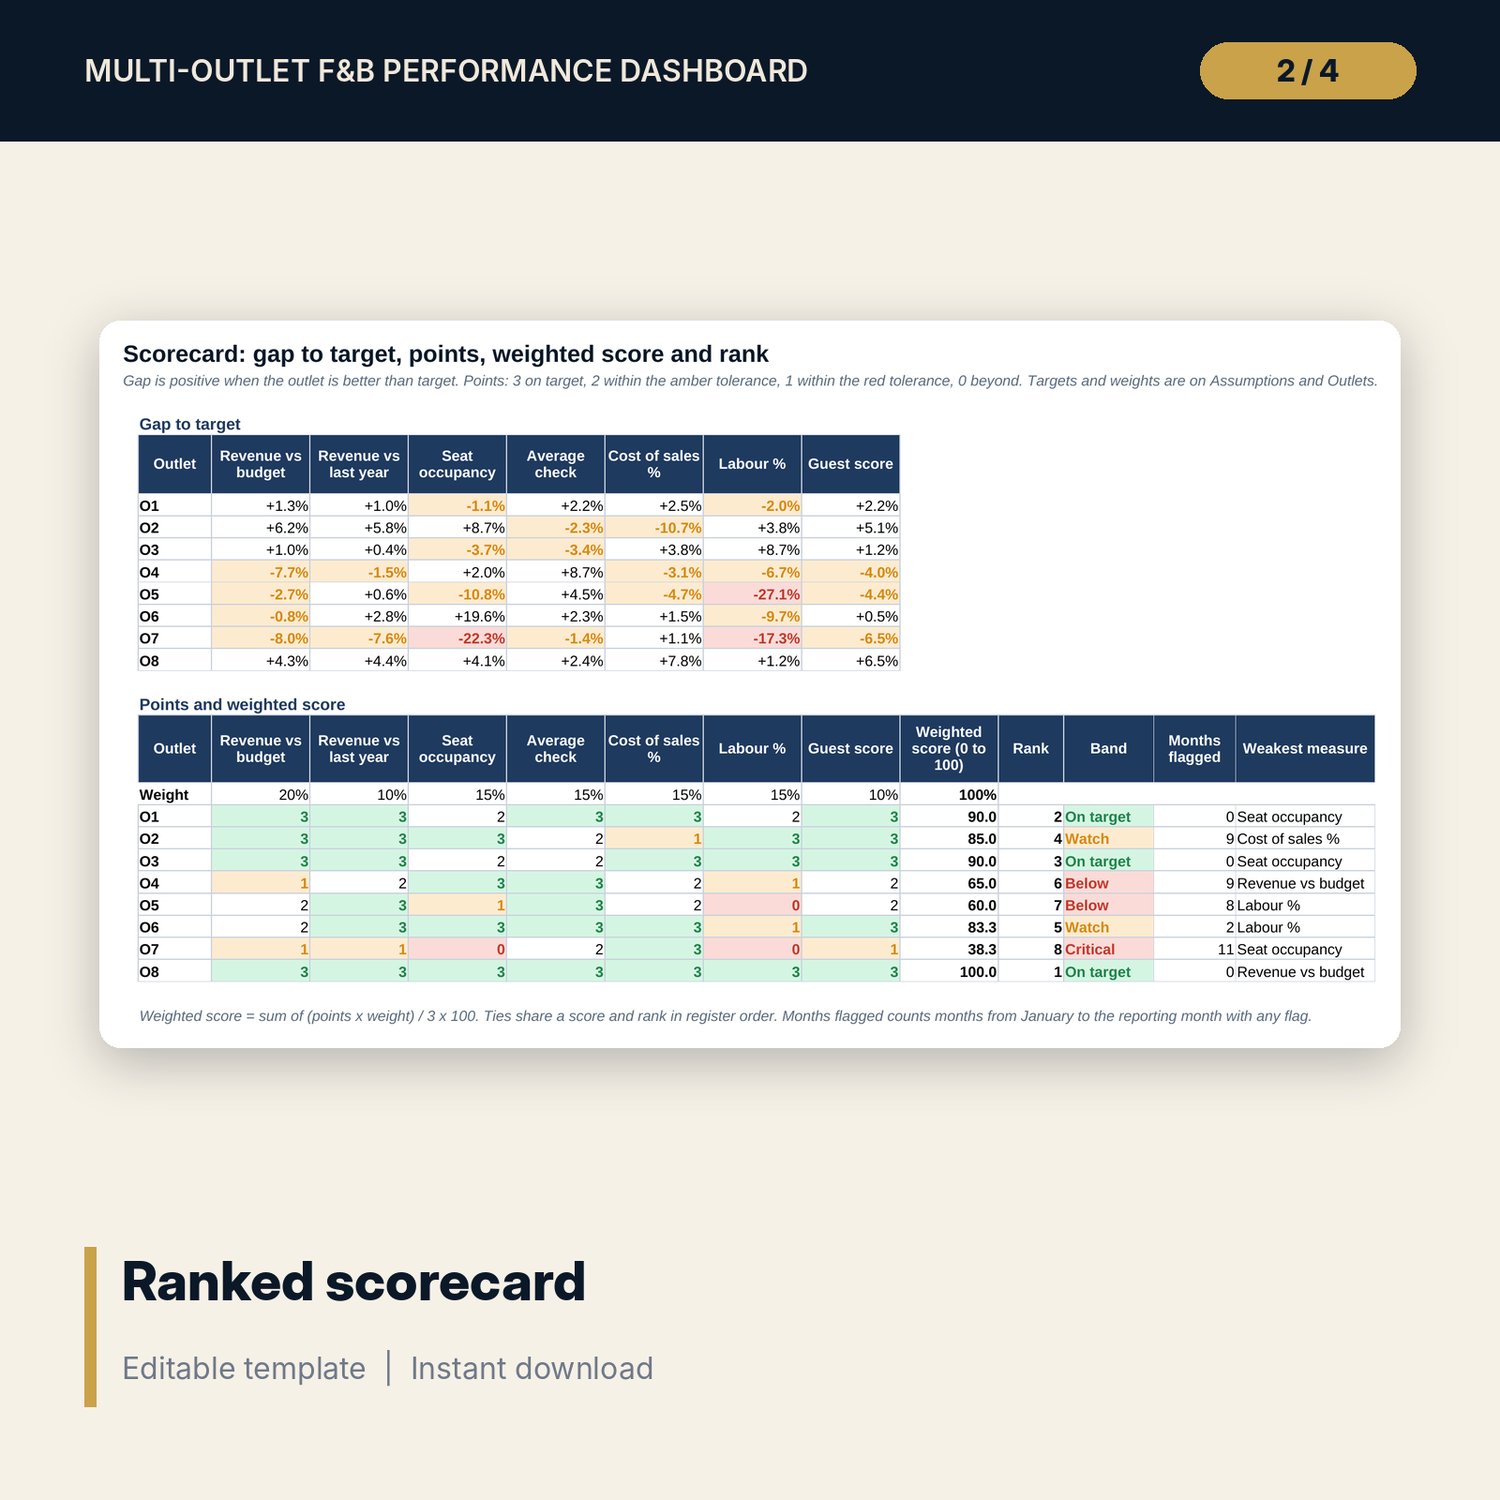
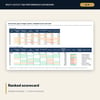
- Scorecard: 7 measures scored 3 to 0, weighted score, rank, band and weakest measure; Trend: one selectable measure by outlet and month
- Forecast: next three months, Base, Upside and Downside scenarios and a 25-cell covers against check grid
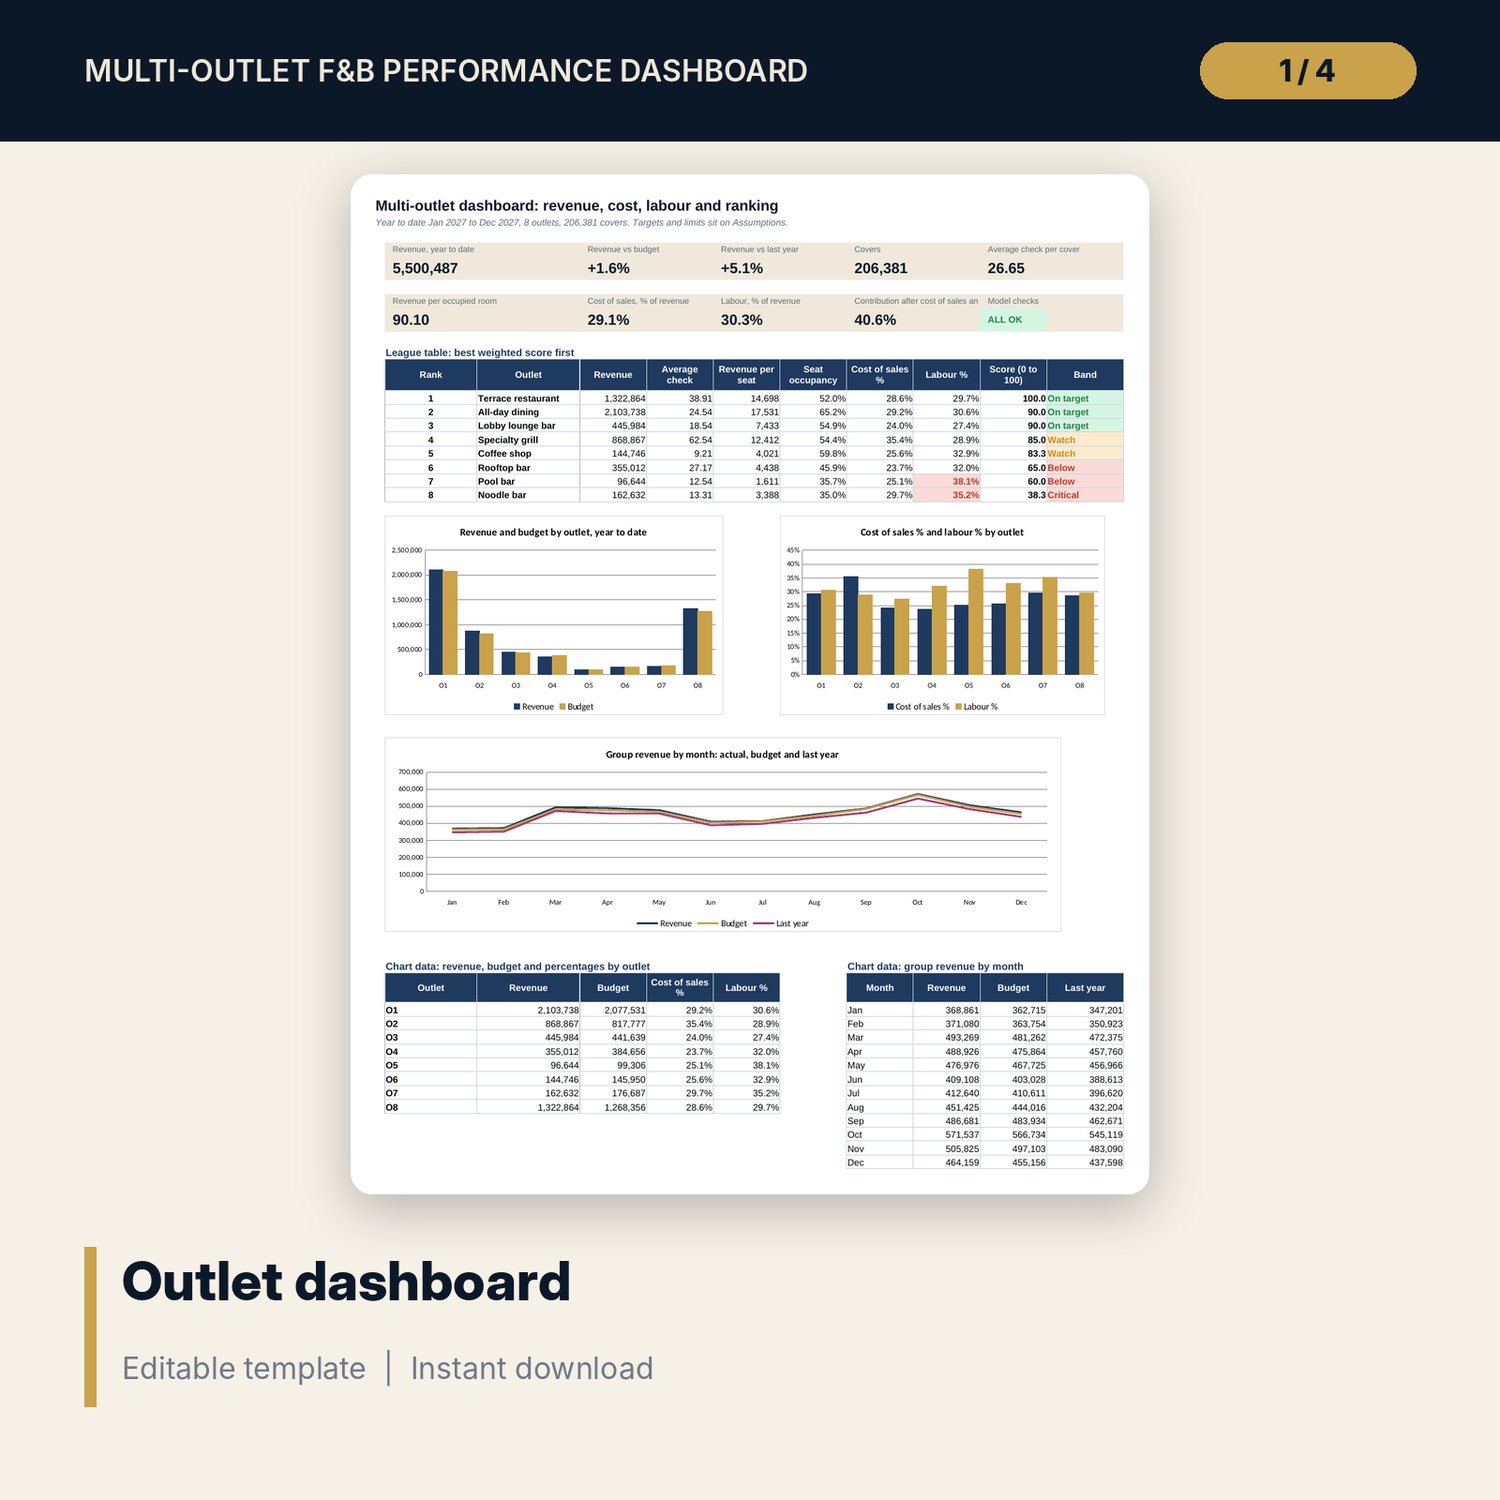
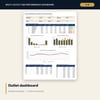
- Dashboard with 9 tiles, a check tile, a league table and 3 charts; 13 integrity checks; Method tab with 17 documented calculations
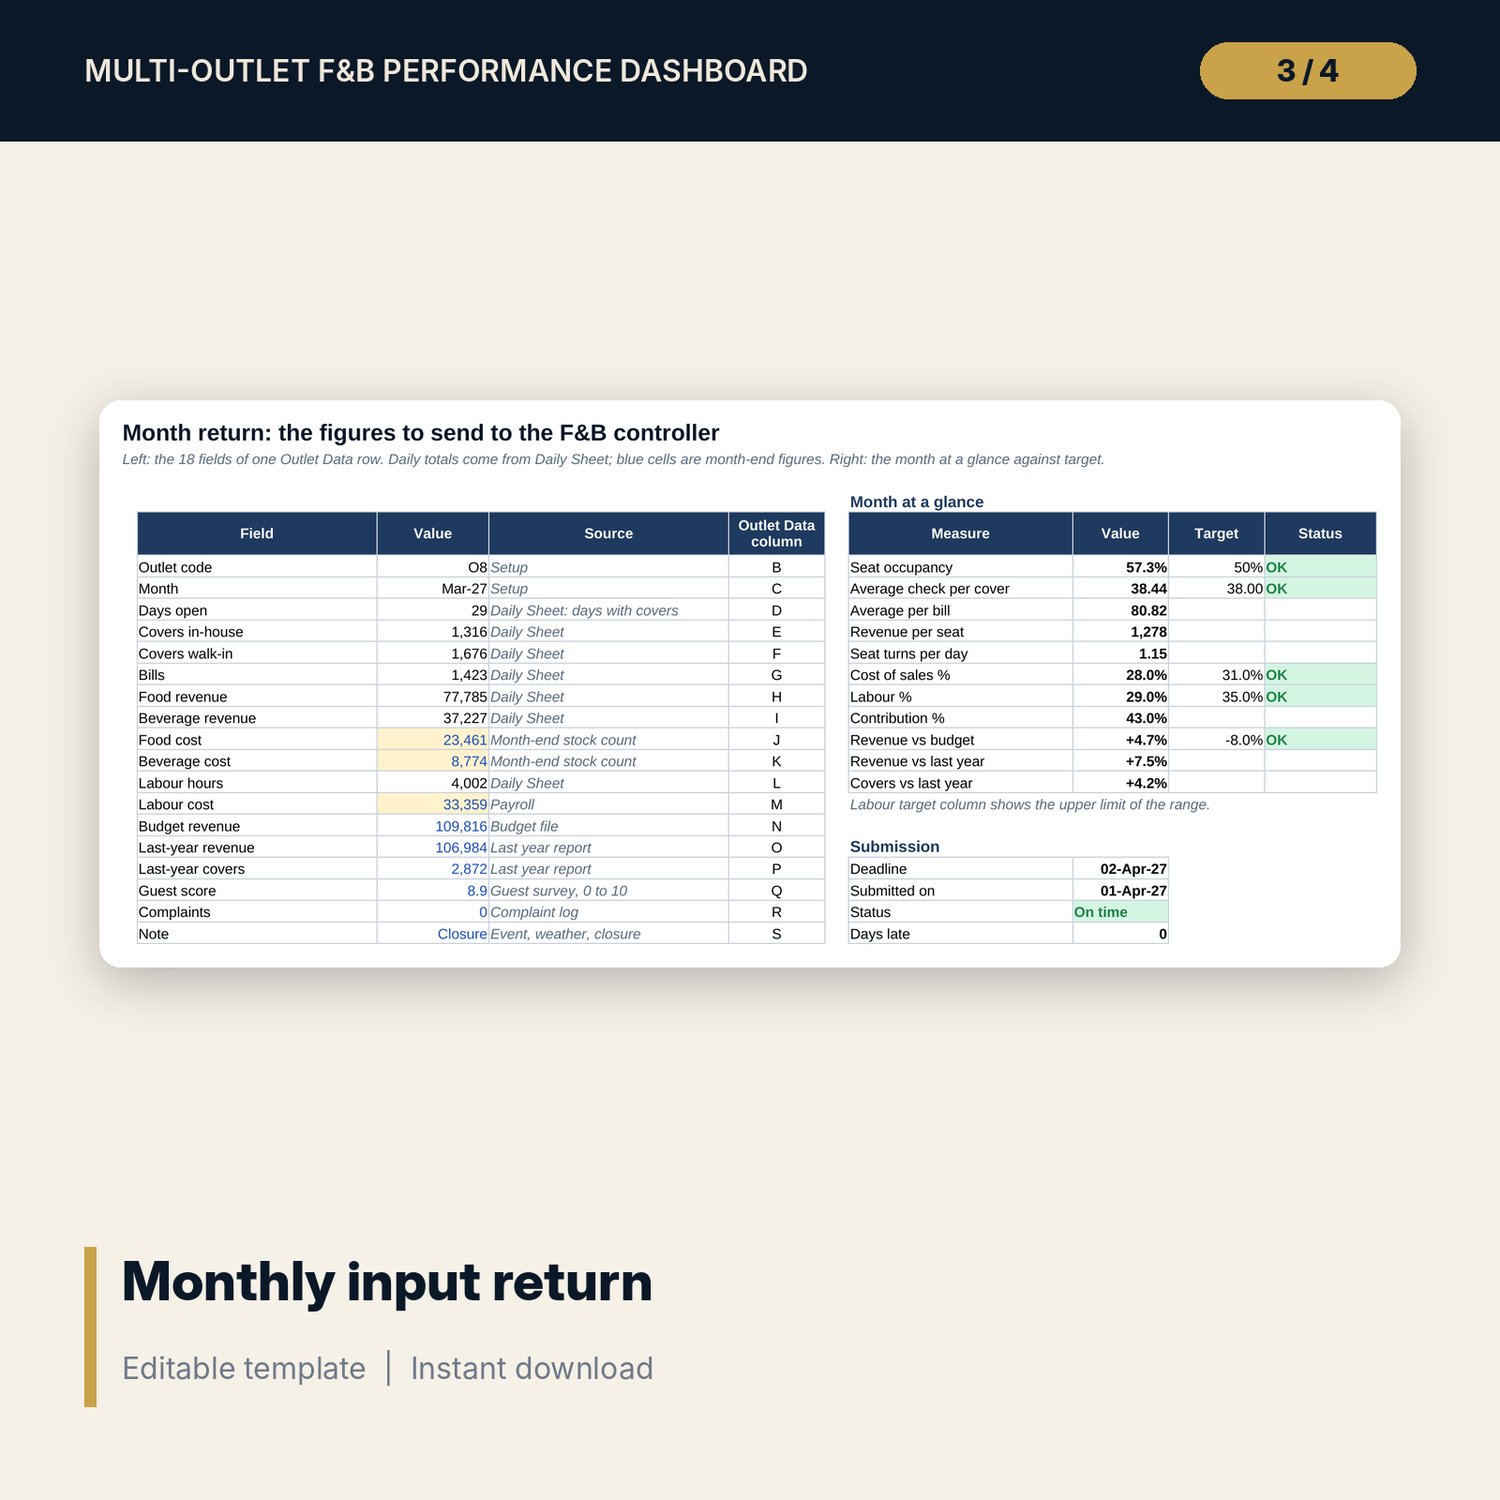
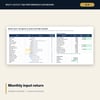
- Multi_Outlet_Dashboard_Monthly_Input_Sheet.xlsx: 5 tabs, 359 formulas, a daily sheet for 31 days, a month return, a paste row and 10 checks
- Multi_Outlet_Dashboard_Guide.docx and PDF: 12 pages with definitions, a monthly close plan, the scorecard method, a worked example read from the workbook, review forms and an 18-line checklist
- README.txt and LICENSE-and-Terms.txt
How it works
- Set the reporting month, targets, alert limits and weights on Assumptions, and the seats and services of each outlet on Outlets.
- Each outlet manager completes the monthly input sheet. Paste its row into Outlet Data.
- Read Summary, the Scorecard and the flags. Pick a measure on Trend.
- Pick a scenario and read the three-month forecast and the covers against check grid.
- Confirm that Checks shows ALL OK and hold the month-end review with the guide's form.
Details
- Formats: 2 Excel workbooks (.xlsx), 1 guide in Word (.docx) and PDF, English
- Software: Excel 2016 or later, or LibreOffice Calc 7 or later
- No macros, no external links, no data tables, no array formulas
- 4 files plus README and license; instant digital download
Good to know
- Sample data is illustrative. Replace it with your own figures.
- The files are planning tools, not financial advice. Verify local requirements for wages, records and food safety.
- Contribution is before rent, energy, marketing and overhead. Targets and weights are inputs you set.
- Single-user license. Do not redistribute.
FAQ
How many outlets does it handle?
8 outlets with 12 months each. To use fewer, leave the unused rows blank on Outlets and Outlet Data and set the rows you keep.
Where do the outlet figures come from?
Covers and revenue from the point-of-sale system, cost from the stock count, labour from payroll. The input sheet has a field for each.
Can I change the targets, limits and scoring weights?
Yes. Targets, alert limits, band tolerances, cut-off scores and the seven weights are inputs on Assumptions and Outlets.
How is the ranking built?
Each of seven measures earns 3, 2, 1 or 0 points from its gap to target. Points are weighted into a score from 0 to 100, then ranked.
Do I need macros or add-ins?
No. Every result is a standard worksheet formula.