Toolbox Talk Statistics PPT
🚧 Toolbox Talk Statistics – A Smarter Way to Track Safety! 🦺📊
🔍 Key Features of Our TBT Statistics Dashboard:
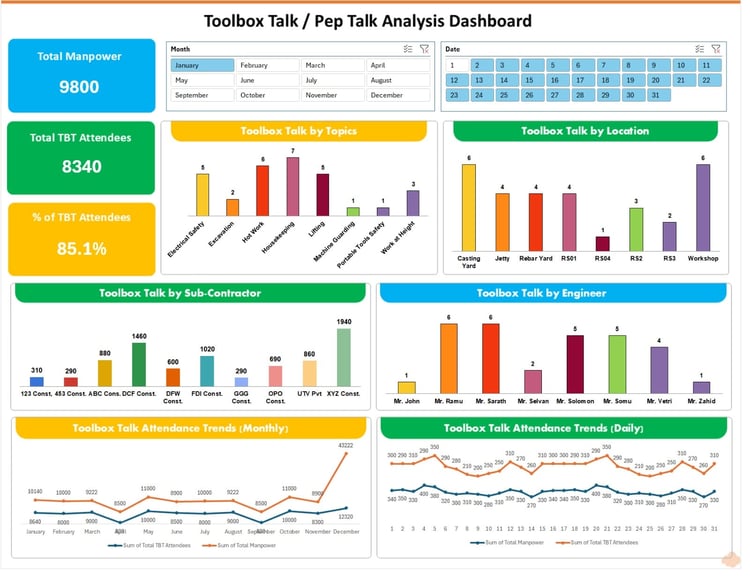
👷♂️ Total Manpower vs. TBT Attendees – Compares the total workforce with actual attendees at different locations, helping identify engagement gaps. 📊
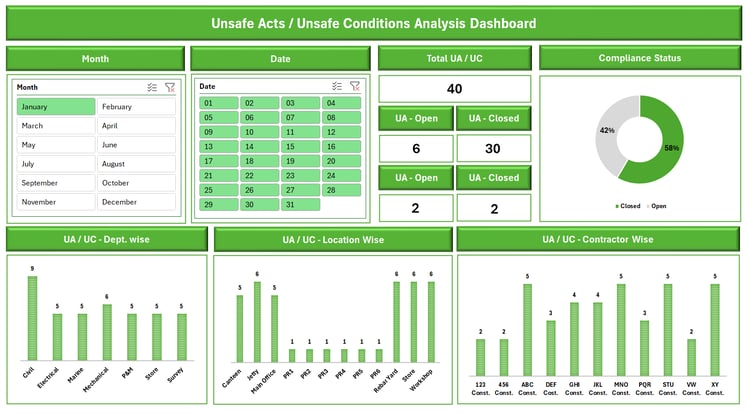
📌 Location-Wise Analysis– Shows how different locations are performing in terms of safety talks, making it easier to focus on low-participation areas. 🎯
📈 Attendance Percentage Indicators – Quick visual representation of TBT participation rates (both daily and monthly) using easy-to-read gauge charts. ⚖️🔄
📊 Data-Driven Insights for Improvement – Helps the EHS team analyze trends, improve participation, and strengthen the overall safety culture. 🚀
With such real-time insights, we can take proactive steps to boost engagement and ensure a safer work environment for everyone! 💪