
Rent vs Buy Calculator (Australia, all states) – Excel
NEW: Google Sheets edition included. Prefer Google Sheets? Your download includes a PDF with a one-click link to make your own copy (parity-tested: every formula cell matches the Excel version).
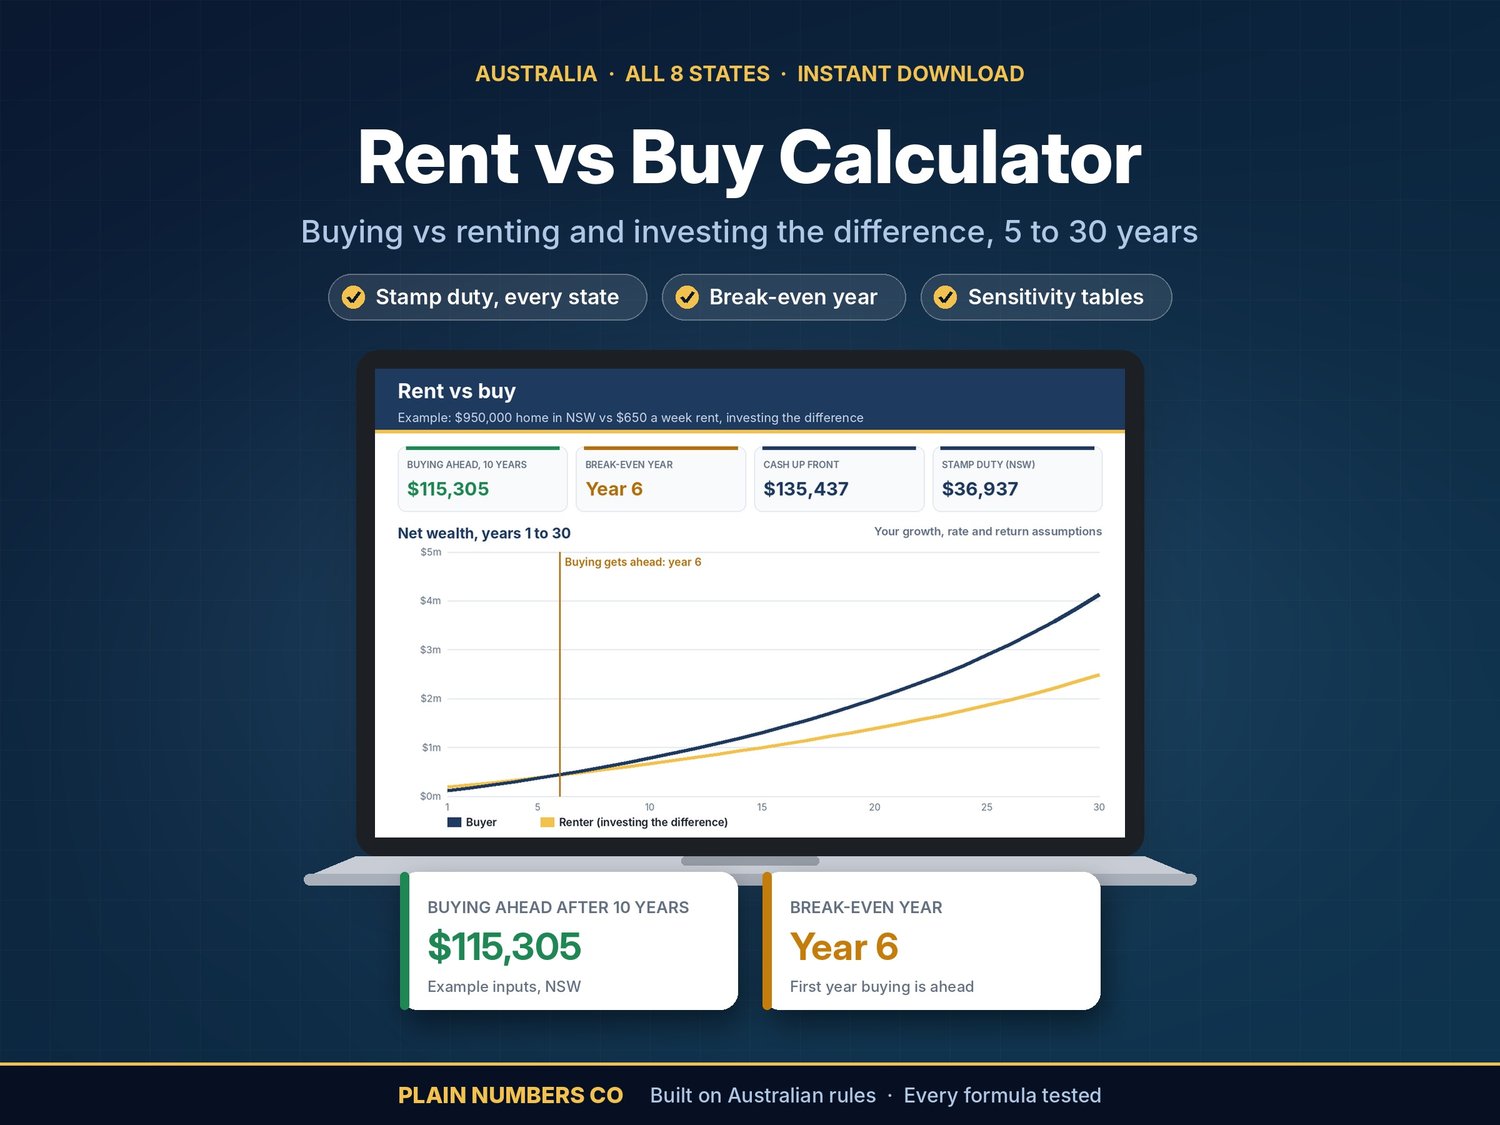
Will buying a home leave you better off than renting and investing the difference, and from which year? Enter the price, your deposit, the loan, the rent, and the growth and returns you want to assume. The workbook gives you the dollar difference after any period from 5 to 30 years, and the break-even year.
- Net wealth for buyer and renter, year by year.
- The buyer has the home, less selling costs and the loan, plus any investments.
- The renter has their investments.
- It's a like-for-like comparison. The renter invests the cash the buyer spends up front. Each year, whichever side spends less invests the difference, so both spend the same money.
- The break-even year: the first year buying comes out ahead.
- The total cost of each side.
- Buying: stamp duty, lenders mortgage insurance, interest, owning costs (council rates, strata, insurance and maintenance) and selling costs, less the growth in the home's value.
- Renting: rent, less what your invested money earns. This is the opportunity cost of tying your deposit up in a home.
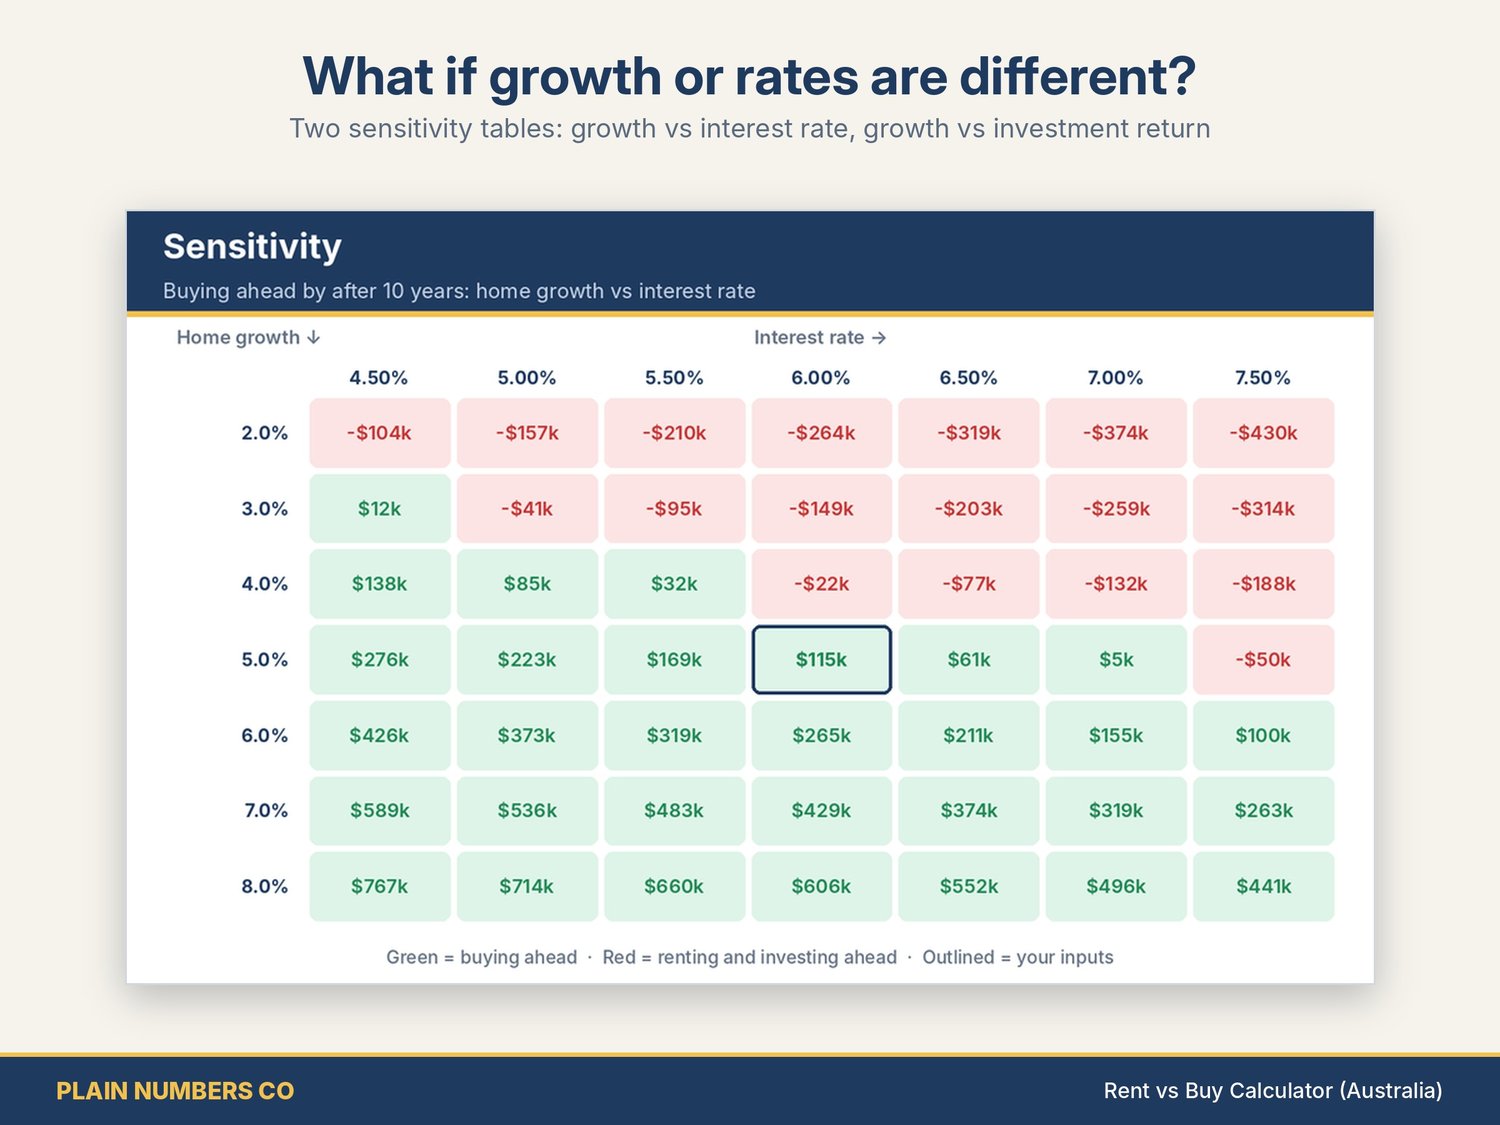
- Two sensitivity tables:
- home value growth against the interest rate;
- home value growth against the investment return.
- You choose the step sizes.
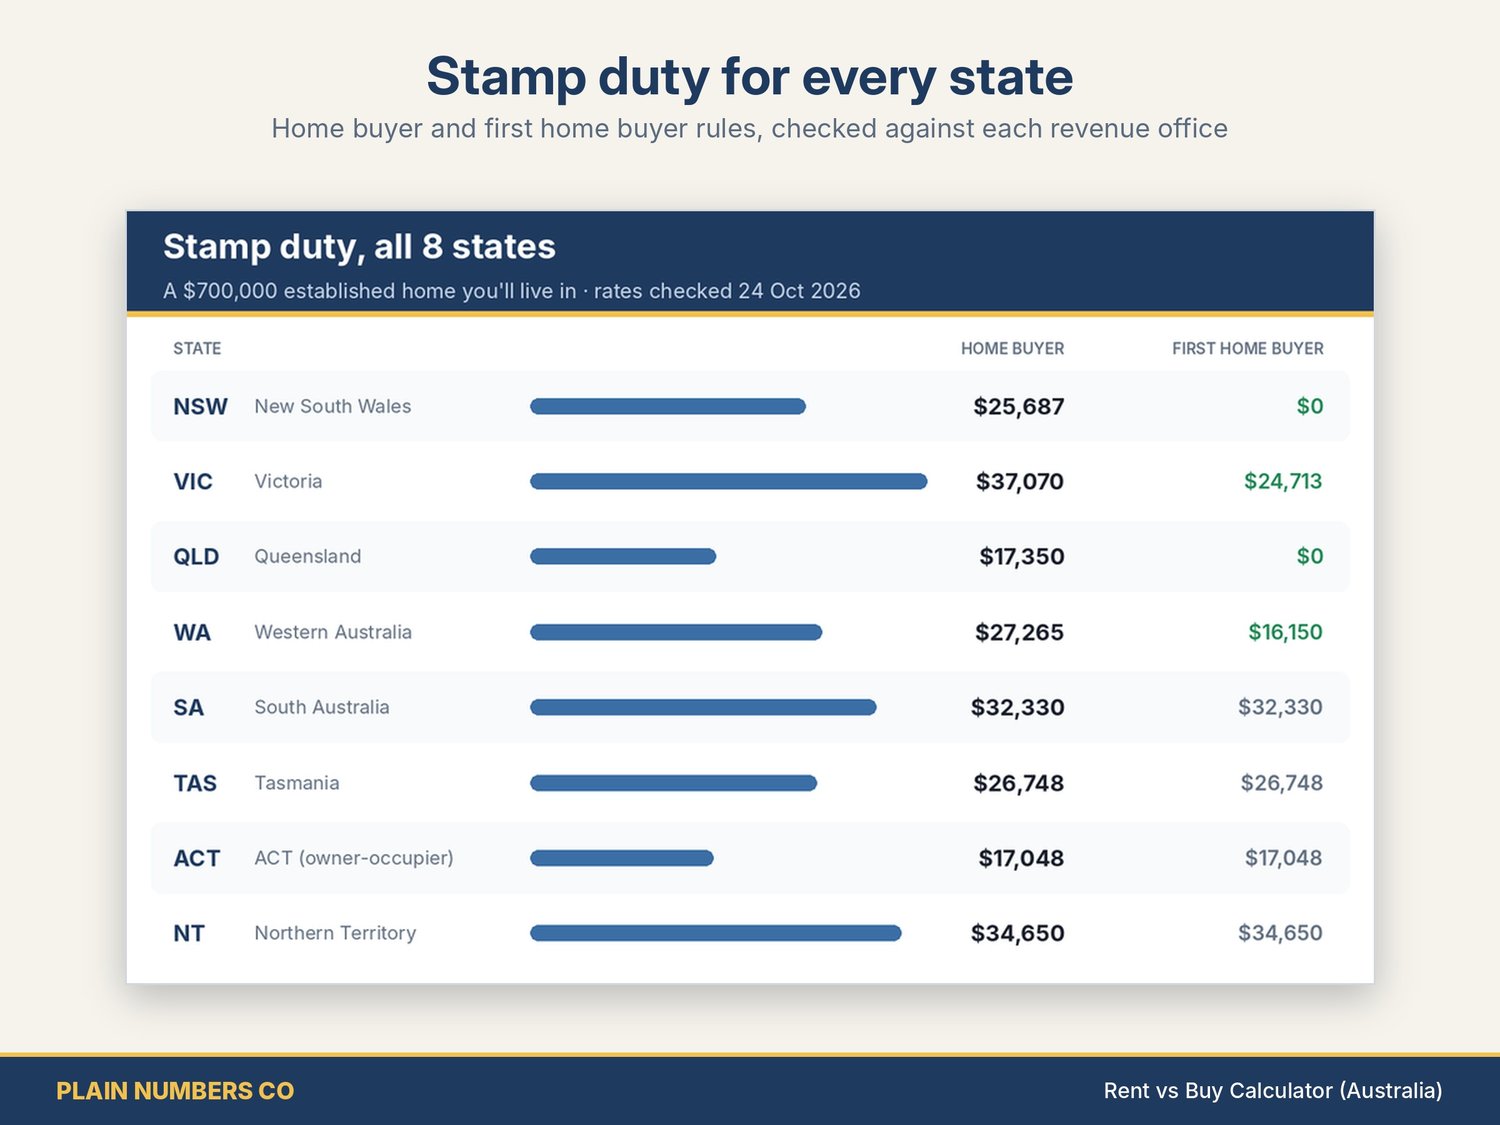
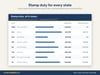
- Stamp duty for all 8 states and territories at your price, with rates checked against each state revenue office on 28 October 2026.
- It uses owner-occupier rates where a state has them (QLD home concession, ACT owner-occupier).
- It includes first home buyer rules:
- NSW: no duty to $800,000, then the concession to under $1m (Duties Act s 78A formula);
- VIC: no duty to $600,000, sliding scale to $750,000;
- QLD: first home concession, and new homes;
- WA: first home owner rate from 7 May 2026;
- SA: new homes;
- ACT: no duty under the Home Buyer Concession Scheme (no income or price cap from 1 July 2026).
- Where a concession isn't modelled, the workbook tells you, and you can type your own figure.
- An LMI reminder: if you borrow more than 80% and haven't entered a lender's quote, the workbook flags it.
Every assumption is yours: growth, interest rate, rent growth, owning cost growth and investment return. Nothing is presented as a forecast.
What's inside: Home page, Dashboard (8 key figures and 2 charts), Inputs, Results, Year by Year (years 0 to 30), Sensitivity, Stamp Duty, Checks, and Notes & Sources (every rate with its source and the date checked). Example figures are filled in so you can see how it works.
Works in Microsoft Excel and LibreOffice. Instant download.
Built and checked by a CPA. Every formula tested against a separate calculation.
Designed by Plain Numbers Co with the help of AI tools. Listing images are designed previews of the actual file.
30-DAY MONEY-BACK GUARANTEE: if it doesn't work for your situation, message us within 30 days. We'll fix it, or refund you in full if you'd rather. This is in addition to your rights under the Australian Consumer Law, which are not excluded.
General information only, not financial, tax or legal advice. It doesn't consider your personal circumstances. Check stamp duty with your state revenue office or conveyancer, and speak to a licensed adviser before deciding.