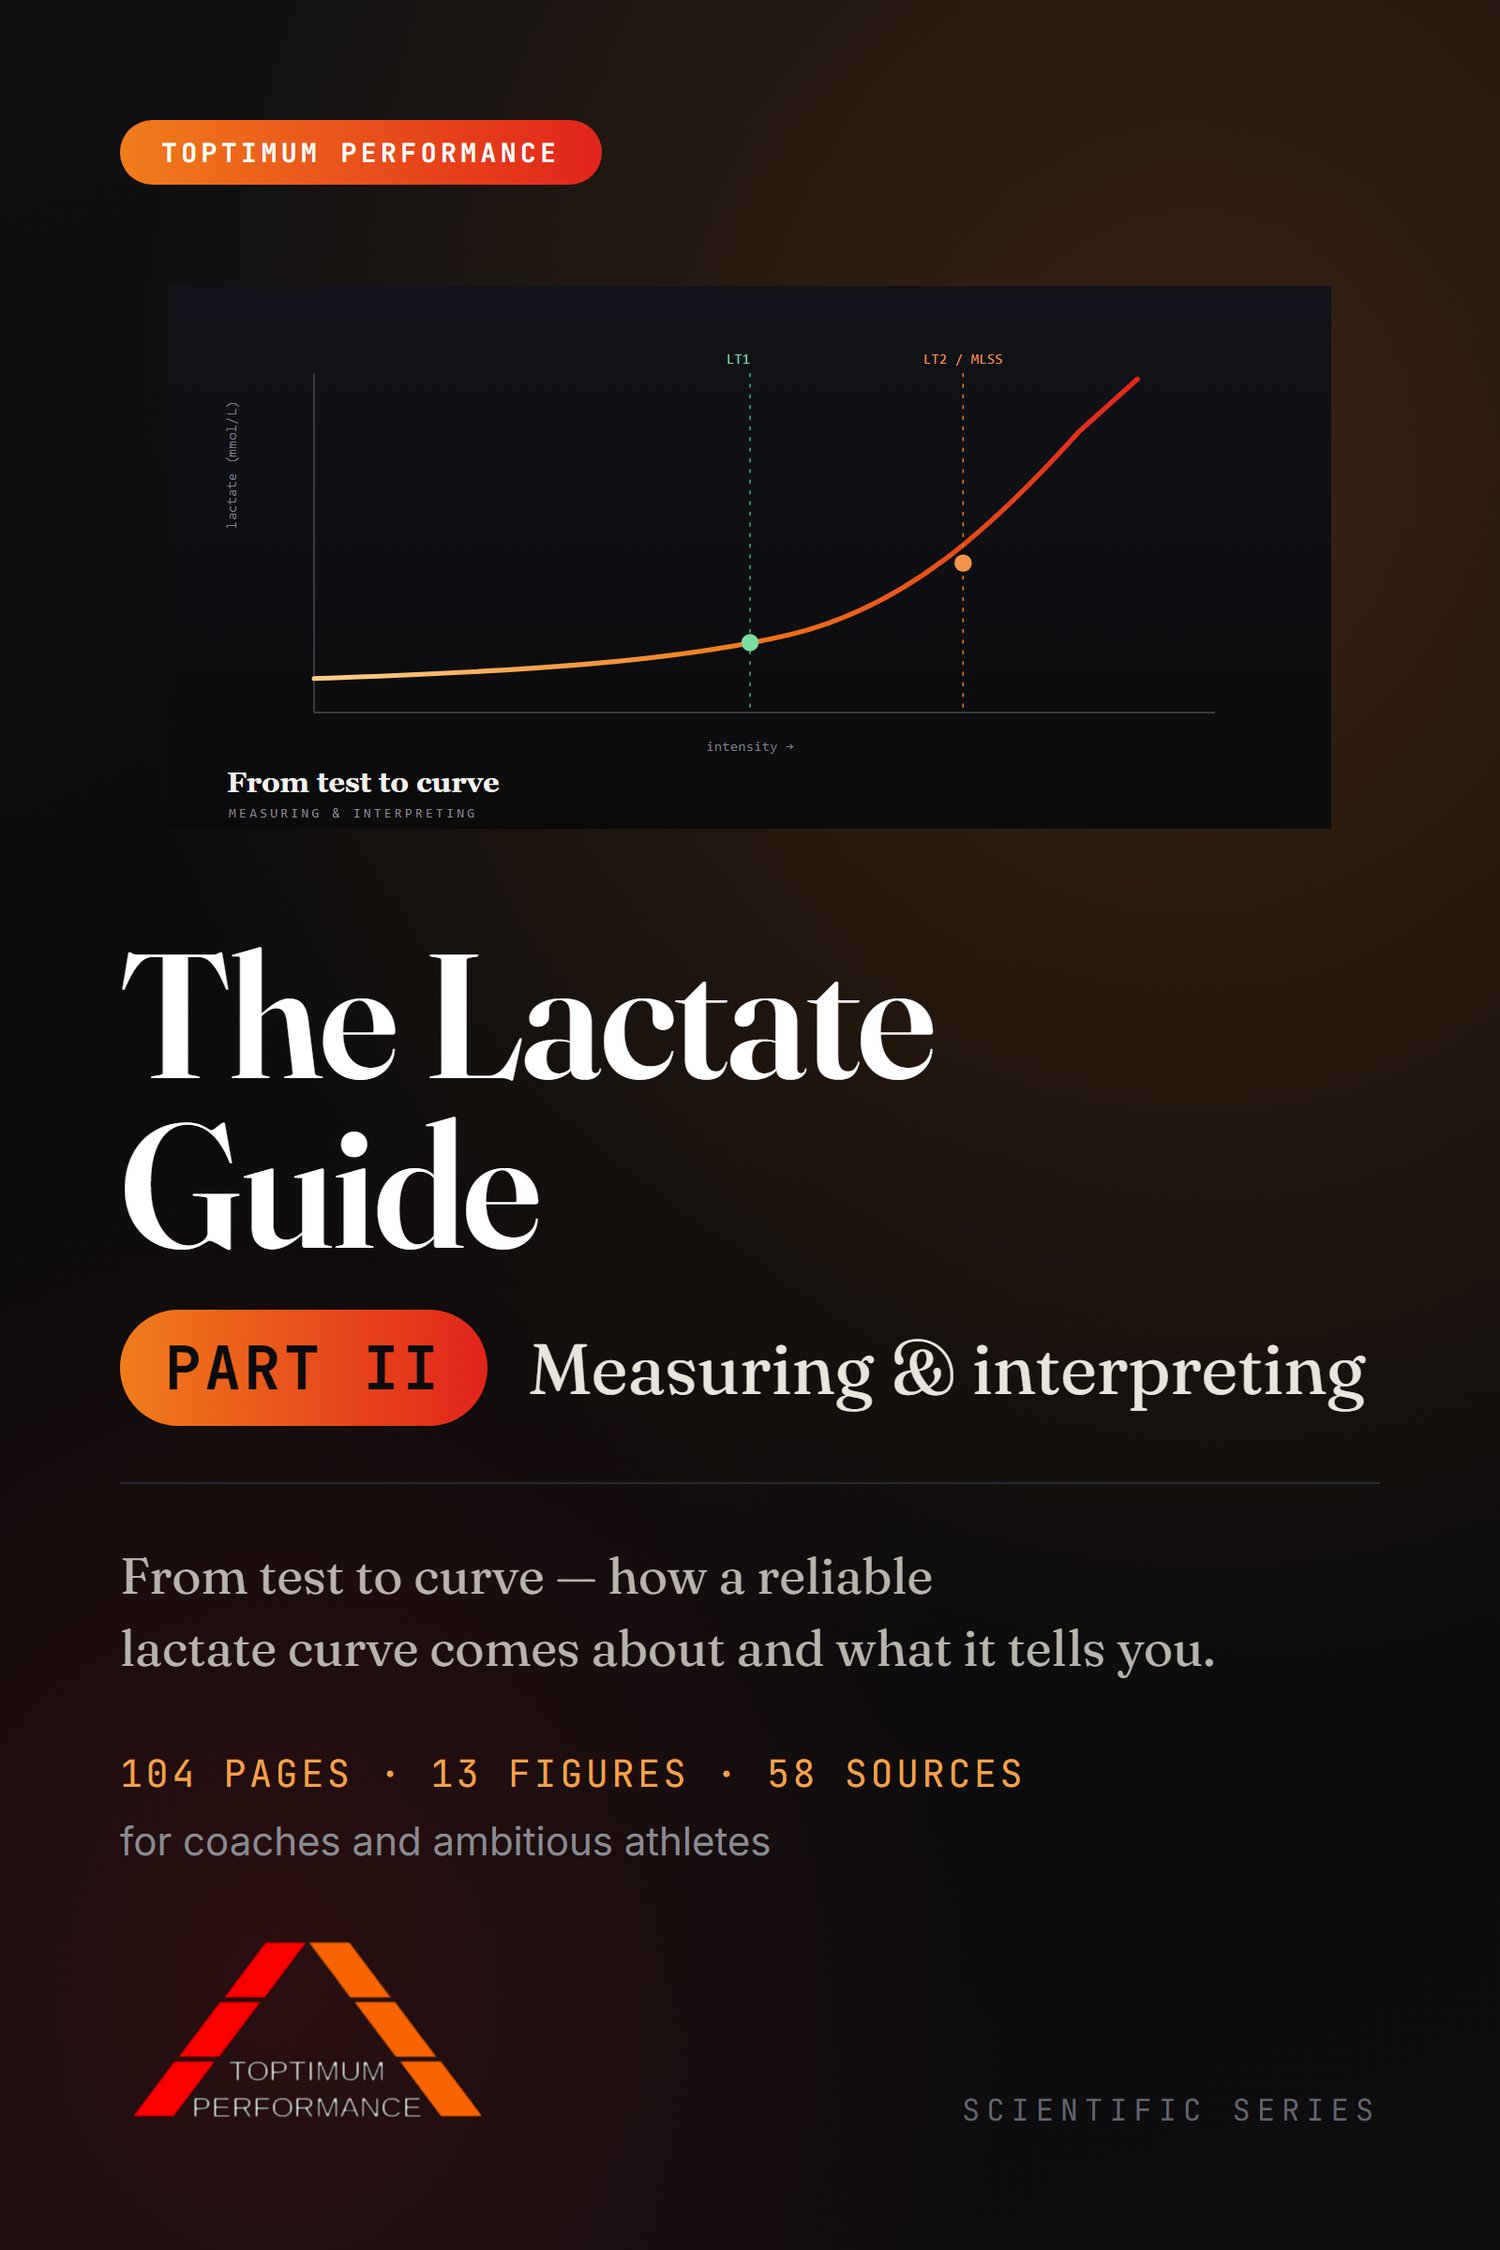
The Lactate Guide Part 2 - for coaches and ambitious athletes (EN)
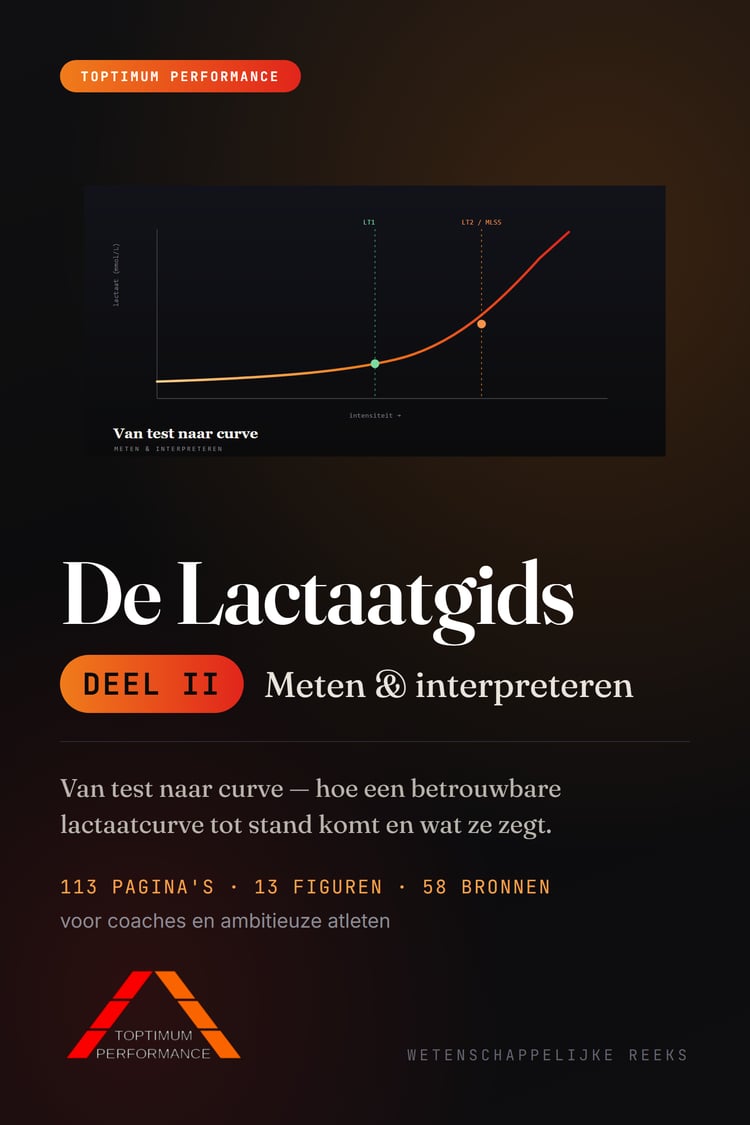
** From test to curve: how a reliable lactate curve comes about, and where it can quietly lie.**
A lactate curve looks objective: the athlete runs steps, the coach pricks blood, out comes a number. But between the drop and the training decision sit choices that steer the number without anyone noticing and those choices often shift the threshold more than weeks of training do.
This second part is about those choices. Which threshold is actually being measured. How long a step should last. Where the sample is taken, and when. What a shift means, and from when it is large enough to be called progress rather than noise.
**What's inside**
- Thresholds, turn points and transition zones
- Interpreting lactate curves, and measuring with multiple windows
- Carrying out the field lactate test correctly
- Protocol selection, sampling, measurement errors and pitfalls
- Factors influencing lactate values
- When to test and when not to, and how often to retest
- How heavily the step duration weighs: in the same eight runners the speed at 4 mmol/L was one and a half kilometres per hour higher with three-minute than with six-minute steps. Only the longer protocol matched the true steady state
- The typical measurement error and the smallest meaningful change: the two numbers without which every shift of the curve stays a guess
- Where a correct curve still lies: sampling site, timing, analyser and contamination, each with the direction in which the error pushes the value
- Why a lower curve can also mean exhaustion and how you tell that apart from progress
- What a threshold measurement after an hour and a half of running reveals, and why that is the real question for the marathon runner
- A glossary in which every technical term is briefly explained
**For whom**
Coaches and ambitious athletes who test themselves or have testing done, and who want to know when a number can be trusted. Part I is not a prerequisite, but anyone who knows the physiology underneath reads these curves more sharply.
**Extent**
104 pages
13 figures
58 scientific sources (with DOI where available)
Glossary