





EMA & Moving Averages Explained — The 20/50/200 Playbook (Visual Guide)
Moving averages are the first indicator every trader adds and the last one they learn to use properly. You put one on the chart, price crosses it a few times, you take a few losses, and it starts to feel random. The line was never the problem. The missing plan was.
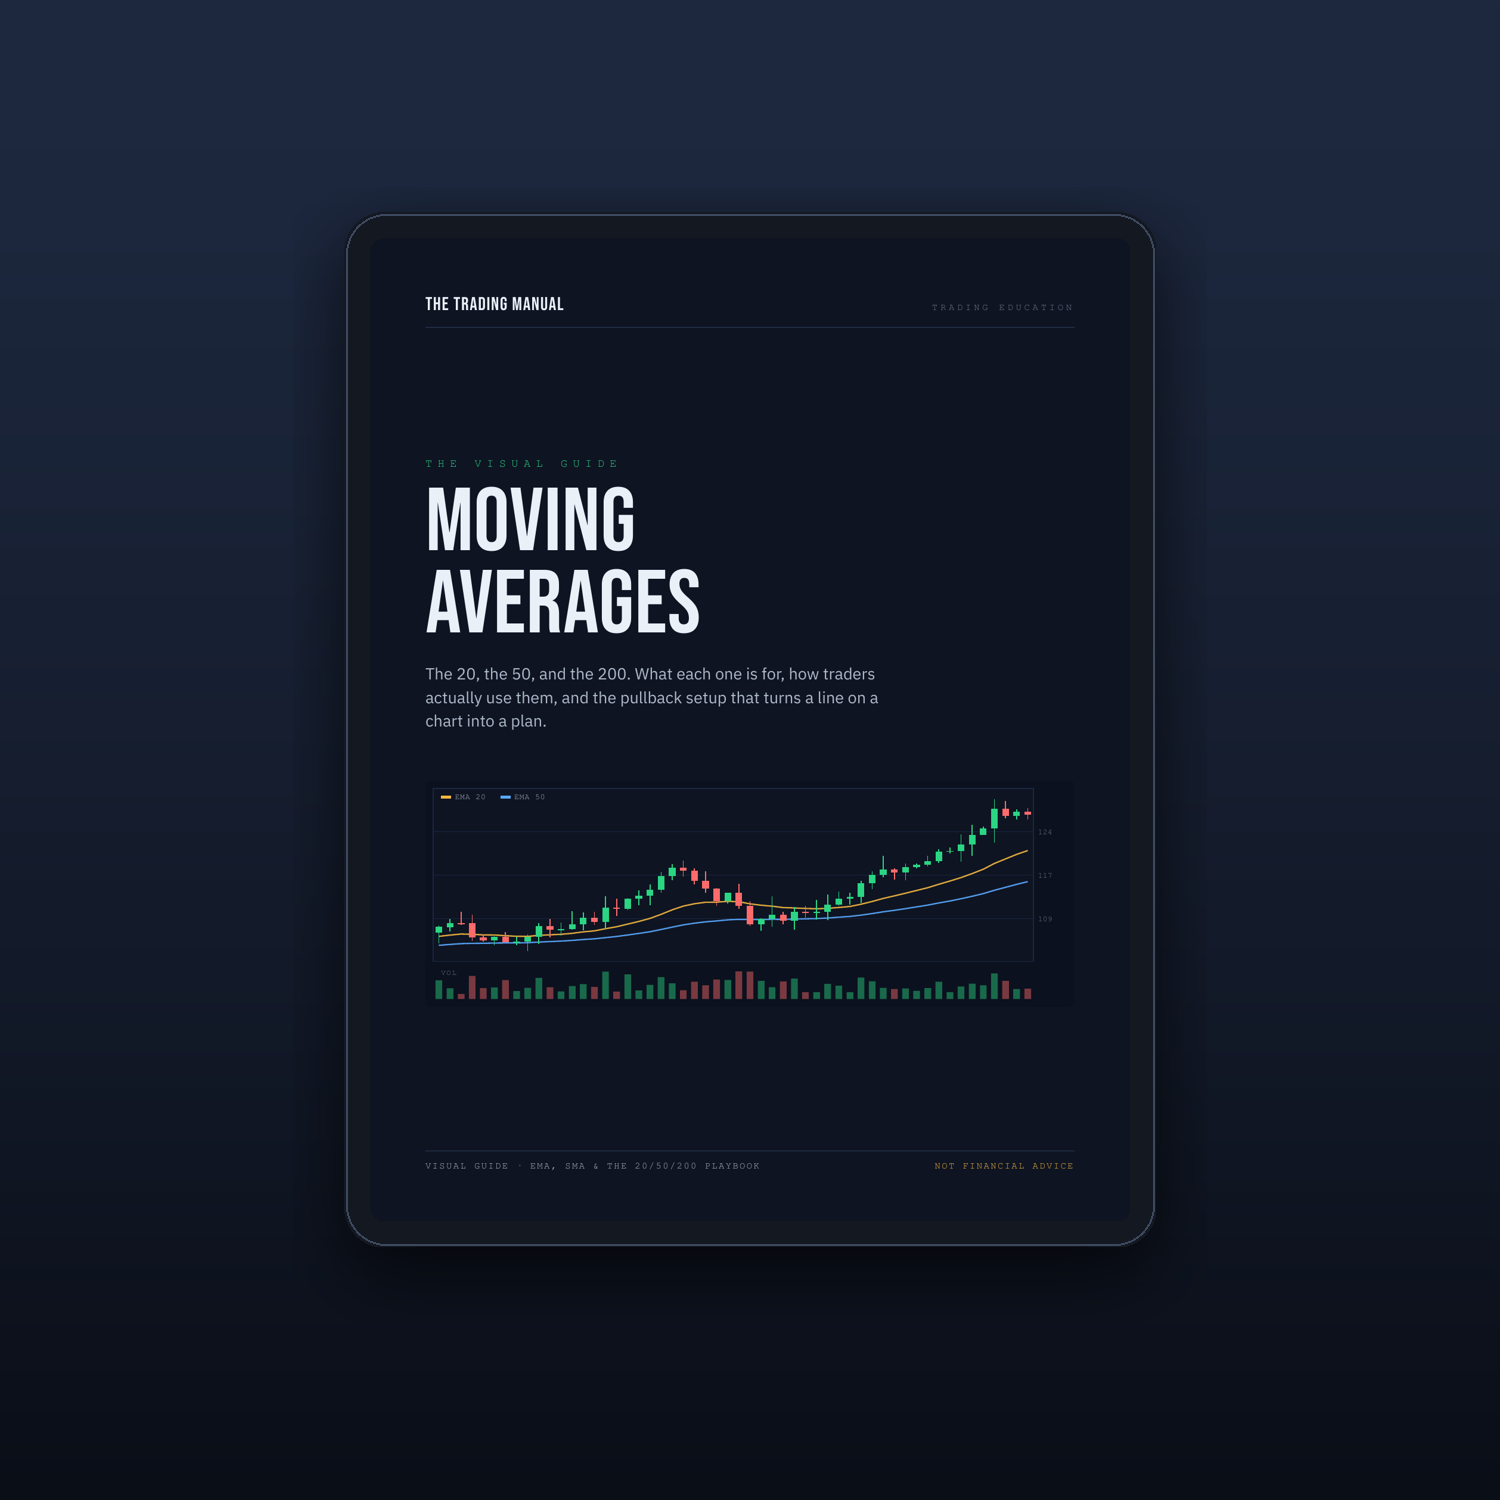
This visual guide gives you the plan. In 17 clean pages you will learn what the 20, the 50, and the 200 are each actually for, when the tool works, and the specific market condition where every moving-average signal fails.
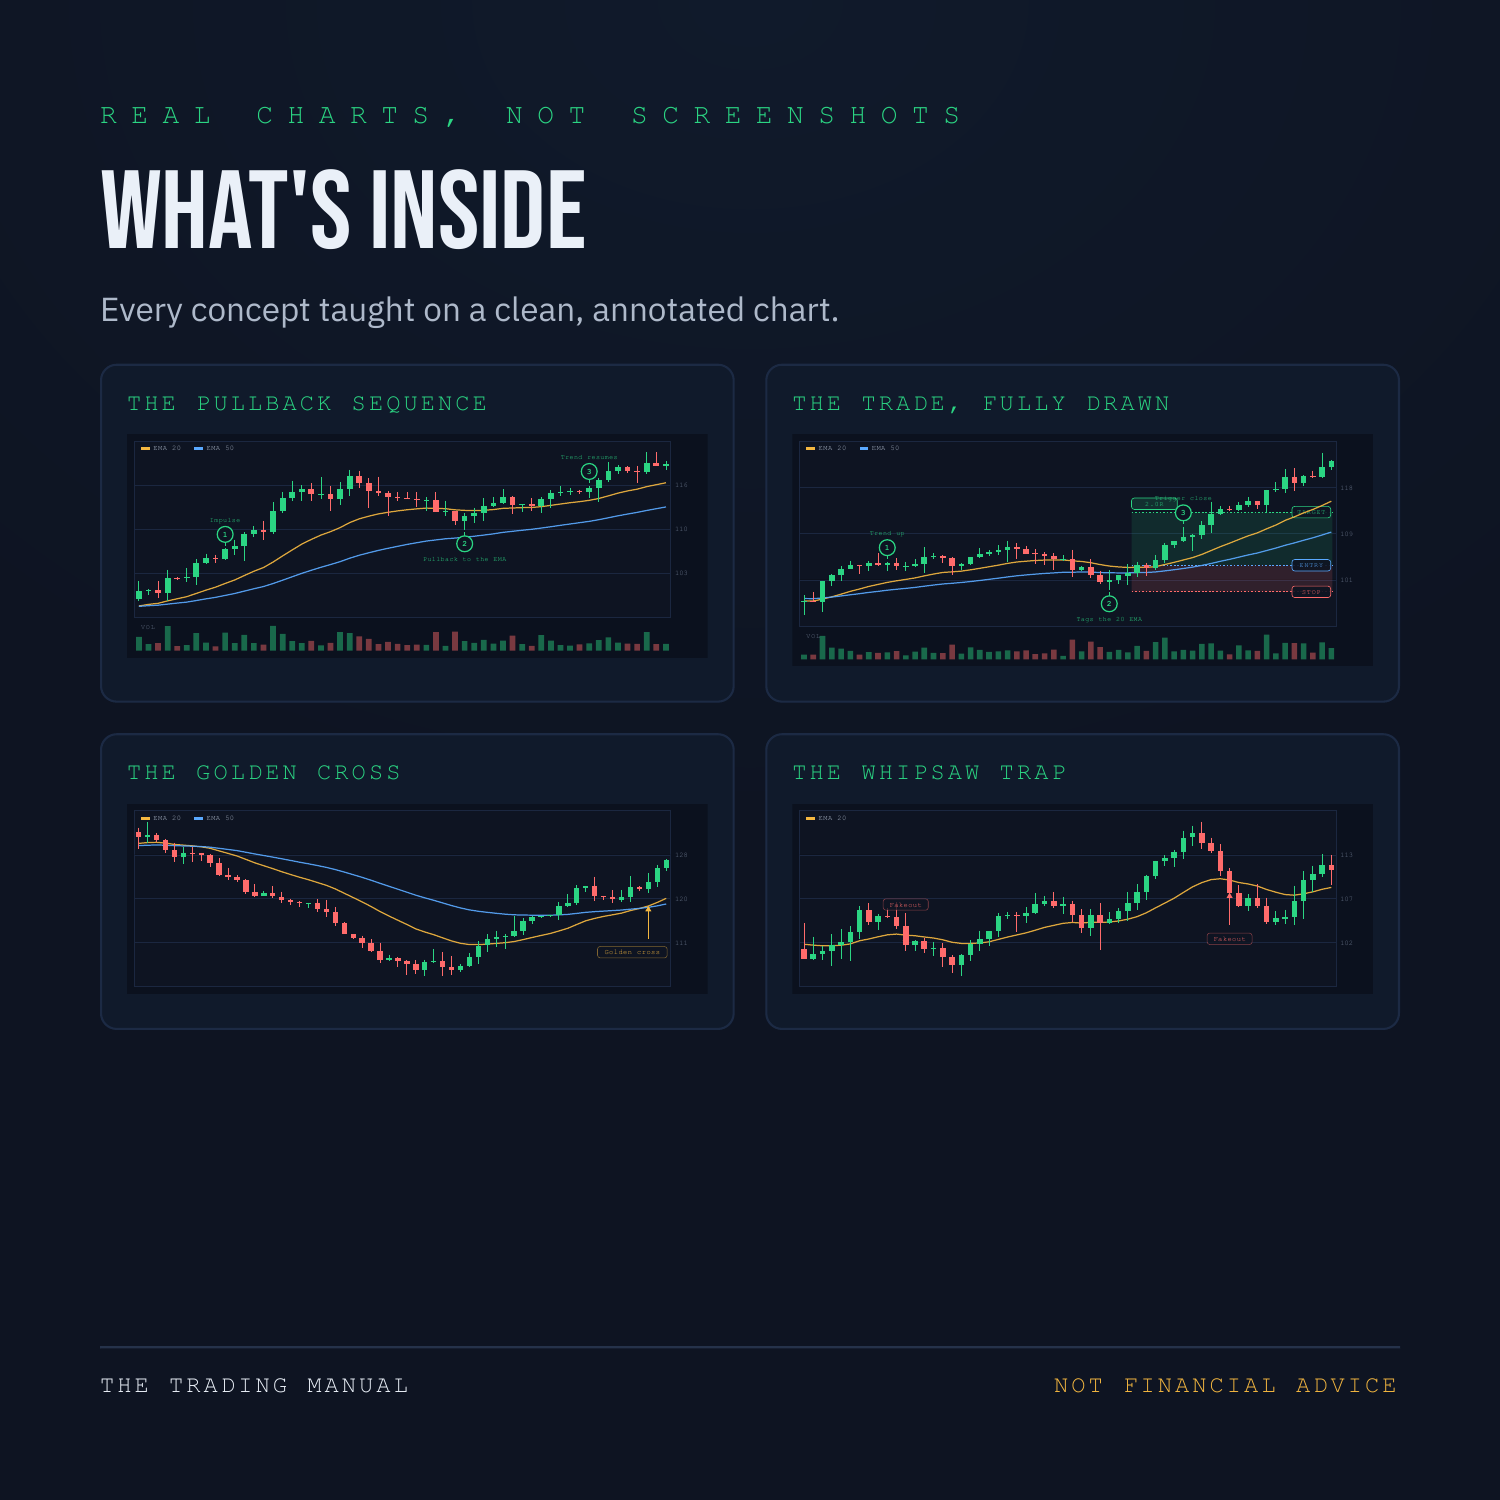
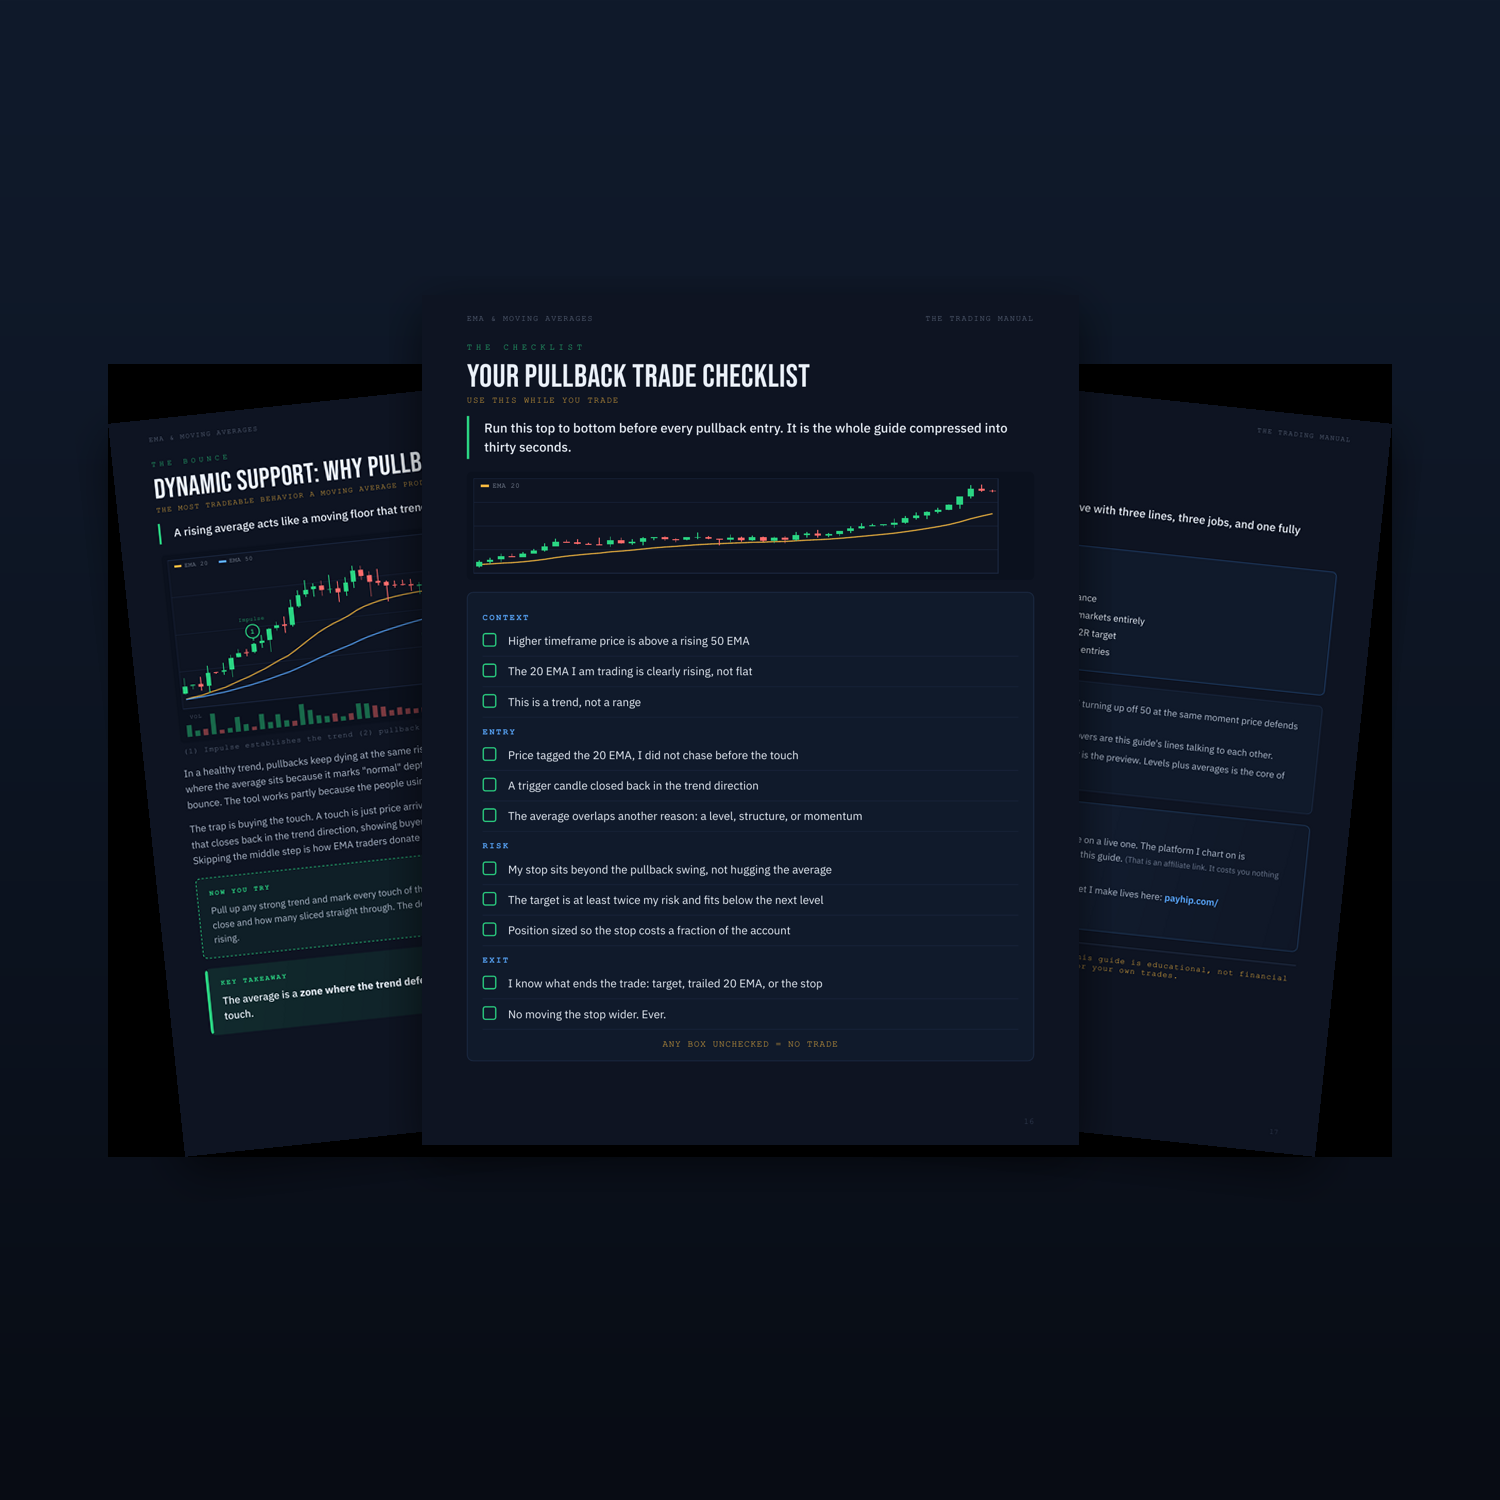
Every concept is taught on a hand-built, annotated chart with arrows and numbered steps pointing at exactly what matters. You will see the trend filter, the pullback bounce, the golden cross, and the whipsaw trap. It ends with a full trade playbook: the 20 EMA pullback drawn on a chart with the entry, stop, and target zones marked, plus a checklist you run live before every entry.
**What's inside:**
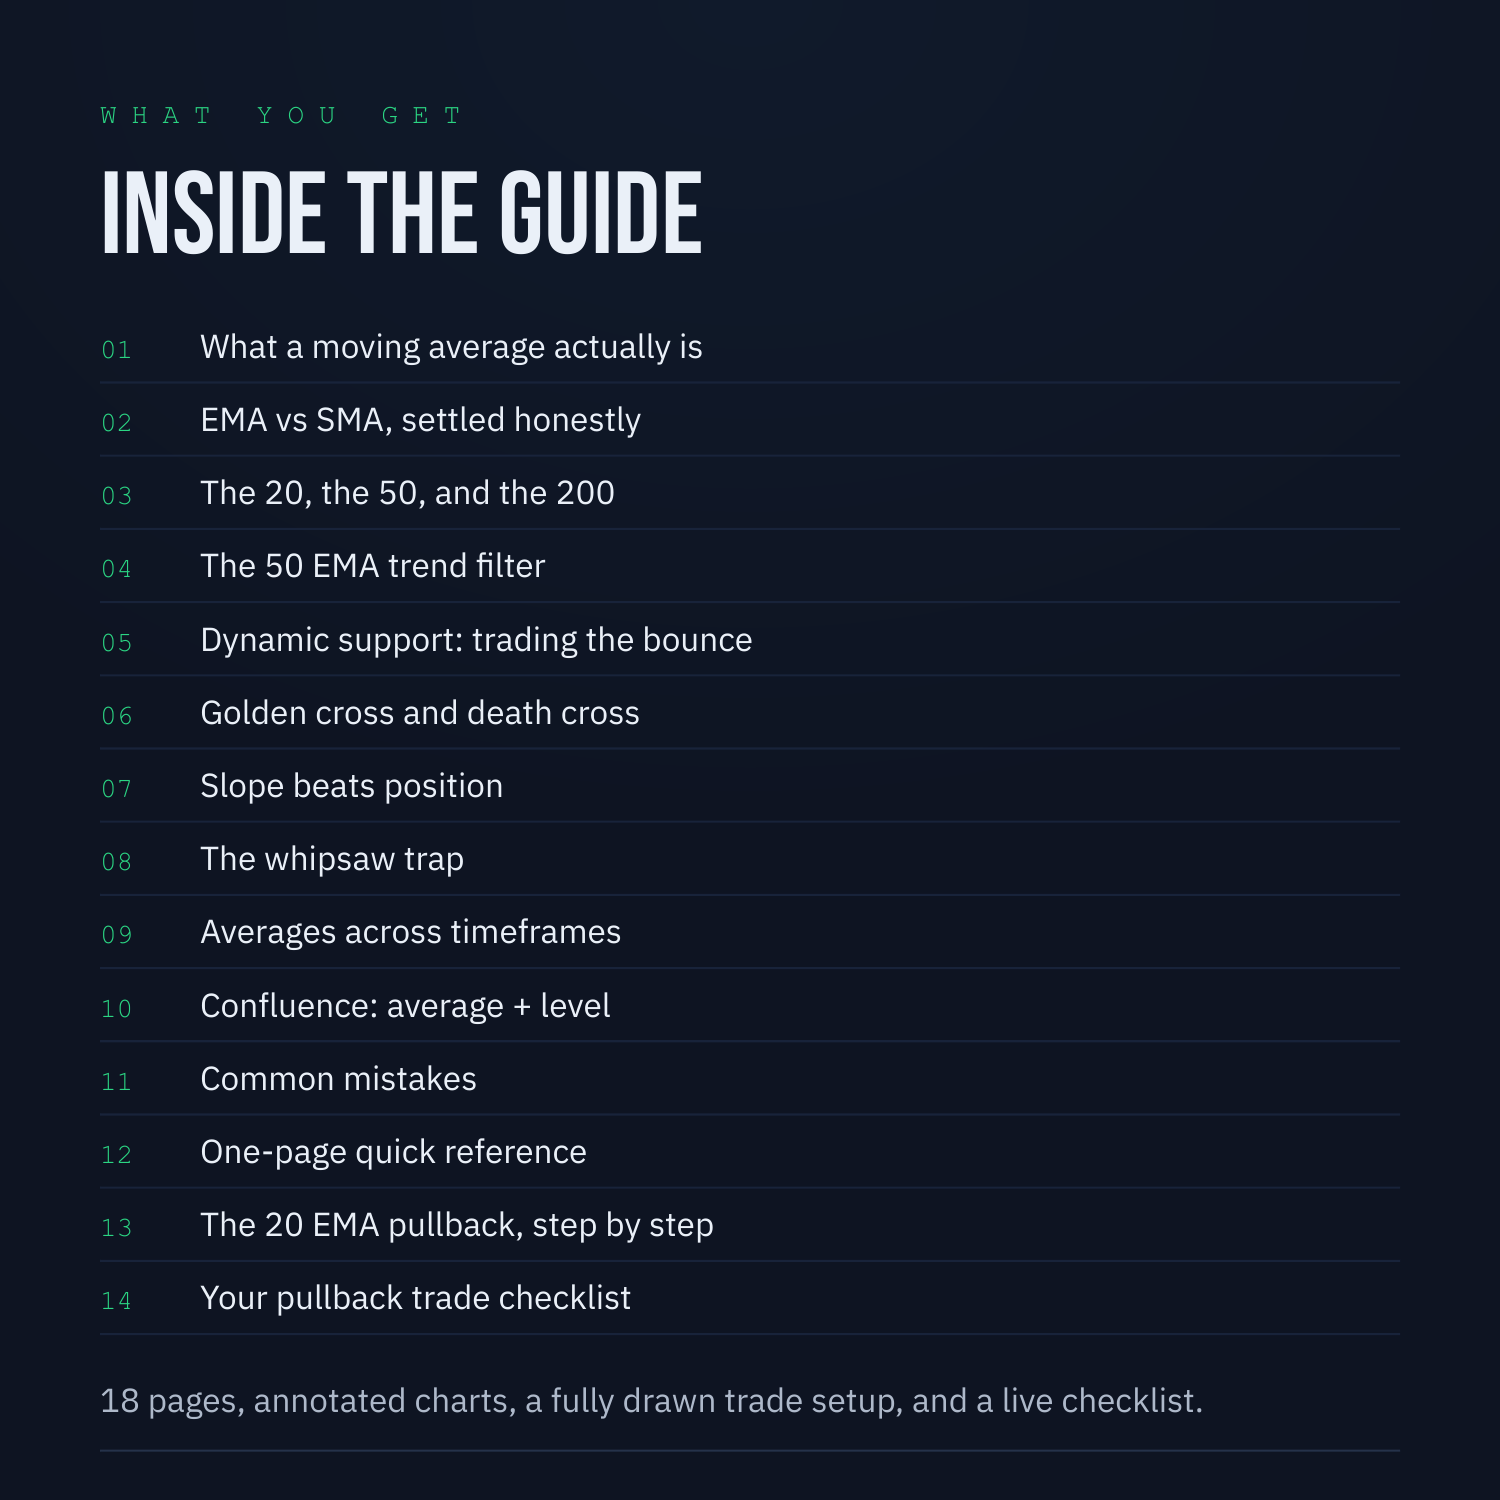
- What a moving average really tells you, and why the lag is the point
- EMA vs SMA, settled honestly in one page
- The 20, the 50, and the 200: three lines, three different jobs
- Dynamic support: trading the reaction at the line, never the touch
- Slope before position, the whipsaw trap, and multi-timeframe permission
- The 20 EMA pullback strategy, step by step, with the trade drawn on the chart
- A Context / Entry / Risk / Exit checklist you can use while trading
**What you'll be able to do:**
- Read trend health from three lines at a glance
- Skip the flat-average markets that eat accounts
- Trade the pullback with a defined trigger, stop, and target
A moving average is a clue, not a crystal ball. This guide is educational, not financial advice.
Instant PDF download. Pairs perfectly with the RSI and MACD guides in the store.