What You Get
1. TSH NinjaTrader Renko Footprint Charts
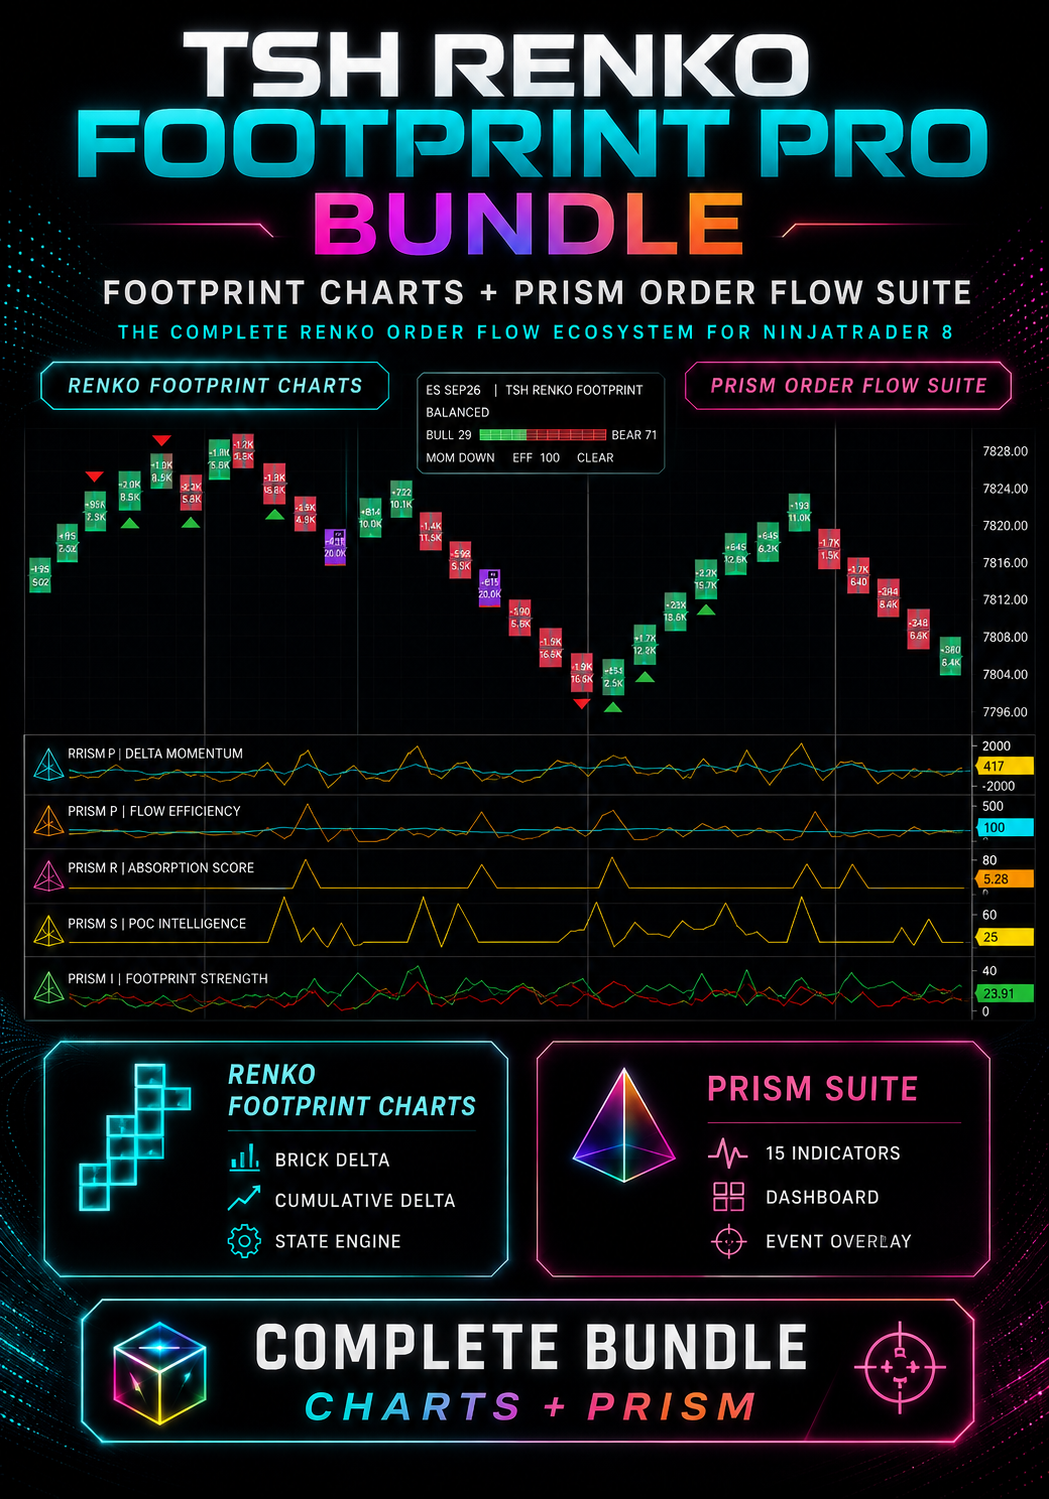
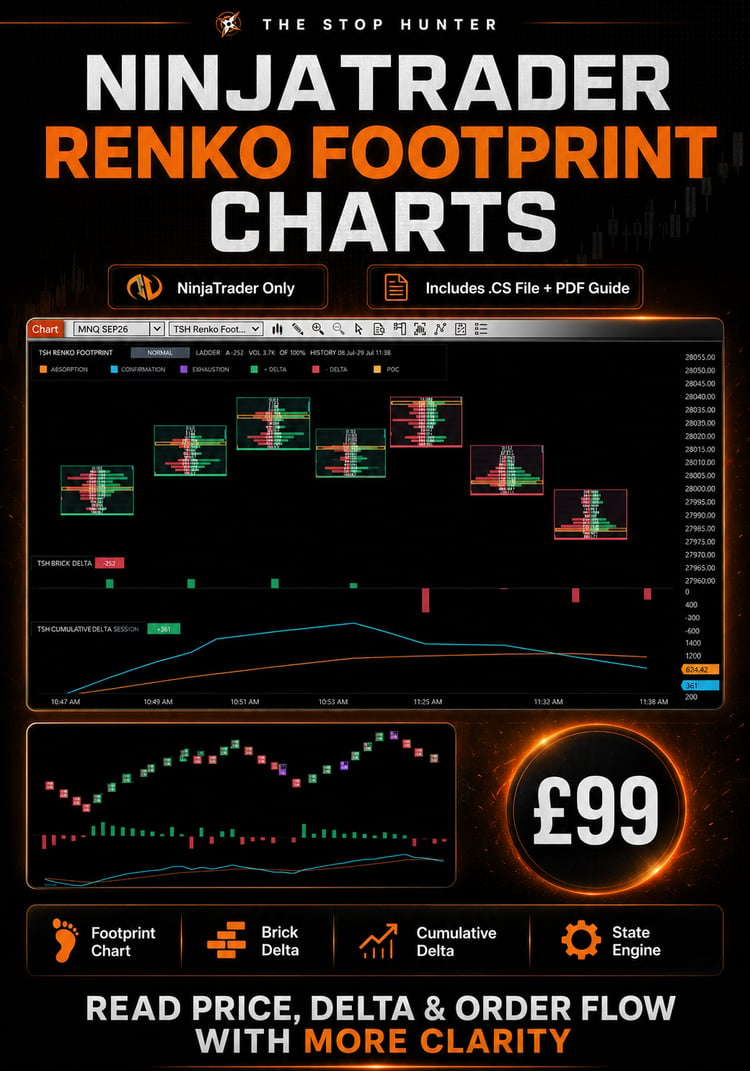
The TSH Renko Footprint Charts combine Renko price structure with footprint-style order-flow analysis directly inside NinjaTrader Desktop.
The chart suite includes:
- custom TSH Renko Footprint BarsType;
- full Renko Footprint Chart;
- bid × ask footprint information;
- adaptive footprint ladder;
- per-price-level volume;
- Point of Control;
- Brick Delta;
- Cumulative Delta;
- absorption state;
- confirmation state;
- exhaustion state;
- adjustable State Engine;
- adaptive detail as you zoom the chart.
At wider zoom levels the chart automatically simplifies the footprint detail so the Renko structure remains readable, while closer zoom levels reveal more order-flow information.
TSH Renko Brick Delta
Shows the Delta of each completed Renko brick.
Potential uses include:
- analysing buying/selling pressure;
- spotting weakening participation;
- identifying opposing Delta;
- comparing Delta with Renko direction;
- recognising unusually strong pressure.
TSH Renko Cumulative Delta
Tracks broader accumulated order-flow pressure.
Includes:
- Session mode;
- Continuous mode;
- Rolling mode;
- smoothing options;
- moving-average options;
- independent panel scaling.
TSH State Engine
The Footprint Charts also include visual states for:
Absorption — Orange
Aggressive activity appears but price fails to move as expected.
Confirmation — Cyan
Renko direction, Delta and participation are aligned.
Exhaustion — Purple
An established move begins to show weakening order-flow pressure or reduced participation.
2. PRISM Renko Order Flow Suite
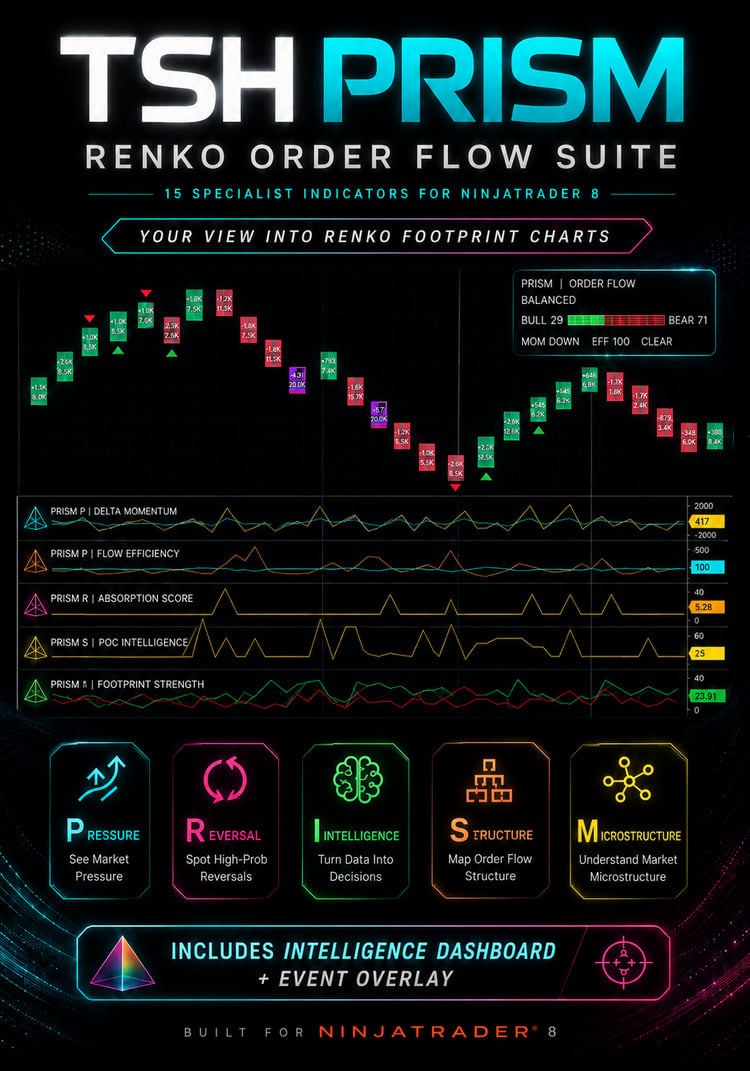
PRISM is the analytical intelligence layer designed specifically for the TSH Renko Footprint ecosystem.
PRISM stands for:
P | Pressure
R | Reversal
I | Intelligence
S | Structure
M | Microstructure
It contains 15 specialist Renko Order Flow indicators, plus the PRISM Event Overlay and Intelligence Dashboard.
P | Pressure
PRISM Delta Momentum
Measures changes in Delta, including acceleration and deceleration in buying/selling pressure.
PRISM Order Flow Pressure
Measures signed footprint pressure and whether that pressure is persisting across multiple Renko bricks.
PRISM Flow Efficiency
Measures how much order-flow effort is required to generate a fixed Renko price movement.
PRISM Continuation Pressure
Produces a 0–100 score showing how strongly current order flow supports continuation of the Renko move.
S | Structure
PRISM POC Intelligence
Analyses POC location and POC migration through consecutive Renko bricks.
PRISM Renko Activity Gap
Uses footprint data to identify price areas that ordinary Renko construction may visually hide.
It can detect:
- multi-brick events;
- contiguous untraded price levels;
- hidden gap size;
- Gap Severity.
PRISM Pullback Quality
Compares order flow inside a pullback with the directional impulse that preceded it.
PRISM Breakout Quality
Grades Renko structural breakouts according to the order-flow participation accompanying the move.
R | Reversal
PRISM Delta Divergence
Objectively detects disagreement between Renko price direction and footprint Delta.
PRISM Absorption Score
Converts potential absorption into a configurable 0–100 score.
PRISM Exhaustion Score
Measures potential climax or pressure-decay exhaustion.
PRISM Reversal Pressure
Combines several forms of deterioration into a broader 0–100 reversal-pressure score.
M | Microstructure
PRISM Imbalance Engine
Automatically analyses:
- bullish imbalance density;
- bearish imbalance density;
- diagonal imbalance;
- stacked imbalance;
- net stacked pressure.
I | Intelligence
PRISM Order Flow Regime
Classifies the current Renko order-flow environment into states such as:
- Bull Aggressive;
- Bull Pressure;
- Bull Weak;
- Balanced;
- Bear Weak;
- Bear Pressure;
- Bear Aggressive;
- Exhaustion;
- Activity Gap.
PRISM Footprint Strength
Combines multiple footprint components into a simplified Bull/Bear assessment.
For example:
BULL 78 | BEAR 22
PRISM Intelligence Dashboard
You do not have to load 15 separate indicators onto your chart.
PRISM includes a compact dashboard that can summarise the current Renko order-flow environment.
Depending on the selected workspace mode, it can show:
Regime
Bull/Bear Strength
Momentum
Flow Efficiency
Absorption
Exhaustion
POC Direction
Imbalance
Activity Gap
Current Alert State
For example:
PRISM | ORDER FLOW
BEAR AGGRESSIVE
BULL 18 | BEAR 82
MOM DOWN | EFF 76
CLEAR
PRISM Event Overlay
The Event Overlay allows important PRISM conditions to be shown directly on the Renko chart without loading multiple lower panels.
Possible events include:
- bullish Delta divergence;
- bearish Delta divergence;
- potential absorption;
- potential exhaustion;
- Renko activity gaps;
- POC migration.
Three workspace modes are available:
Clean
Designed for everyday chart use with only the strongest events shown.
Standard
Provides more detail while still keeping the chart readable.
Research
Designed for deeper analysis and testing.
Fully Adjustable
Both the Footprint Charts and PRISM have been designed to be configurable.
Depending on the indicator, users can adjust:
- lookback periods;
- signal thresholds;
- Delta thresholds;
- pressure thresholds;
- volume thresholds;
- imbalance ratios;
- stacked imbalance levels;
- Gap Severity;
- gap size;
- breakout quality;
- strength thresholds;
- sensitivity.
PRISM also supports:
Conservative
Fewer, stronger signals.
Balanced
Recommended default.
Aggressive
More responsive.
Custom
Greater control over the underlying settings.
The original Footprint State Engine itself is also adjustable so users can make absorption, confirmation and exhaustion more or less selective depending on the instrument, block size, session and data feed.
Why Buy the Pro Bundle?
The two products have been designed to work together.
The Renko Footprint Charts provide the underlying order-flow visualisation.
PRISM then measures, interprets and scores that information.
Think of it like this:
Renko gives you structure.
Footprint shows you what happened inside the move.
PRISM turns that information into objective intelligence.
The result is a much more complete Renko trading environment.
What Can You Analyse?
The combined package can be used to investigate:
- Renko trend quality;
- continuation;
- pullbacks;
- reversals;
- Delta divergence;
- absorption;
- exhaustion;
- breakout participation;
- false breakouts;
- stacked imbalance;
- POC migration;
- hidden Renko price/activity gaps;
- changing market pressure;
- Bull/Bear strength;
- order-flow regime;
- potential strategy filters.
The purpose is not to provide a black-box buy/sell system.
It is to give Renko traders significantly more information and a framework for analysing and testing what is happening underneath the price structure.
Designed for Research and Backtesting
A major objective of PRISM is to turn footprint concepts that are often judged visually into numerical data.
Examples:
Absorption Score = 76
Breakout Quality = 82
Bull Strength = 71
Gap Severity = 90
This creates the potential to use PRISM data for:
- Strategy Analyzer research;
- systematic strategy development;
- signal filtering;
- alerts;
- optimisation;
- automated strategy research.
What You Receive
Your bundle includes:
TSH Renko Footprint Charts
✓ TSH Renko Footprint BarsType
✓ TSH Renko Footprint Chart
✓ TSH Renko Pressure Chart
✓ TSH Renko Brick Delta
✓ TSH Renko Cumulative Delta
✓ Adjustable State Engine
PRISM Renko Order Flow Suite
✓ All 15 PRISM indicators
✓ PRISM Event Overlay
✓ PRISM Intelligence Dashboard
✓ Clean / Standard / Research workspace modes
✓ Conservative / Balanced / Aggressive / Custom settings
✓ Numerical outputs for research and future automation
Documentation
✓ Renko Footprint installation/user guide
✓ PRISM User Guide
✓ Input and setting explanations
✓ Workflow guidance
✓ Troubleshooting information
✓ Future v1.x updates for the included products
Platform
NinjaTrader Desktop only.
The current TSH Renko Footprint Charts are not available for TradingView, MetaTrader, Sierra Chart or other platforms.
A suitable futures/tick data feed is required.
The quality of footprint, Delta, Cumulative Delta and PRISM analysis depends on the underlying data supplied by your broker/data provider.
Bundle Price
Individual prices:
TSH Renko Footprint Charts — £99
PRISM Renko Order Flow Suite — £149
Total if purchased separately:
£248
TSH Renko Footprint Pro Bundle
£179
You save £69
One-off purchase.
For NinjaTrader 8.
Who Is This For?
This bundle is designed for traders who:
- use NinjaTrader Desktop;
- trade or analyse futures;
- already use Renko charts;
- want to understand the activity inside Renko bricks;
- want more than simple Delta or Cumulative Delta;
- want objective order-flow measurements;
- want configurable tools rather than fixed signals;
- want to research Renko strategies systematically;
- want a complete Renko + footprint + order-flow environment.
A basic understanding of Renko charts, futures markets and technical analysis is recommended.
Important Information
The TSH Renko Footprint Pro Bundle provides analytical and educational software.
It is not:
- financial advice;
- investment advice;
- a trading signal service;
- a guaranteed trading system;
- a promise of profitable results.
No PRISM score, footprint state, Delta reading, imbalance, activity gap or other condition guarantees a particular future price movement.
The existing Footprint product likewise states that absorption, confirmation, exhaustion, high Delta, divergence and other chart conditions should not be treated as guaranteed standalone trading signals.
Users should test all settings thoroughly before using the software in a live trading environment.
Risk Warning
Trading futures and other leveraged financial products involves substantial risk.
Past performance, simulated results and backtests do not guarantee future performance.
Backtests and historical analysis may be affected by:
- data quality;
- historical bid/ask availability;
- commissions;
- slippage;
- latency;
- contract rollover;
- session settings;
- Renko construction;
- overfitting.
Always use appropriate risk management.
TSH RENKO FOOTPRINT PRO
Renko Structure. Footprint Order Flow. PRISM Intelligence.
Complete Bundle — £179
Save £69 compared with purchasing both products separately.
This is the page I’d use as the hero product once PRISM launches. At £179, the economic choice becomes very obvious: somebody looking at the £99 Footprint Charts only has to pay another £80 to receive the entire £149 PRISM suite as well. That should materially push buyers toward the Pro Bundle.