


Simple Gantt Chart
On Sale
$4.00
Pay what you want:
(minimum $4.00)
$
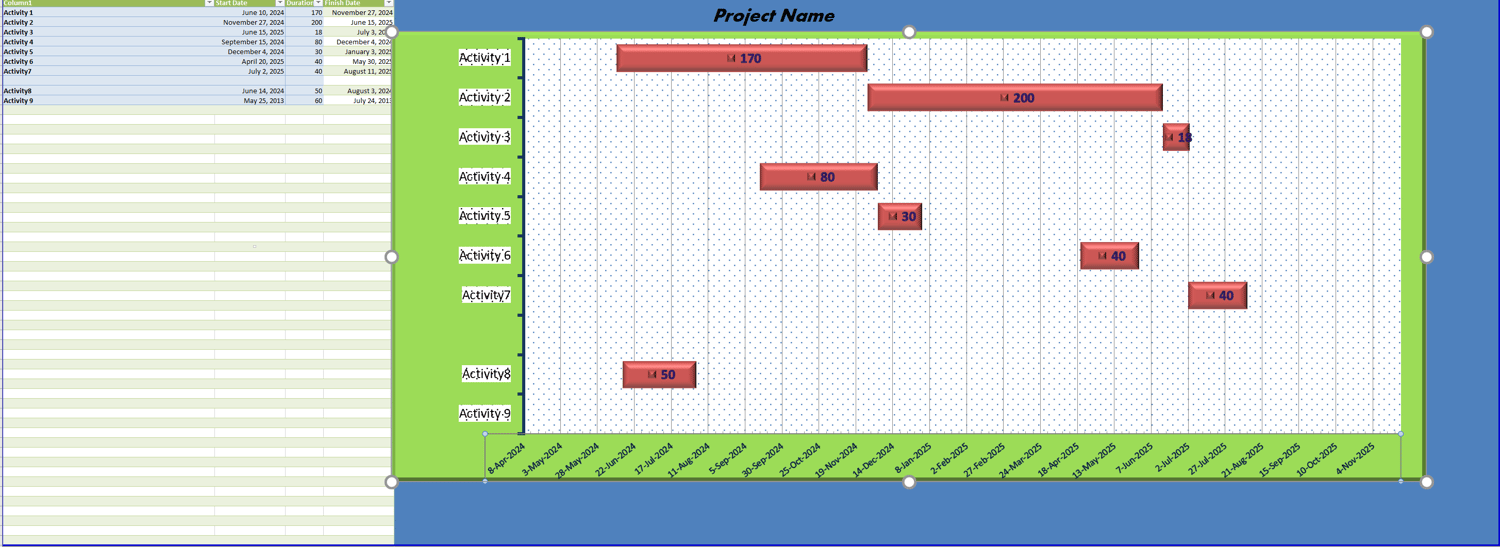
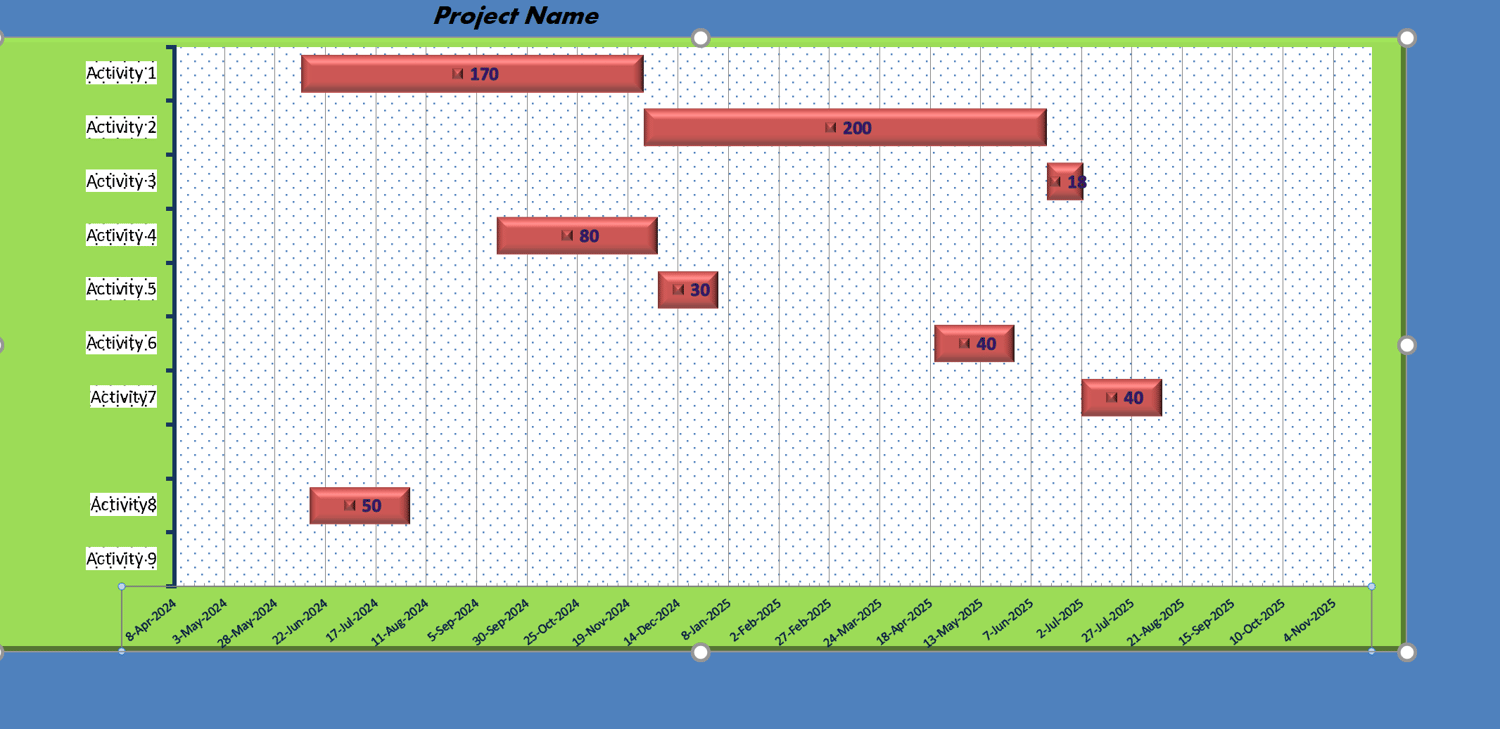
Simple Gantt Chart for scheduling Activities
Introduction
In today's fast-paced business environment, efficient project management is crucial. One of the most effective tools for visualizing and managing projects is the Gantt chart. While there are various software solutions available, many professionals prefer using Excel for its flexibility and familiarity.
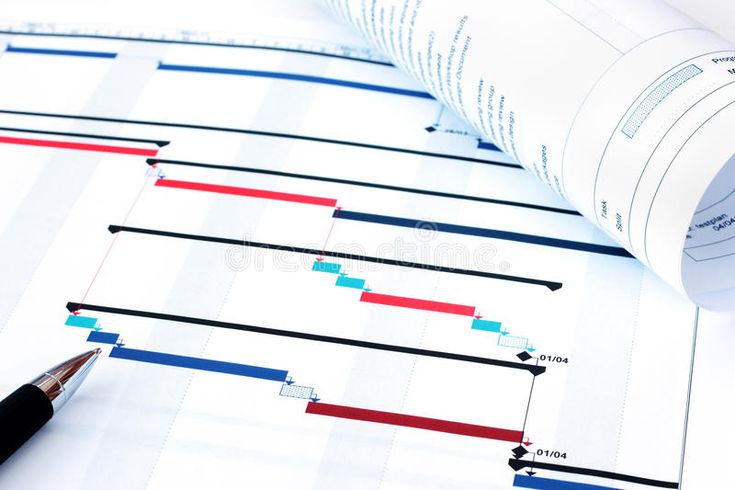
What is a Gantt Chart?
A Gantt chart is a type of bar chart that represents a project schedule. It displays the start and finish dates of various elements of a project, allowing project managers to see the timeline, dependencies, and progress of tasks at a glance. Named after Henry L. Gantt, who popularized its use in the early 20th century, Gantt charts have become a staple in project management.
Benefits of Using Gantt Chart Excel Templates
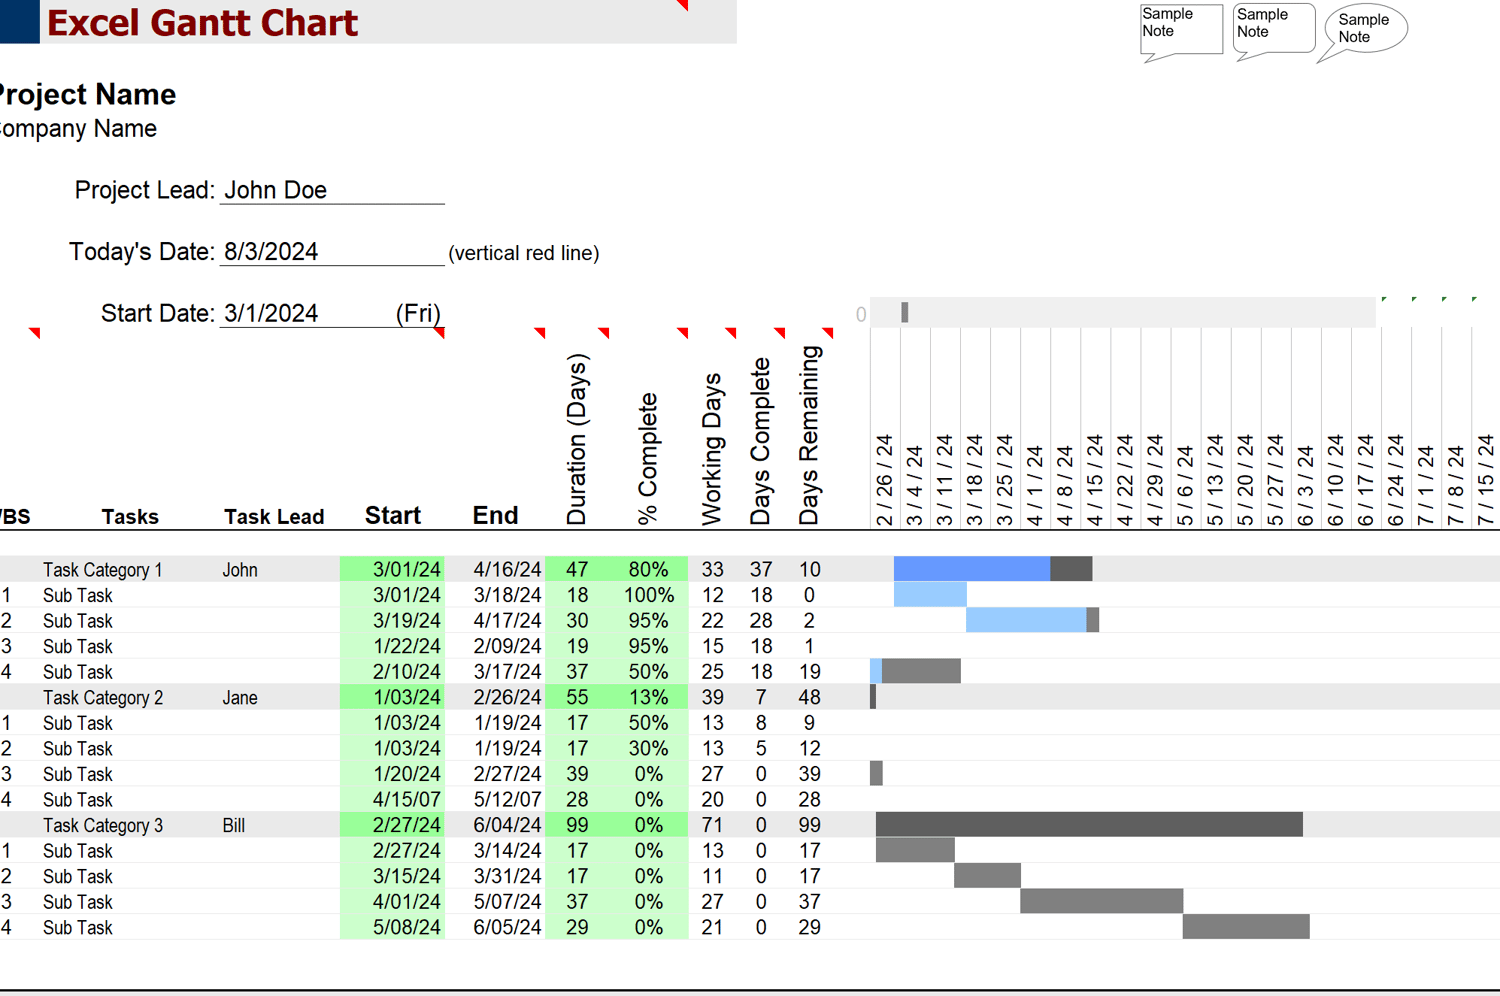
- Simplicity and Accessibility: Excel is widely used and understood, making it an accessible tool for many professionals.
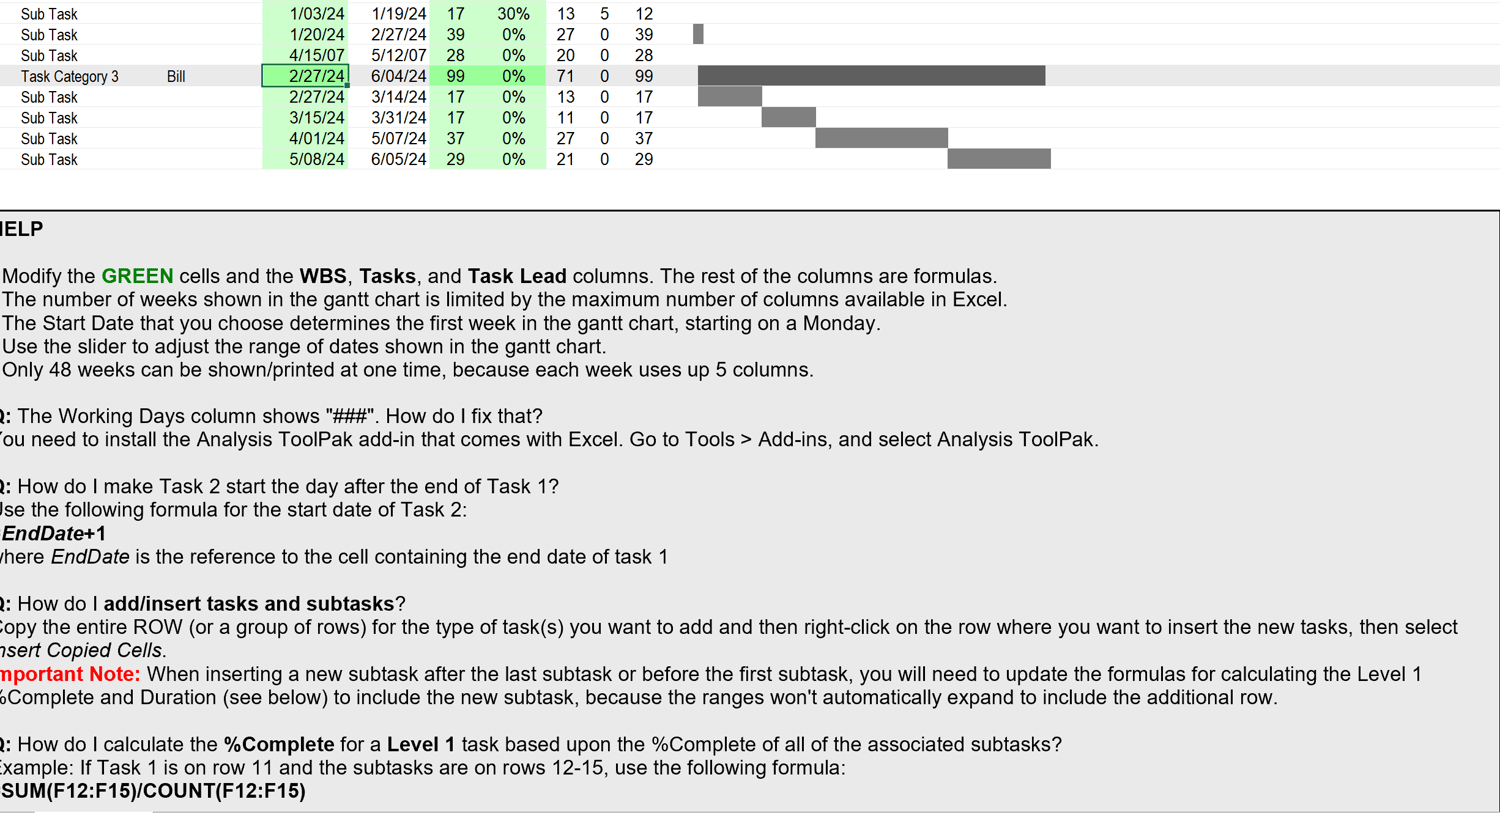
- Customization: Excel allows for high levels of customization, enabling users to tailor Gantt charts to their specific needs.
- Cost-Effective: Many Gantt chart Excel templates are available at a low cost, making them a budget-friendly option for project management.
- Integration: Excel can easily integrate with other tools and software, enhancing its functionality and usefulness.