

I review the key takeaways from this week’s trading, focusing on the positions I actually took.
I publish this “Weekly Trade Report” every Saturday.
If you read it alongside the “Trade Scenarios” I post every Sunday, you can see how I think in advance and how I execute against those scenarios in real time.
This report was slated to become paid content starting in August, but given the strong reception I am extending the free period for now.
This is not advice on “how you should trade,” nor am I claiming it is the one correct approach.
It is not a showcase of individual wins or losses, nor a recommendation of any particular strategy based on those outcomes.
Its purpose is to demonstrate, at a practical level, how I repeatedly apply a consistent process grounded in a pre-trade scenario, so that you can reference it when building your own strategy and process discipline.
Results are purely my own and do not guarantee your future returns.
Please keep that firmly in mind, and make sure you conduct your own testing and preparation and trade under your own responsibility.
With that, please see the charts below.
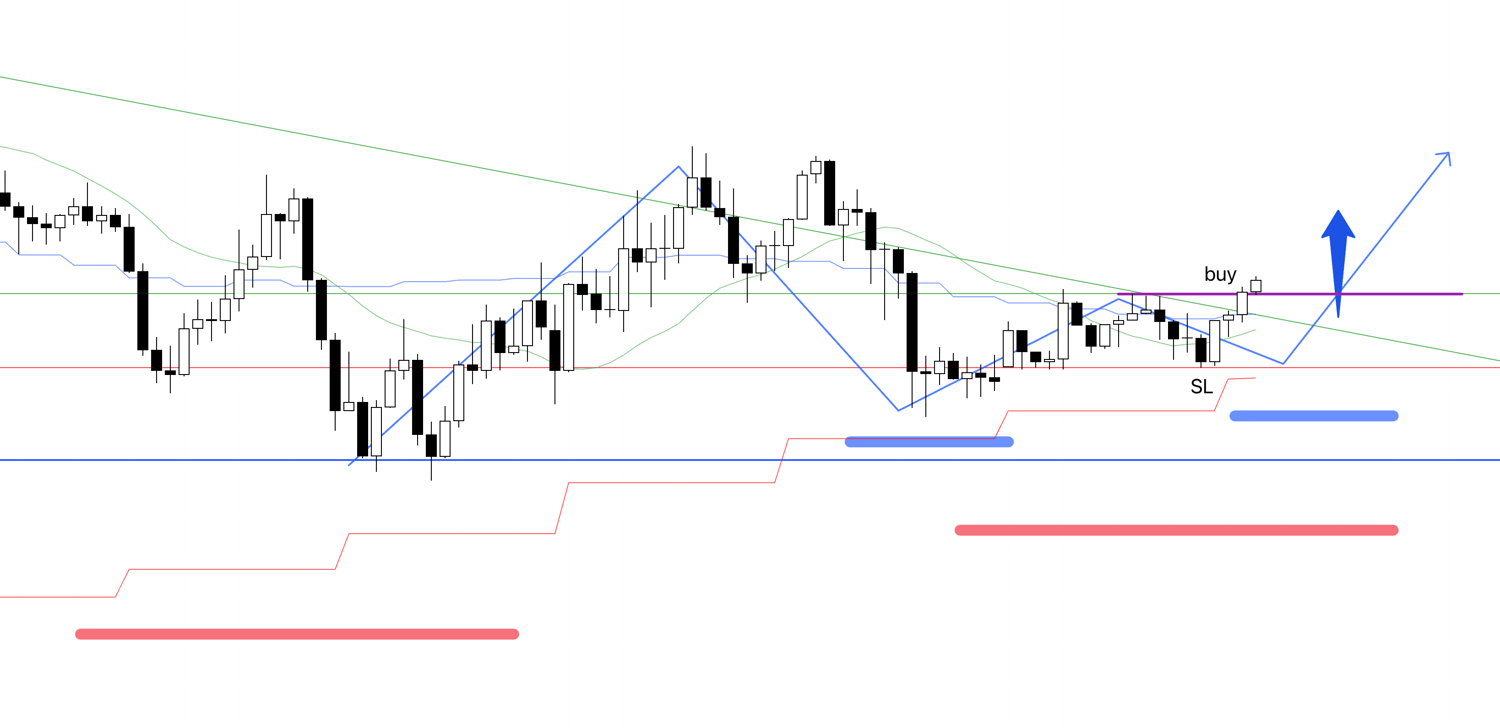
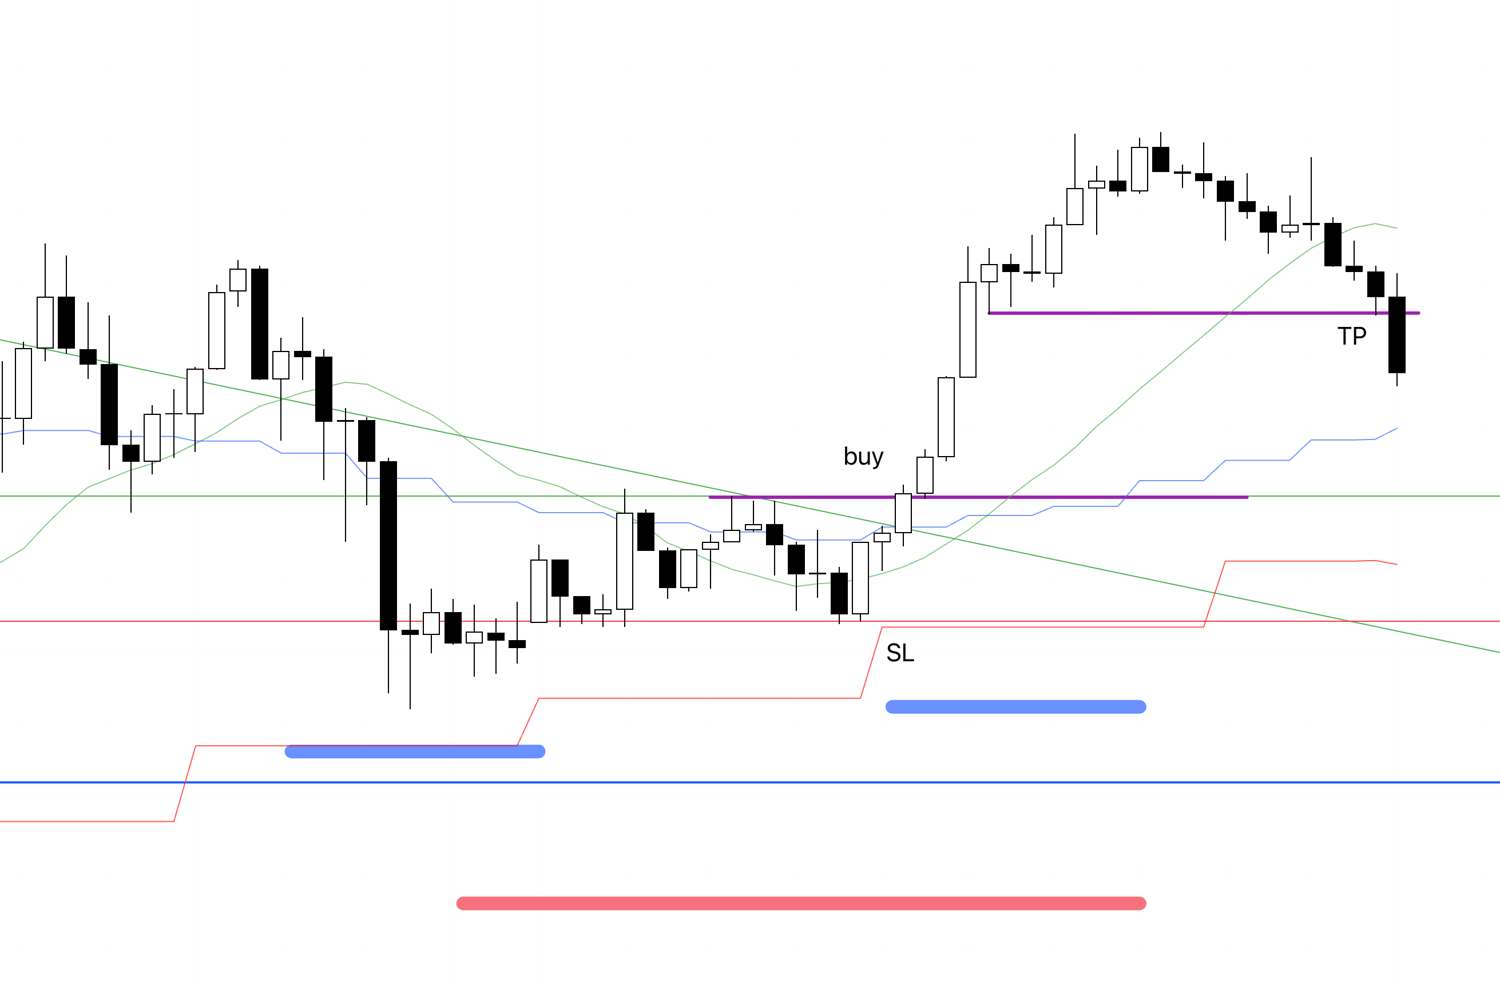
USDJPY 4h
This is the USDJPY 4h chart.
This week’s price action is to the right of the blue vertical line on the chart.
I buy pullbacks and sell rallies on the 4h.
On USDJPY this week there was only one location to consider a 4h sell-on-rally setup.
(For the pullback-buy and rally-sell framework, see my prior posts on Dow Theory and multi-timeframe analysis.)
However, the setup printed in the early morning while I was asleep, so I did not take it.
I will discuss this point later.
Next, please see the EURUSD chart below.
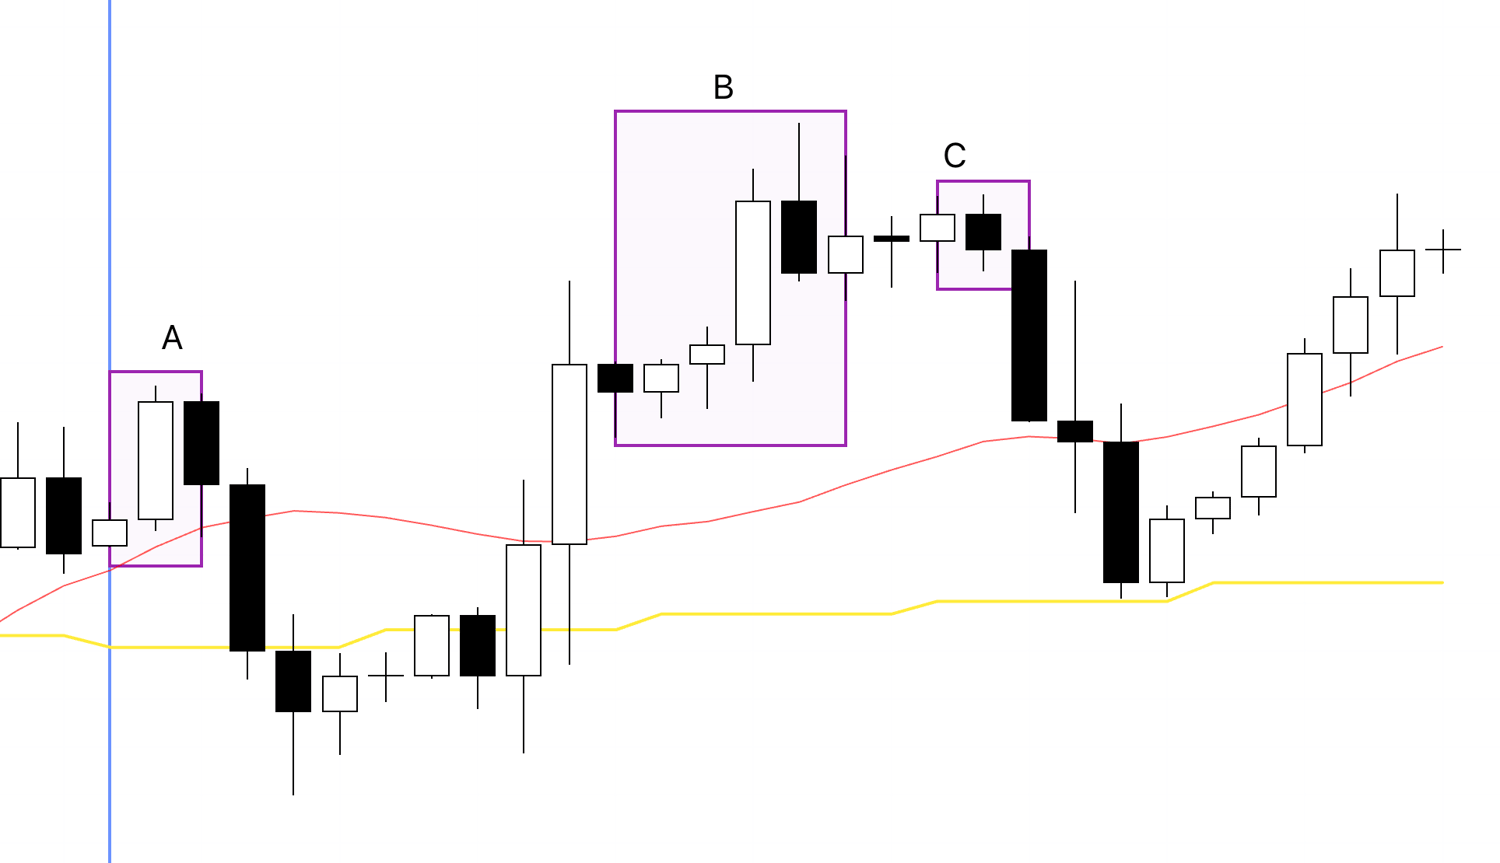
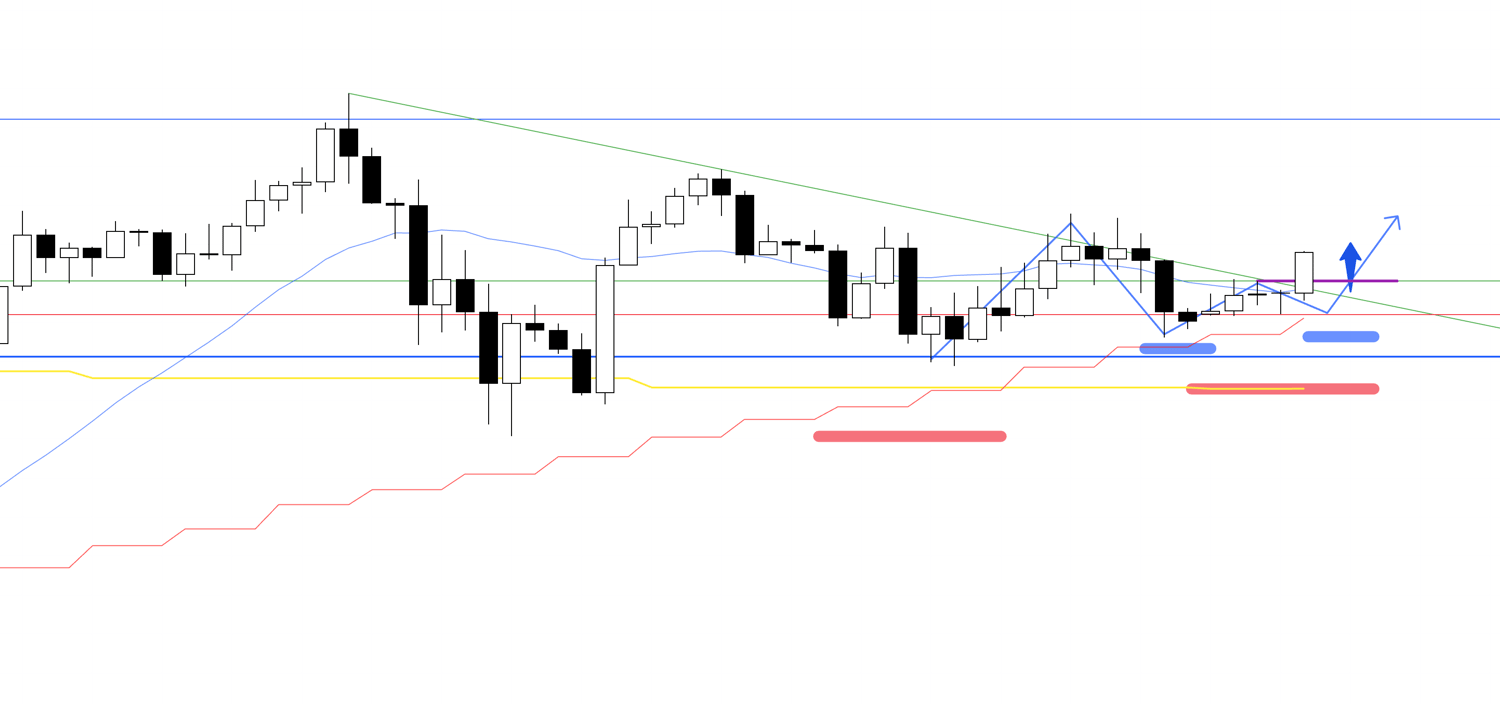
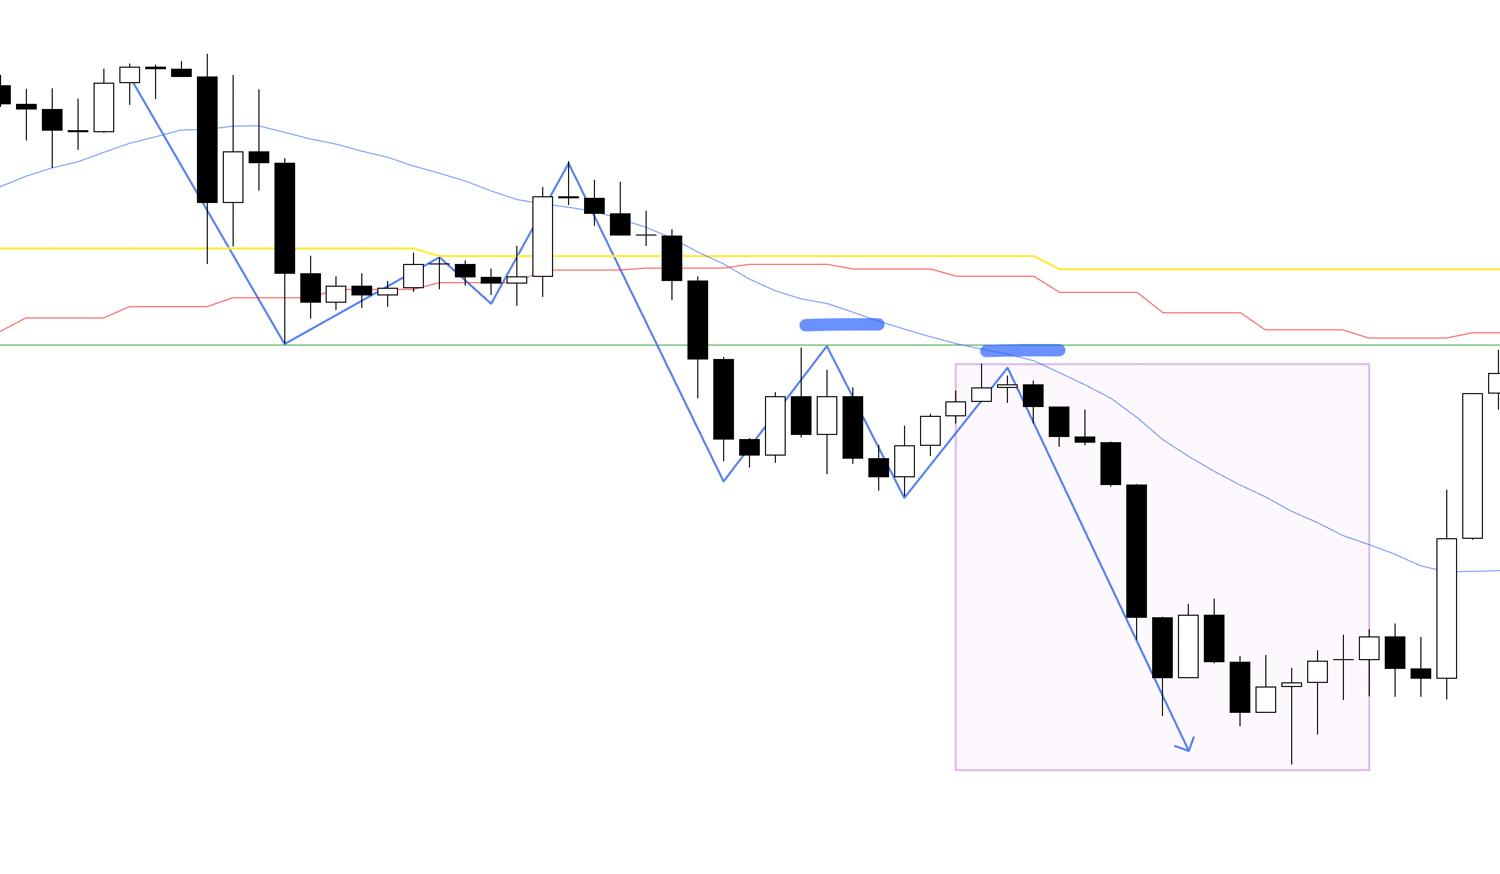
EURUSD 4h

This is the EURUSD 4h chart.
There were three 4h pullbacks this week on EURUSD.
I traded point A.
I did not trade points B or C because the conditions were not met.
Not every 4h pullback is actionable, and it is crucial to wait for your setup.
I will explain both points later by referencing what would have needed to be true for me to take them.
As noted last week, I was busy with non-trading commitments and could not watch the charts closely.
Fortunately, opportunities only appeared on Monday, so even with full screen time the outcome would likely have been similar.
First, here is point A on EURUSD, which I actually traded.
I captured screenshots while looking at the live chart and recorded my thinking in real time.
〜・〜・〜・〜・〜・〜・〜・〜・〜・〜・〜・〜・〜・〜・
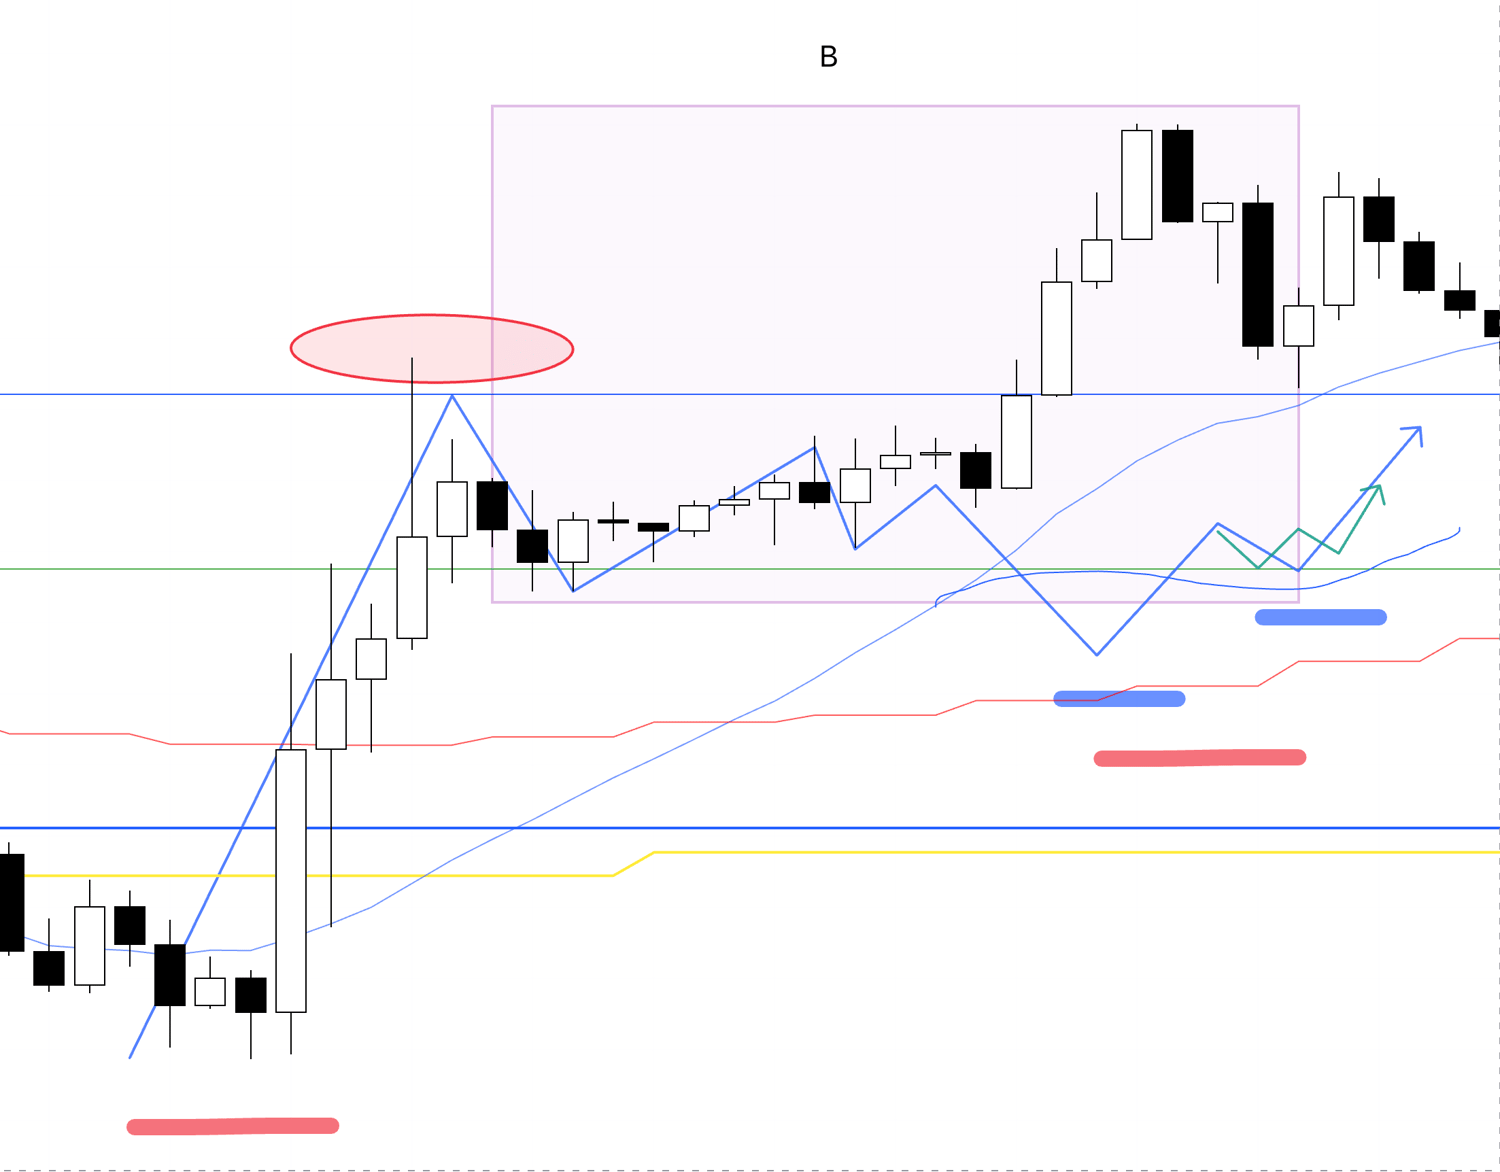
August 11 (Mon) EURUSD
4h chart from the Scenario post
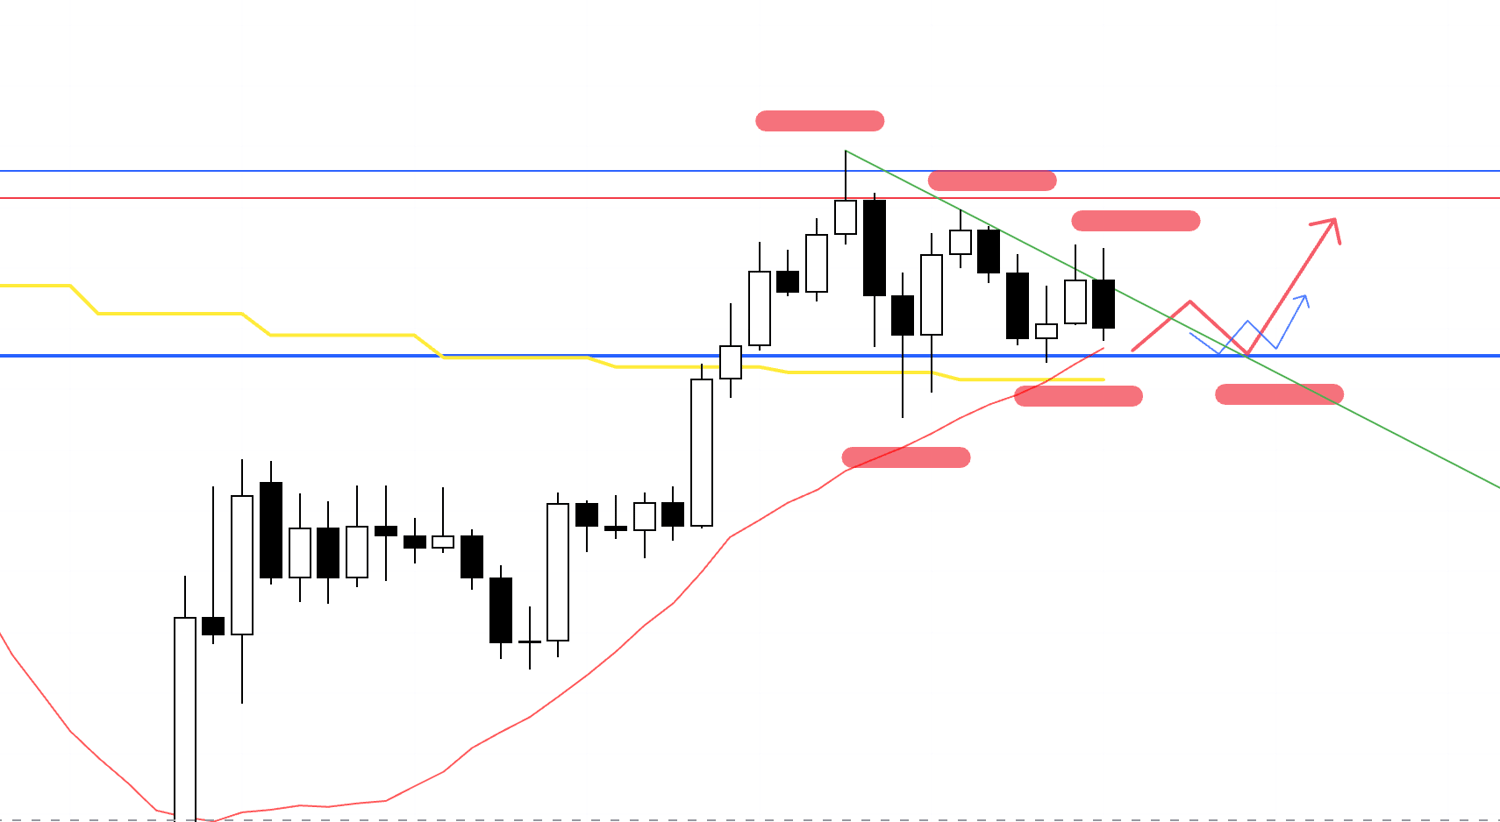
The long scenario I outlined on Sunday materialized quickly, so I placed a stop order.
Let’s look at the 1h chart.
1h
Entry was within the 4h higher-low zone, at the point where the lower timeframe 1h made a higher high and a higher low.
On 4h, price had been compressing with lower highs and higher lows, but this entry coincided with a break above the trendlines, which created a favorable skew for longs.
However, as flagged in Sunday’s scenario, the blue line above is a long-respected resistance, so I planned to secure half the profit on a first touch of that line and hold the remainder until the trend degraded.
15m
Order filled.
Given the nearby overhead resistance and the risk of a reversal, this was not a “ride the full 1h swing” trade, so I planned to exit if the 15m trend broke.
For completeness, here is how it looked on 1h.
Please see below.
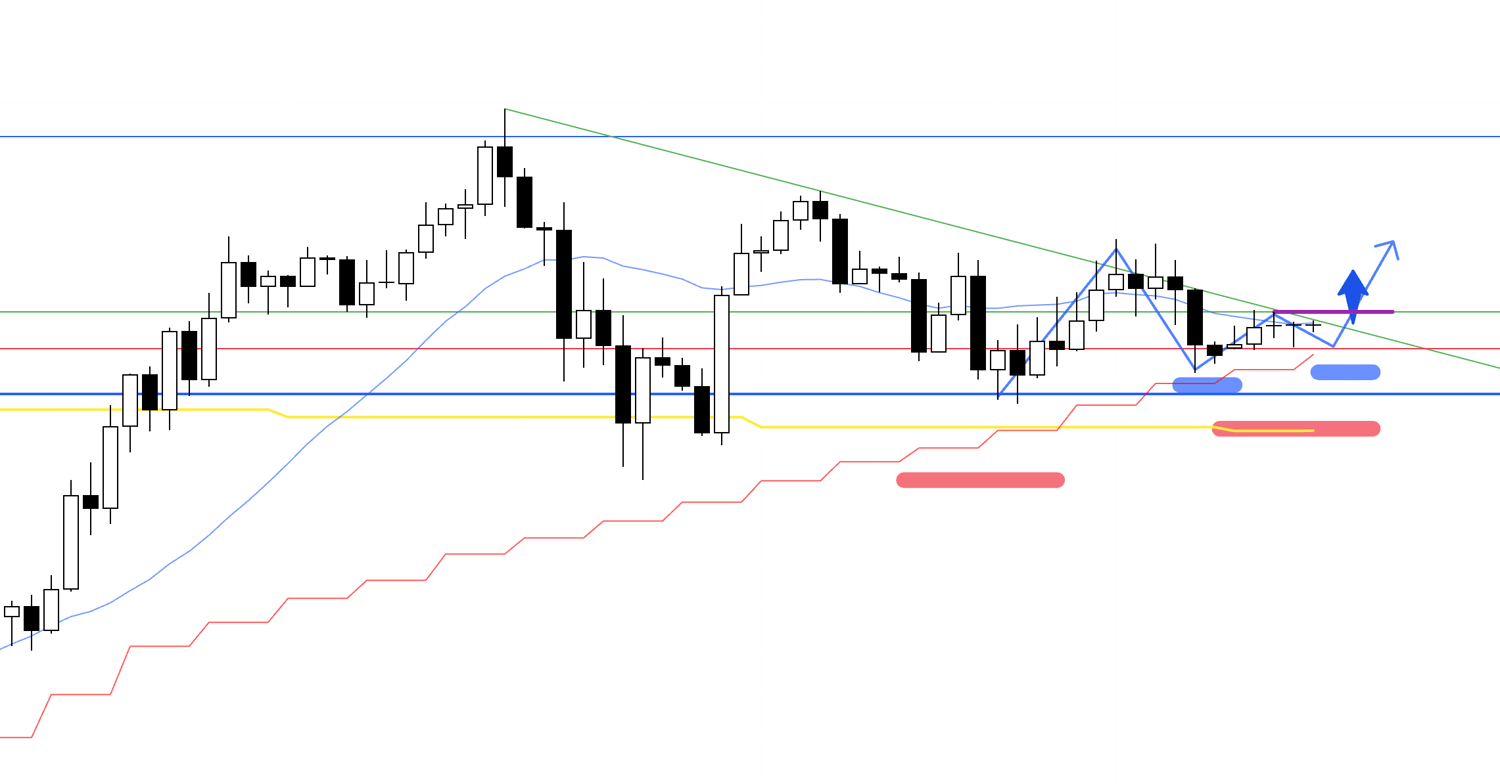
1h
This is the 1h chart immediately after entry.
Because the 4h was compressing with lower highs and higher lows, at the entry I watched closely to see whether price was breaking the descending trendline from above.
The entry aligned with that break, a spot where orders are likely to cluster.
15m
I trailed SL to the level that would cut below both the moving average and the prior swing high.
15m
After a higher high and another higher low, I raised SL to just beneath that newly formed higher low.
15m
Price hit the trailing stop, locking in profit and ending the trade.
〜・〜・〜・〜・〜・〜・〜・〜・〜・〜・〜・〜・〜・〜・
That was the only trade I took.
Next, I will explain the setups I did not take.
Please start with the USDJPY chart below.
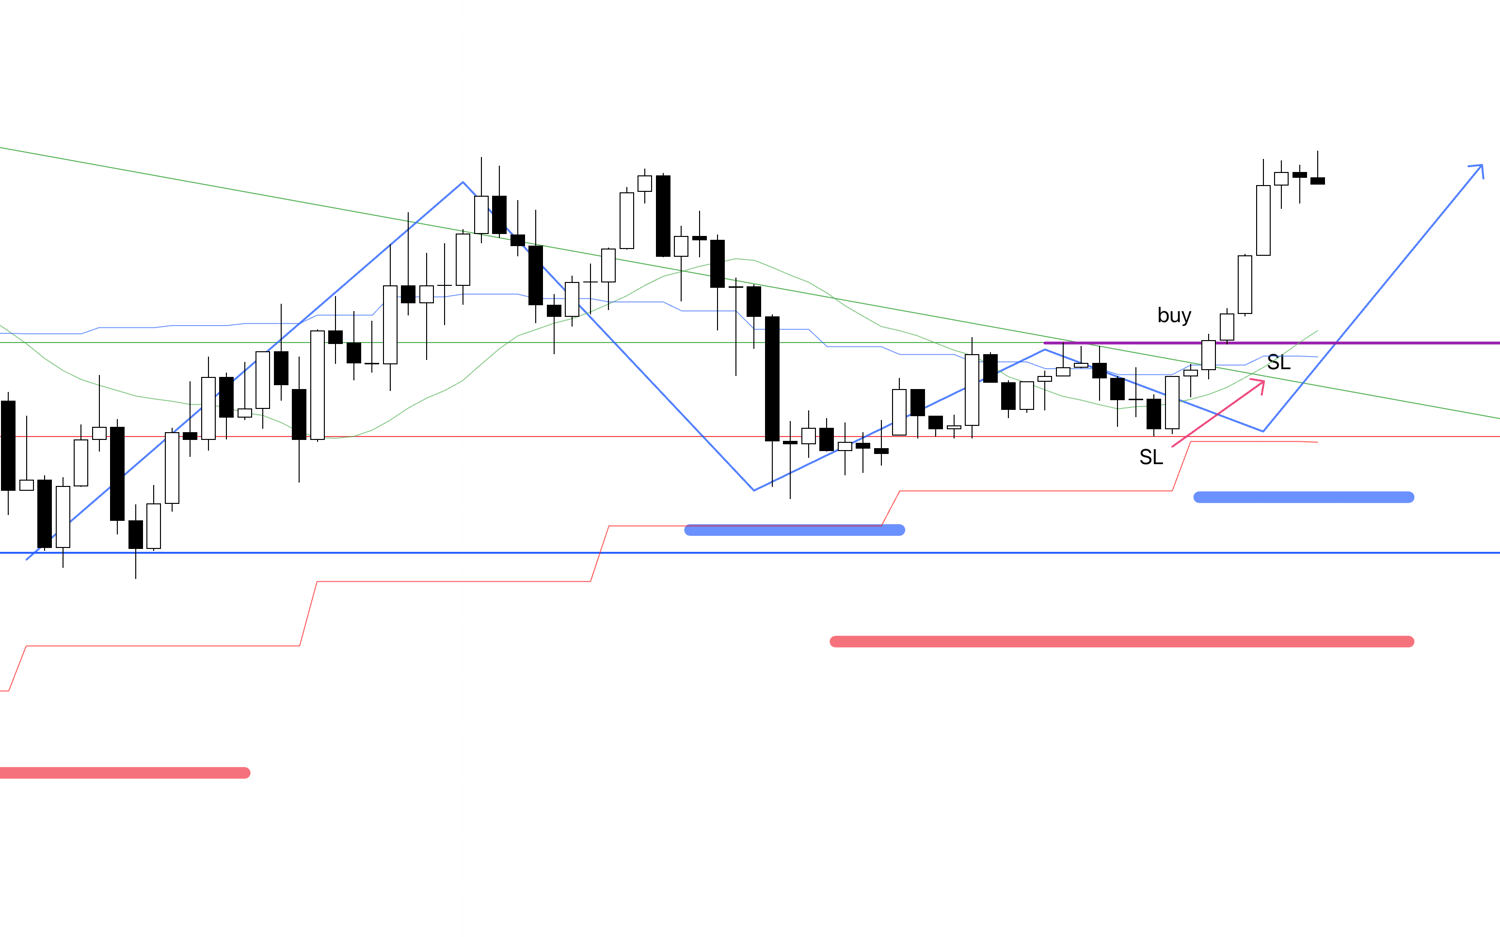
1h
This is the 1h chart, where the recent uptrend broke and the market rotated back into a downtrend via a fresh lower high.
It also aligns with a lower-high on the 4h, and the green line marks a level that has long mattered and previously supported the last swing low, so with that prior support now likely acting as resistance, this is a short setup with clear edge.
Let’s drill down to 15m.
15m
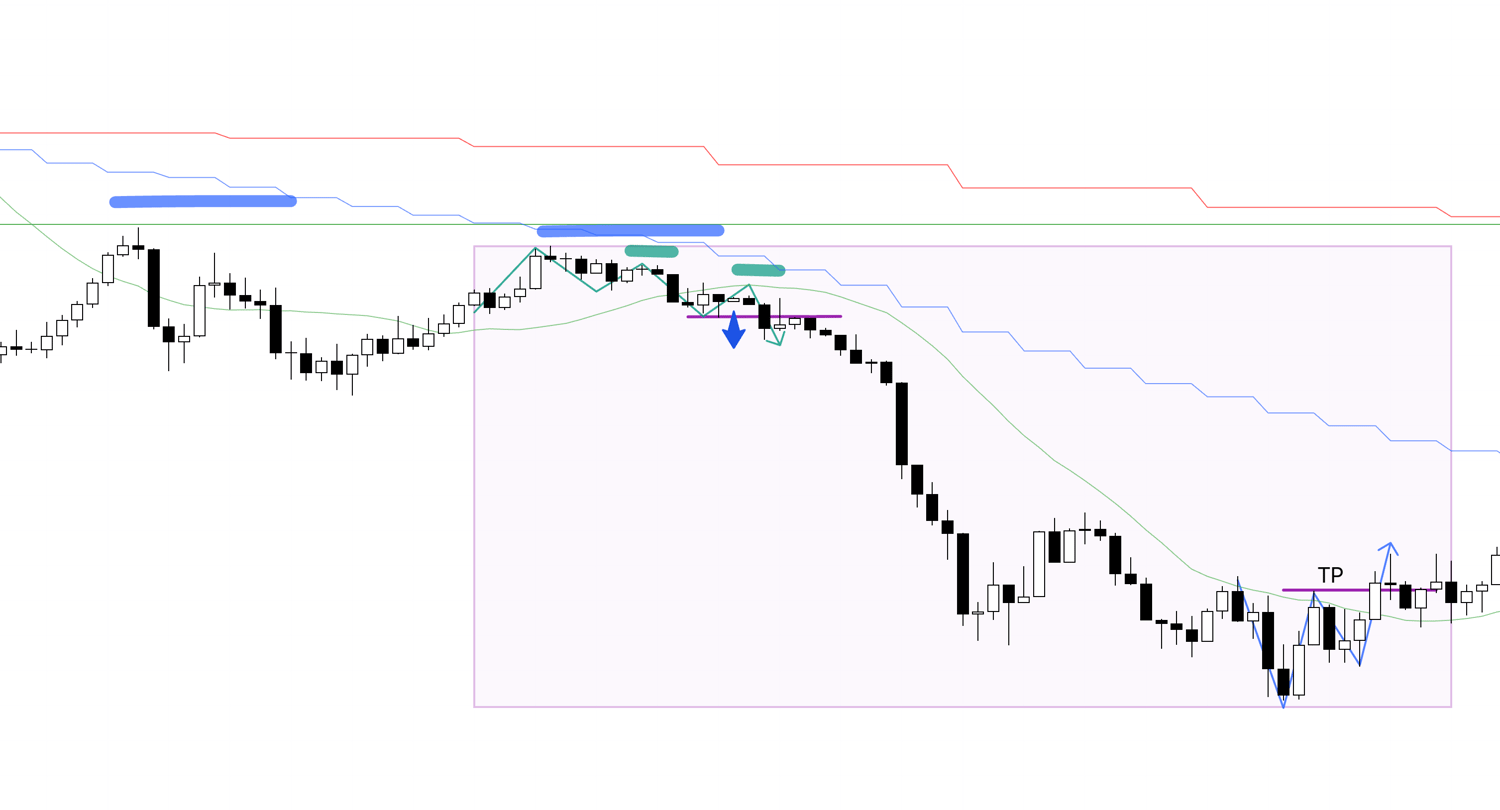
On 15m, within the 1h lower-high area, 15m is also printing lower highs, so the entry would be on the break to new lows.
If I had taken this trade, I would have exited when the 15m trend broke, implying a hold roughly to the TP shown on the chart.
I did not take it because I was asleep.
Even if I had been watching, with the 1h moving averages extended, I likely would not have traded it unless capped by strong resistance like this instance.
Next, here is the discussion of points B and C on EURUSD.
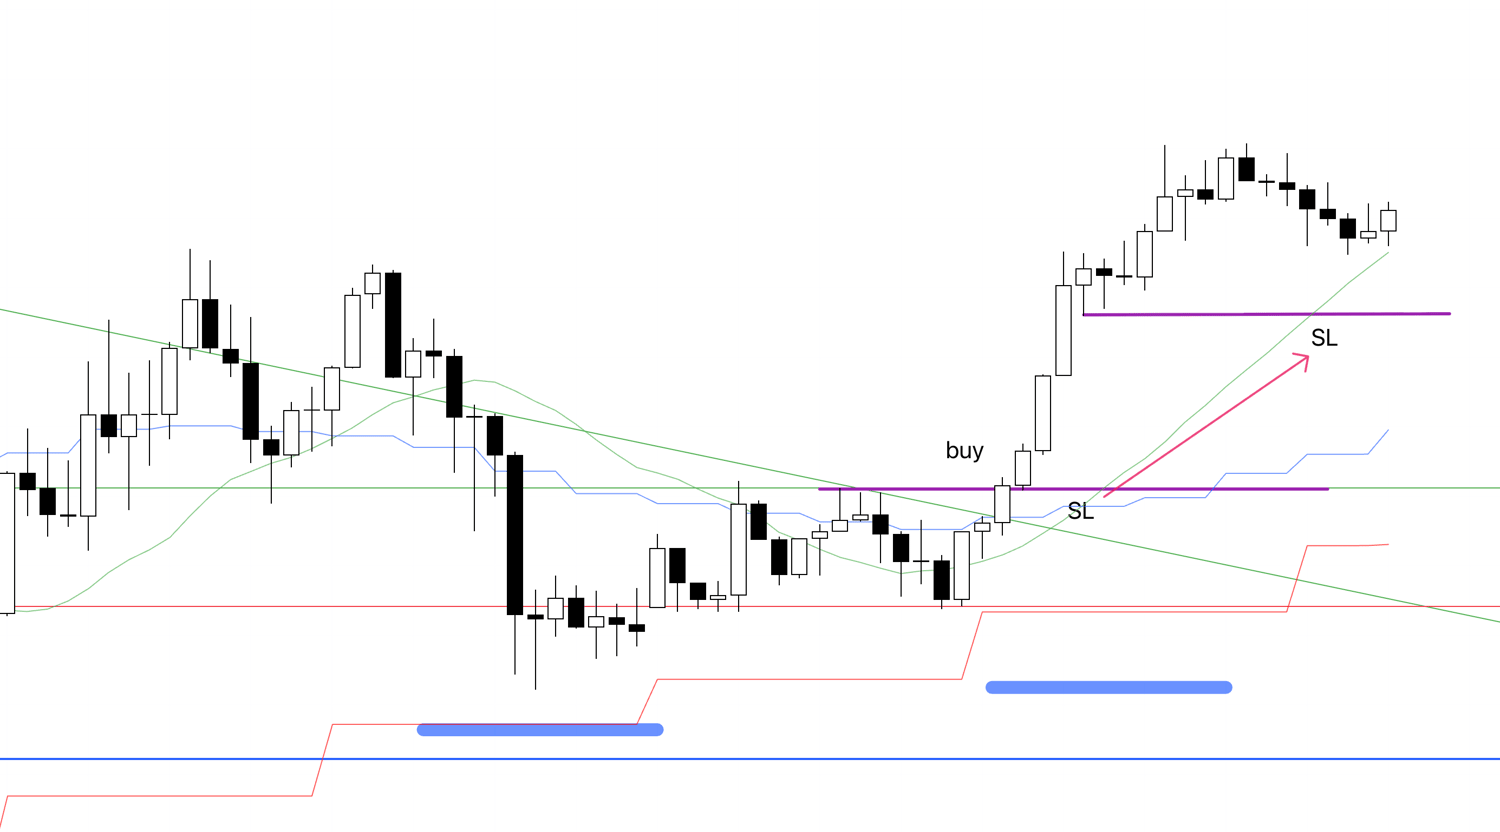
1h
This is the 1h chart at point B.
I had a functioning resistance line just above (blue line) and confirmed that the highs were capped there at the red-circled area.
It is the same resistance line where I intended to take half profits on trade A.
With highs rejected at that level and price extended away from the 1h MAs, buying in that area would risk chasing.
If I were to consider a long in this context, I would want to see the 1h trend reset, re-engage with its moving averages, form a fresh 1h higher-low, and then trigger on a lower-timeframe sequence of higher highs and higher lows such as on 15m.
Even then, the blue line overhead would make risk-reward the gating factor.
As it turned out, price kept rising anyway, but that is hindsight.
There is no need to view it as a missed trade.
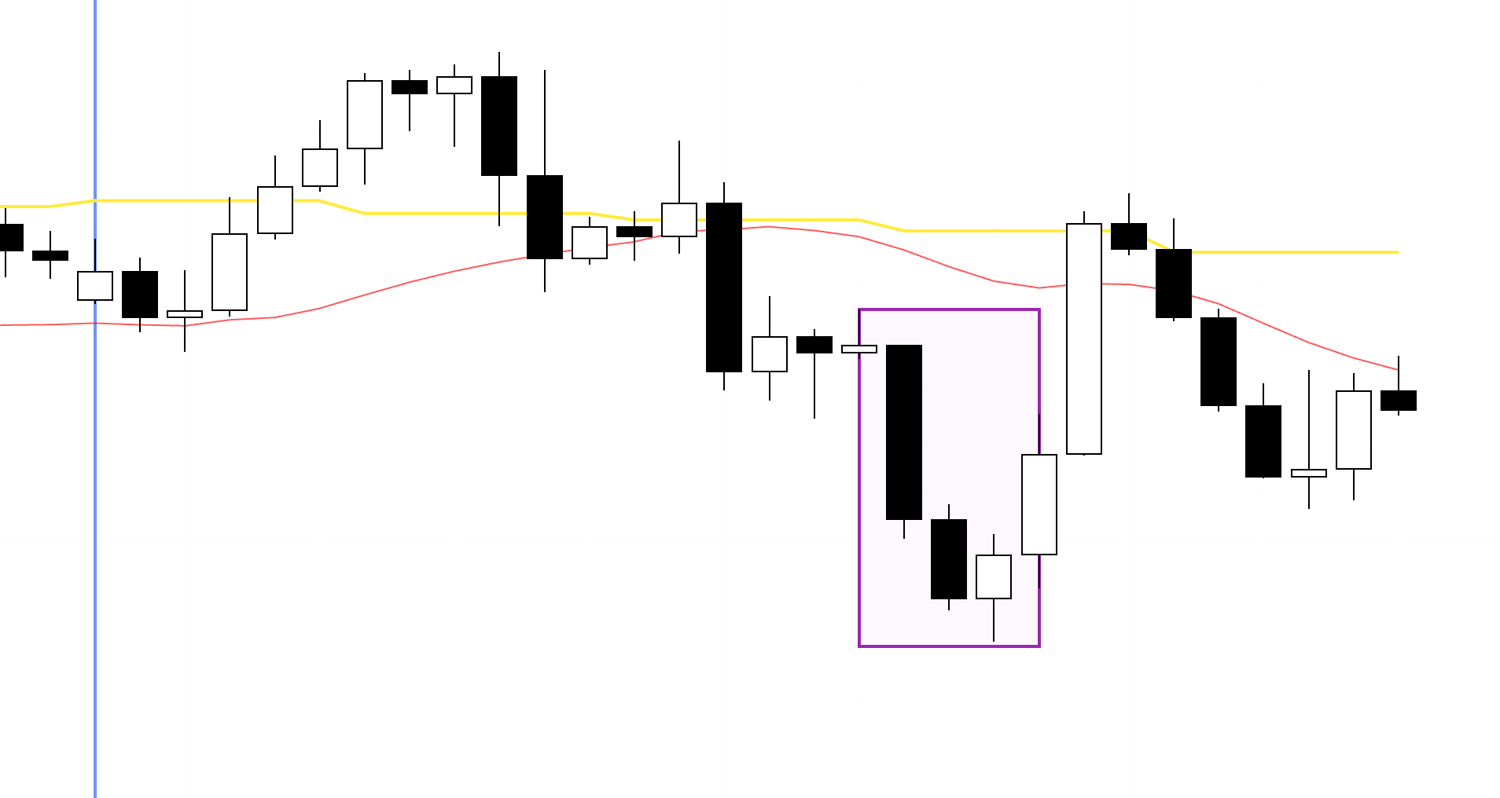
Next, point C.
1h
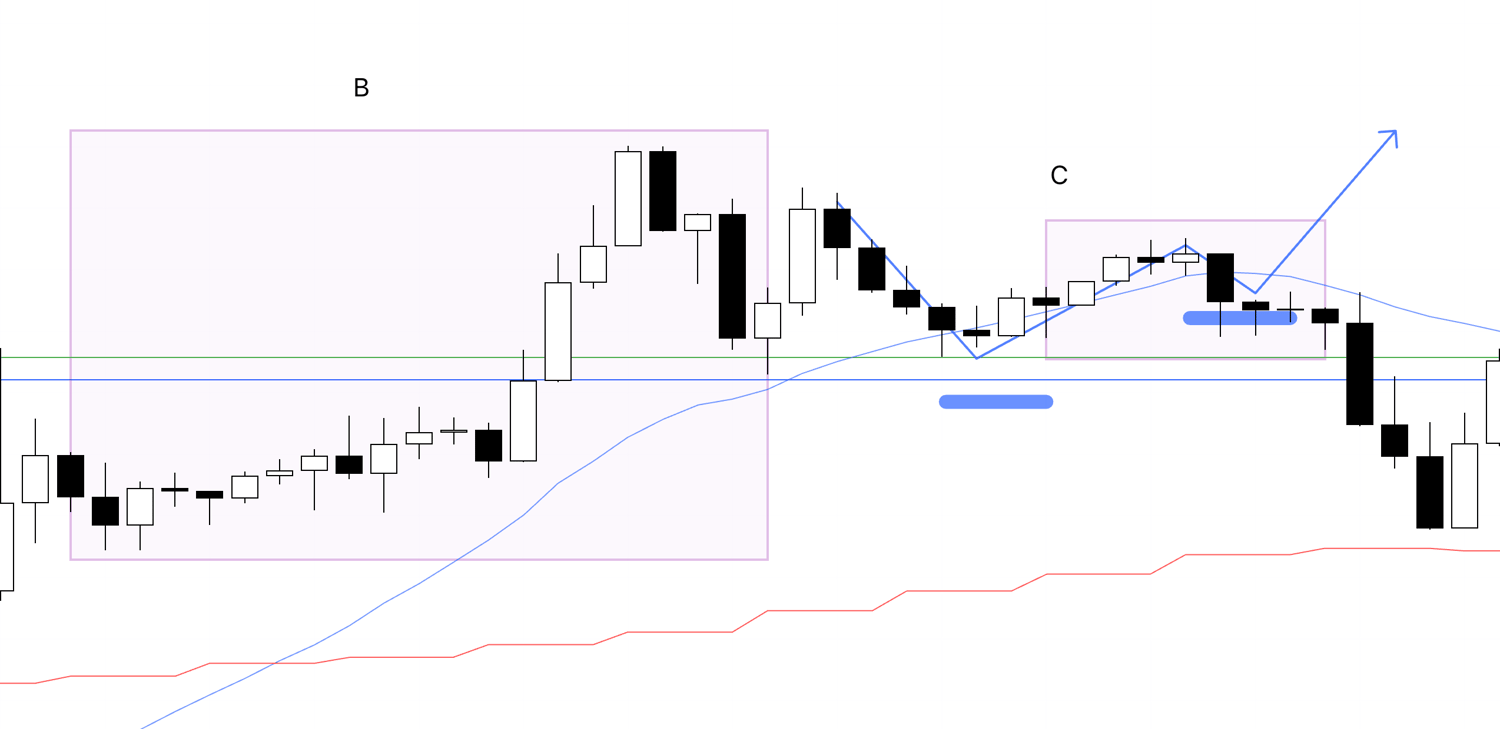
After point B, price broke above the blue resistance line, so I waited to see whether 1h would put in a higher low to set up a pullback buy against that line.
Instead, price broke back below the prior low, so there was no entry.
〜・〜・〜・〜・〜・〜・〜・〜・〜・〜・〜・〜・〜・〜・
That is all.
Although I was busy and watched less than usual, it was a week with very few actionable setups regardless.
Many people decide to trade X times per day or per week, but trade frequency is not something we control.
You can always click more, but truly high-edge setups are scarce, and if you restrict yourself to them, the only thing you can do is wait until they appear.
What matters is repeating only the trades you are supposed to take, even if that means fewer trades.
Off-plan trades do not count toward your sample size, and avoidable losses only create drawdown you must recover, degrading the strategy’s true performance.
Build your scenarios in advance and wait.
If they do not appear, do nothing.
If they do, execute without hesitation.
This “Weekly Trade Report” was scheduled to transition to paid content this month, but due to strong interest I will continue to publish it for free a little longer.
Each Saturday’s report compiles my real-time decision process—entries, stops, and profit-taking—for the trades I actually placed that week.
This report will eventually move to paid, so please take this opportunity to experience my thinking in real time.
These materials are provided solely for educational purposes.
They are not instructions to buy or sell, nor do they guarantee future profits.
You are solely responsible for your own trades, so take the time to build and test your strategy and operate at your own risk.
I hope my consistent trading helps you strengthen your own consistency.