


Hello.
I will lay out trade scenarios for the coming week.
This "Trade Scenarios" blog is posted "weekly" on Sundays.
And every Saturday I post how I actually thought and traded during the week as a "Weekly Trading Report."
By reading this alongside the Trade Scenarios blog, I believe you can refer to a consistent, practical process for how to think in advance, what to wait for, and how to execute.
For strategy, please see my blogs on Dow Theory and multi-timeframe analysis.
A scenario is not a forecast.
It is not a forecast but my personal plan of "if X happens, I will do Y."
I do not predict the market, and this is not that kind of content, so please understand that in advance.
Nor is this intended to instruct you to buy or sell or to provide signals.
It does not guarantee future profits, and it is provided solely for educational purposes, using how I execute a consistent process as the subject.
I cannot take responsibility for any outcomes of your trades, so please trade at your own risk.
Let’s start with USDJPY.
(On my charts, the line colors I draw represent each timeframe: orange for the daily, red for 4h, blue for 1h, and green for 15m.)
〜・〜・〜・〜・〜・〜・〜・〜・〜・〜・〜・〜・〜・〜・
USDJPY
Daily
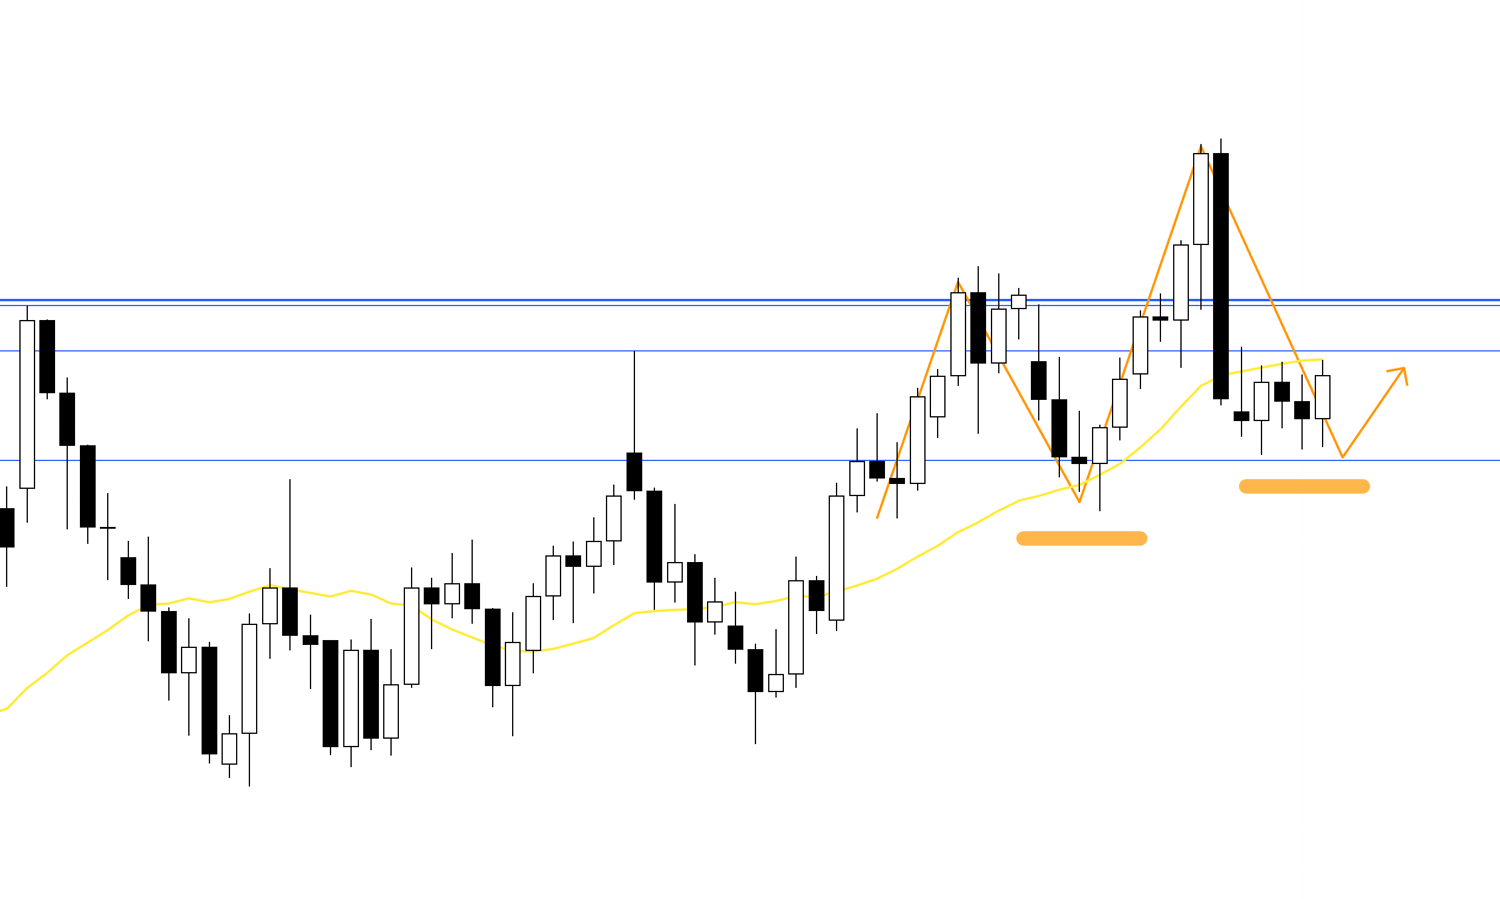
On the daily, as you can see, higher highs have been made and lows have not yet been taken out, so the uptrend is still intact.
However, price has already slipped below the moving average and is being capped from above, and it has also started to form a lower high.
Daily
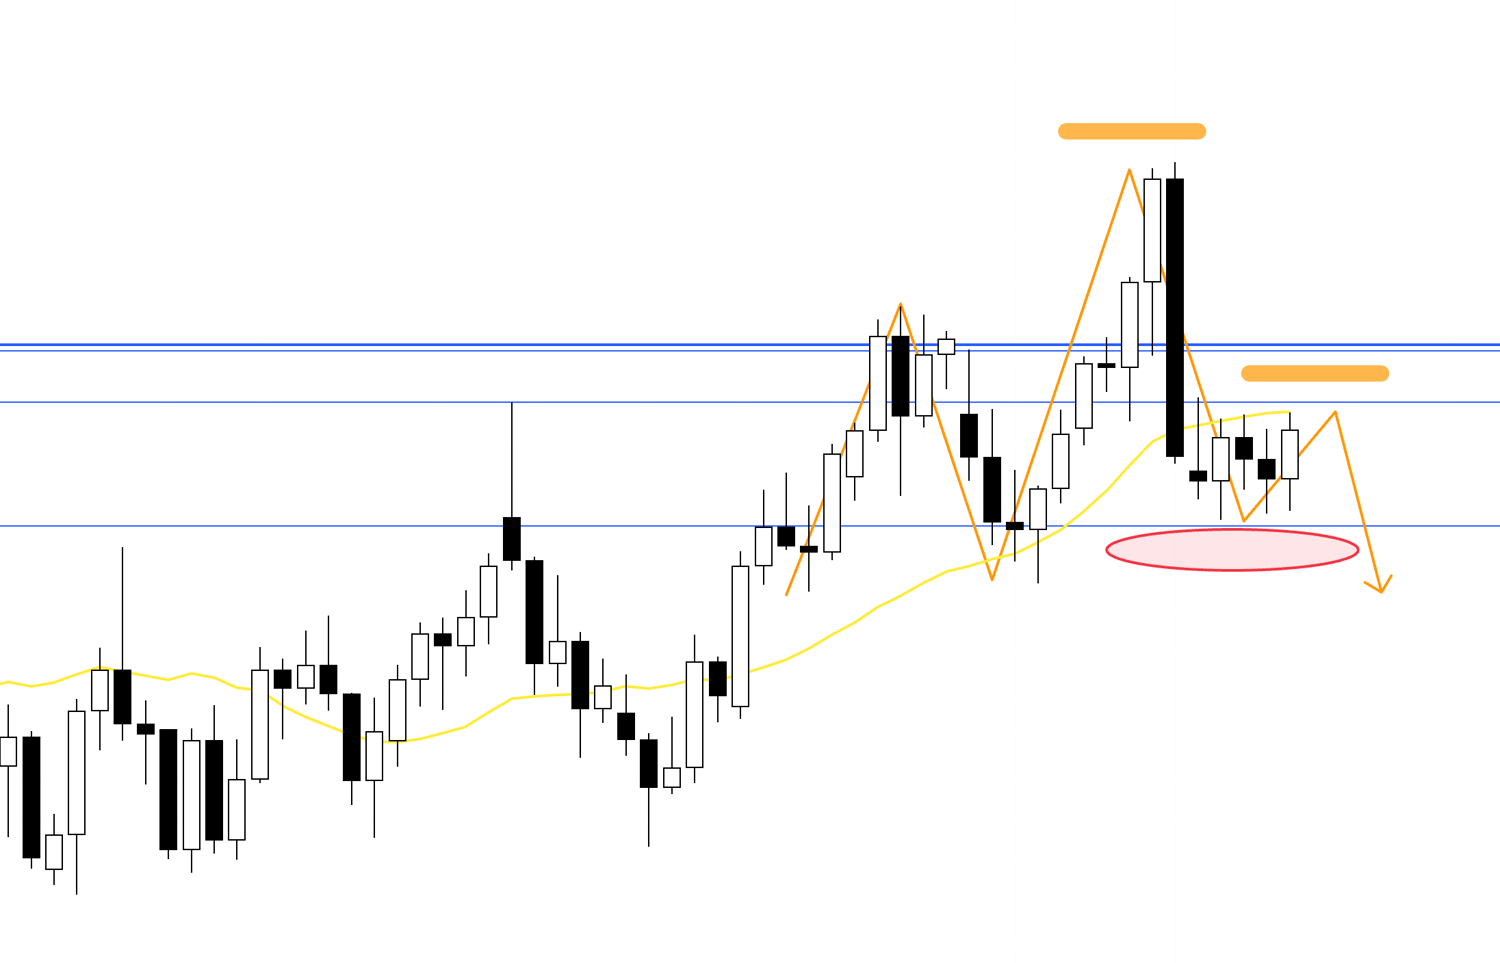
Since a new lower high is forming like this, if this low is broken the daily will reverse into a downtrend.
And just below this low there is likely an area where stop-loss orders from daily-timeframe traders who profited from the preceding uptrend and take-profit orders such as trailing stops are clustered, so if this area breaks further downside is likely.
That said, the weekly can still look like pullback buying, so you need a plan that accounts for that risk.
With that in mind, let’s look at the 4h chart.
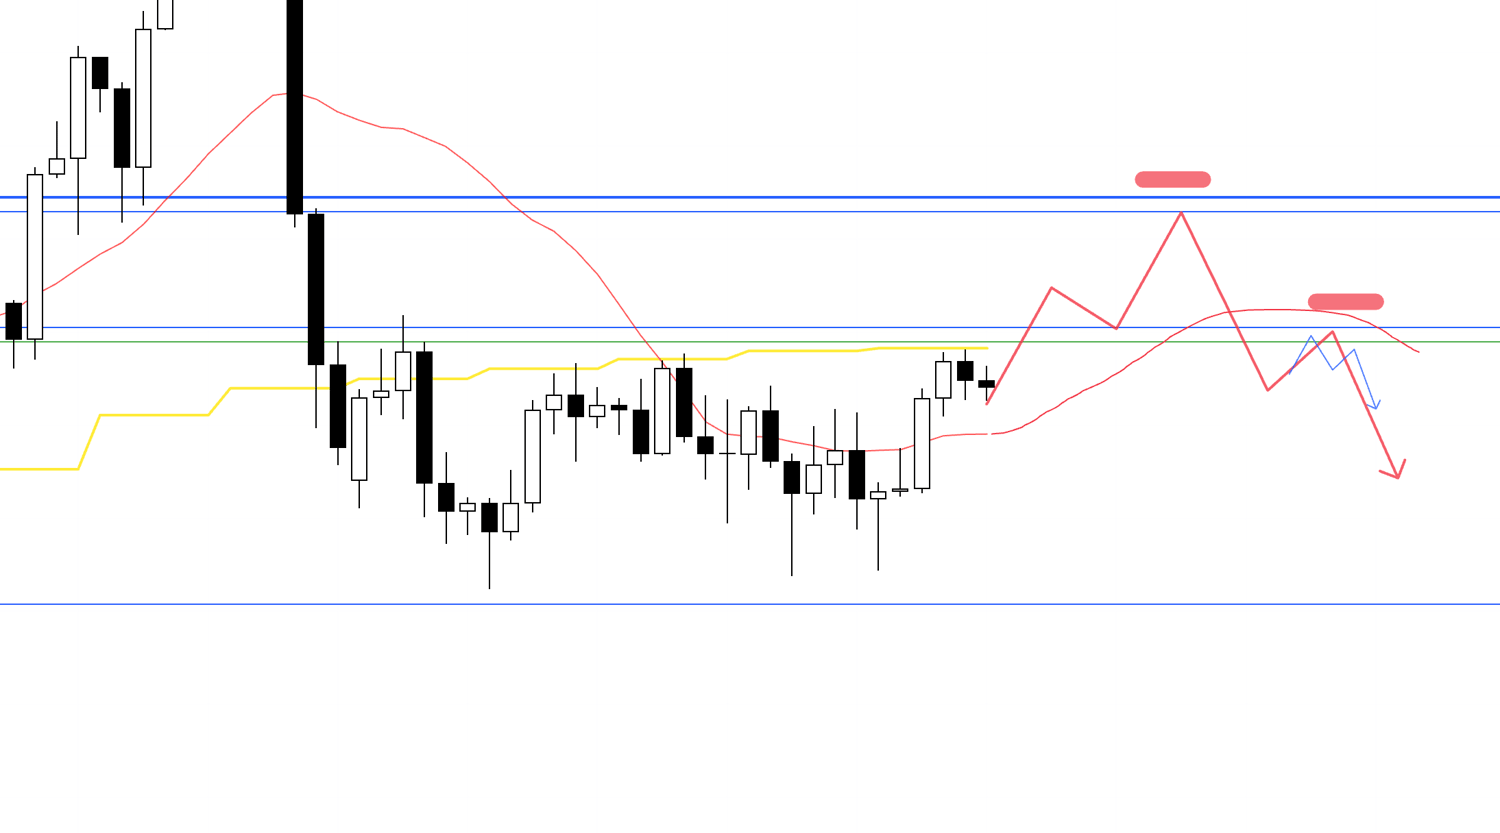
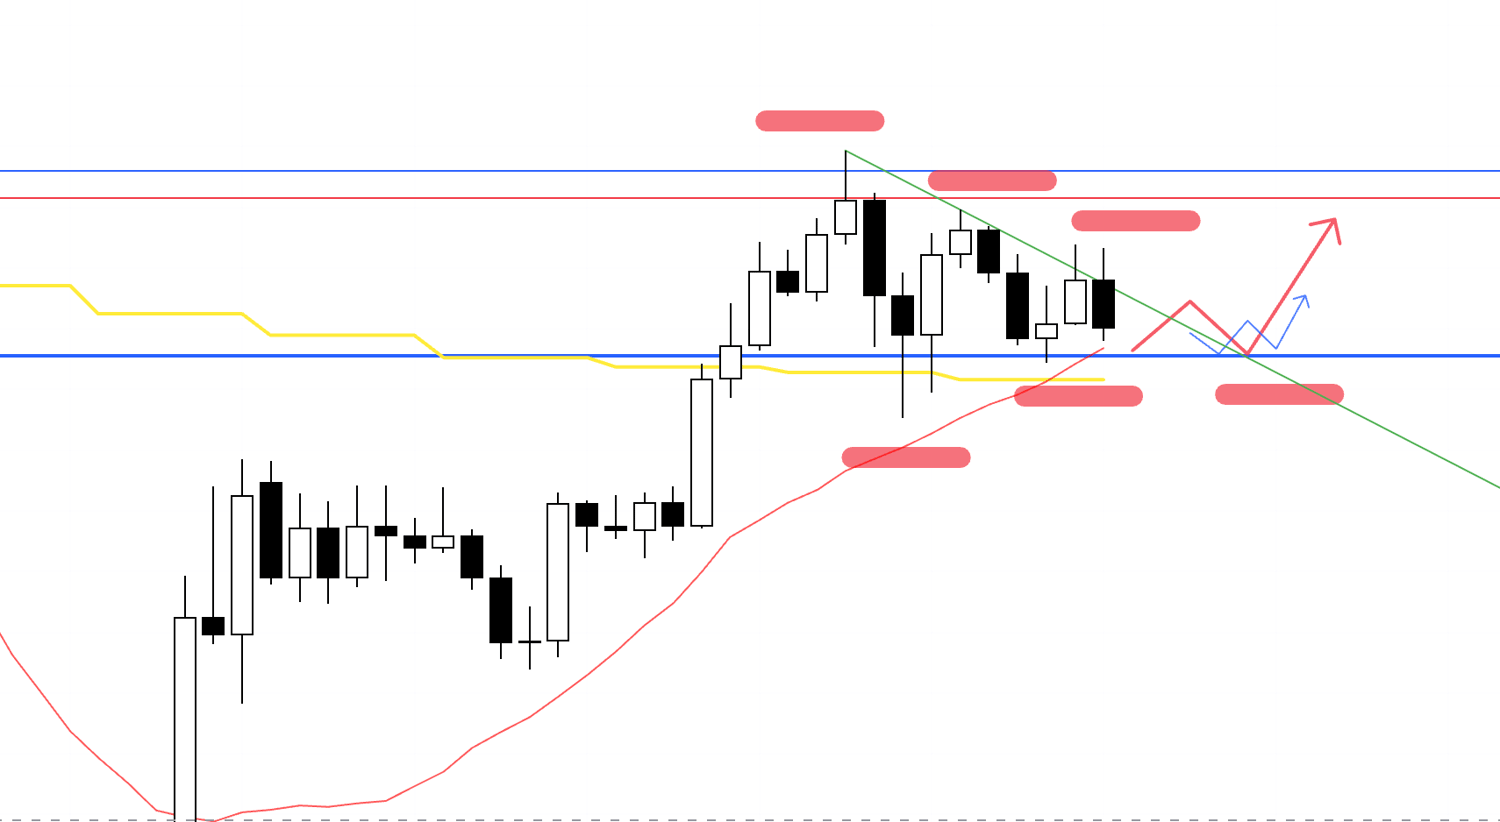
4h
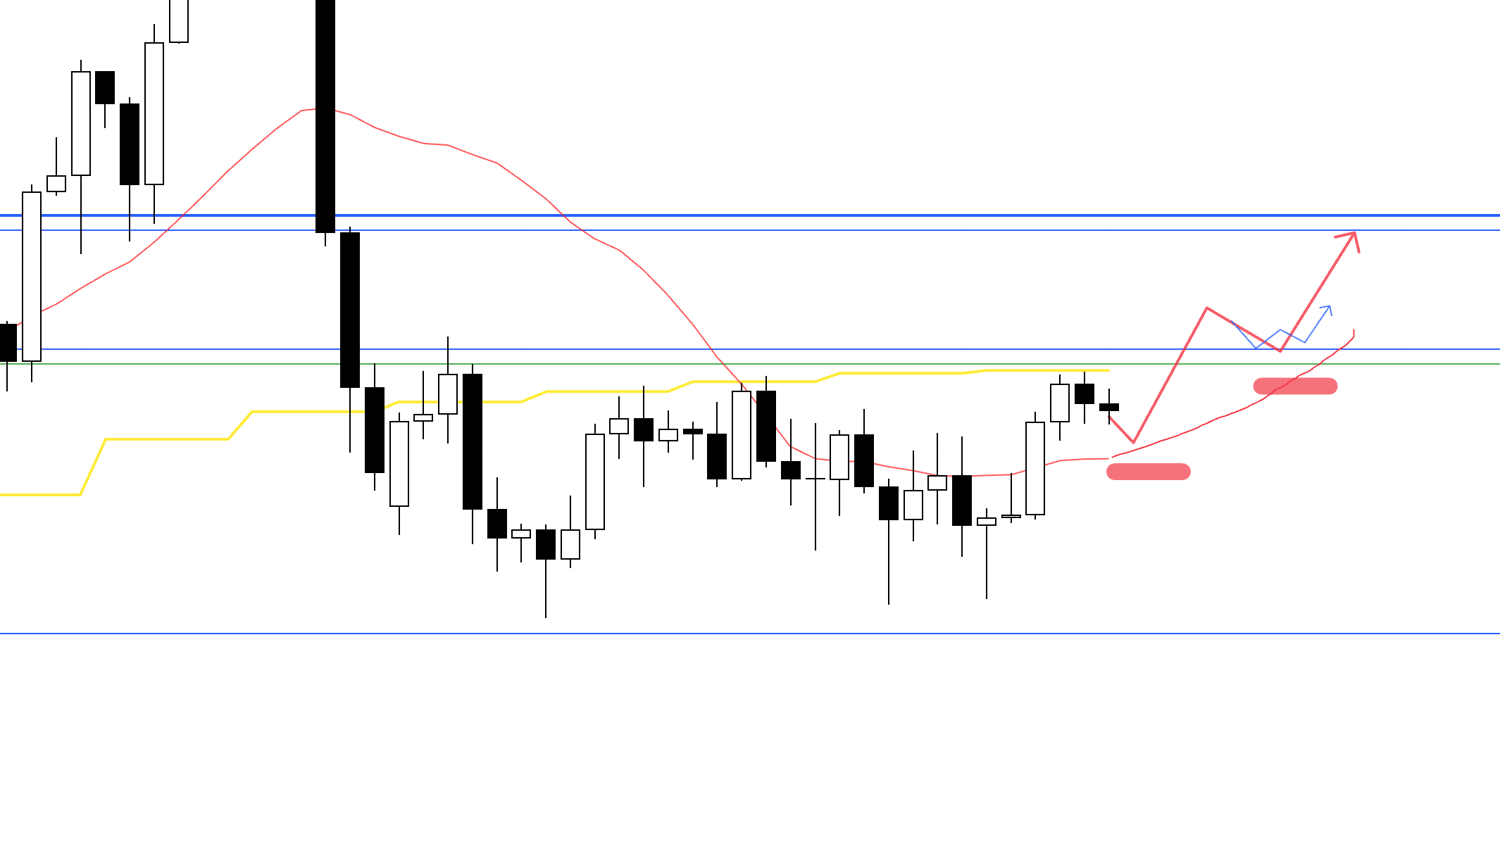
On the 4h the daily moving average and a resistance line are just above, so buying immediately from here is high risk.
Therefore, I will first look for a break above this resistance line, then a pullback, and if on a lower timeframe such as 1h (blue arrow) we make a higher low and break to a new high so that this resistance line begins to act as support, I will consider an entry.
However, there is also a strong resistance line further above, so whether the risk-reward up to that level is acceptable becomes the key at entry.
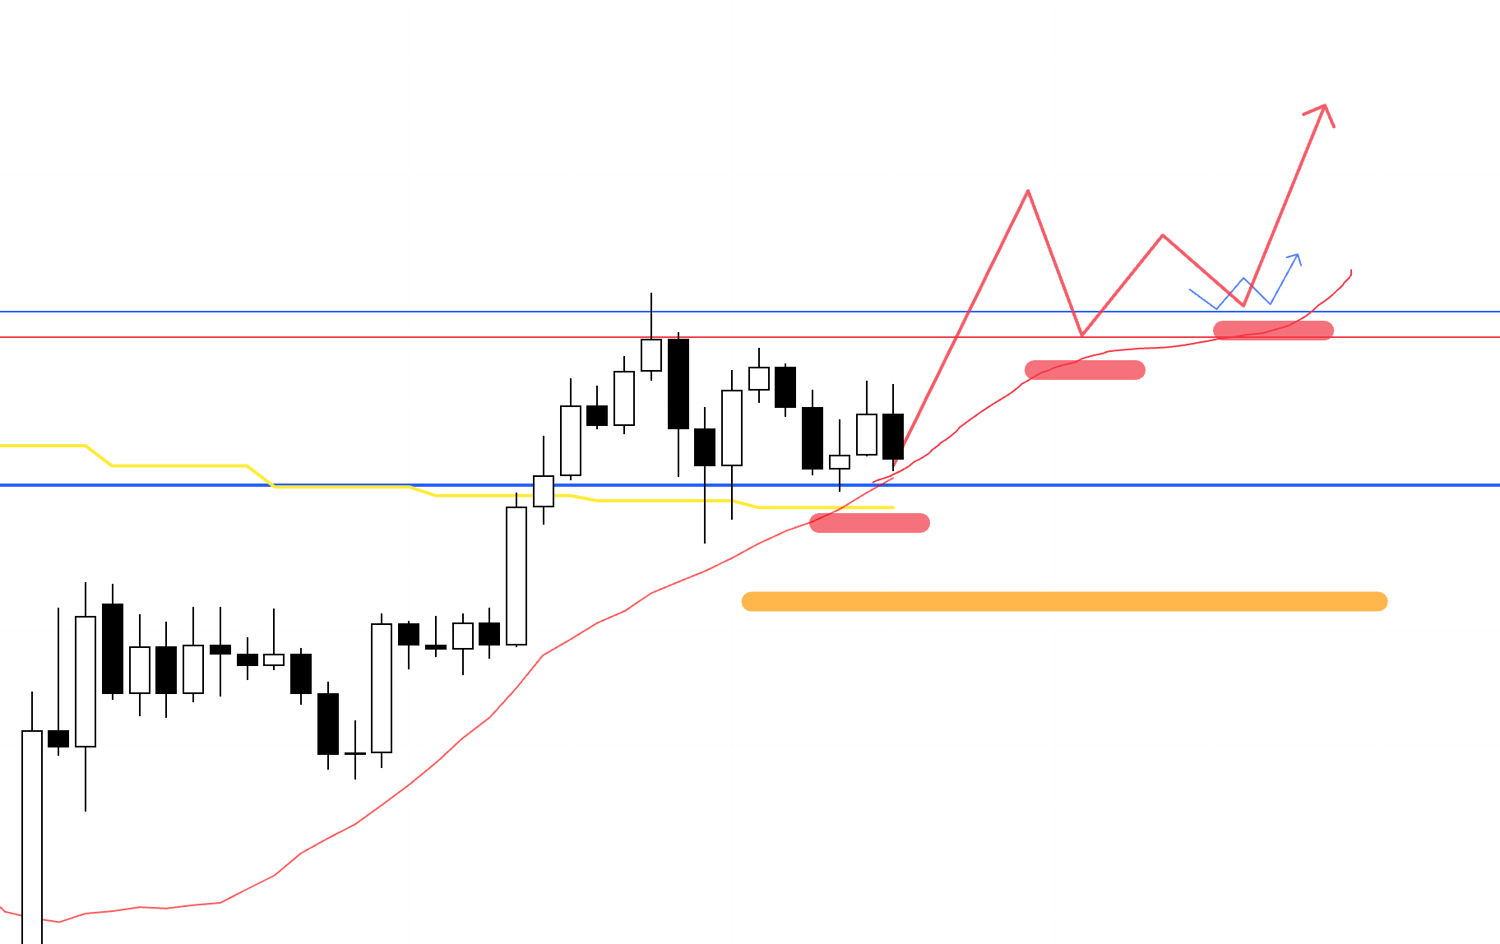
4h
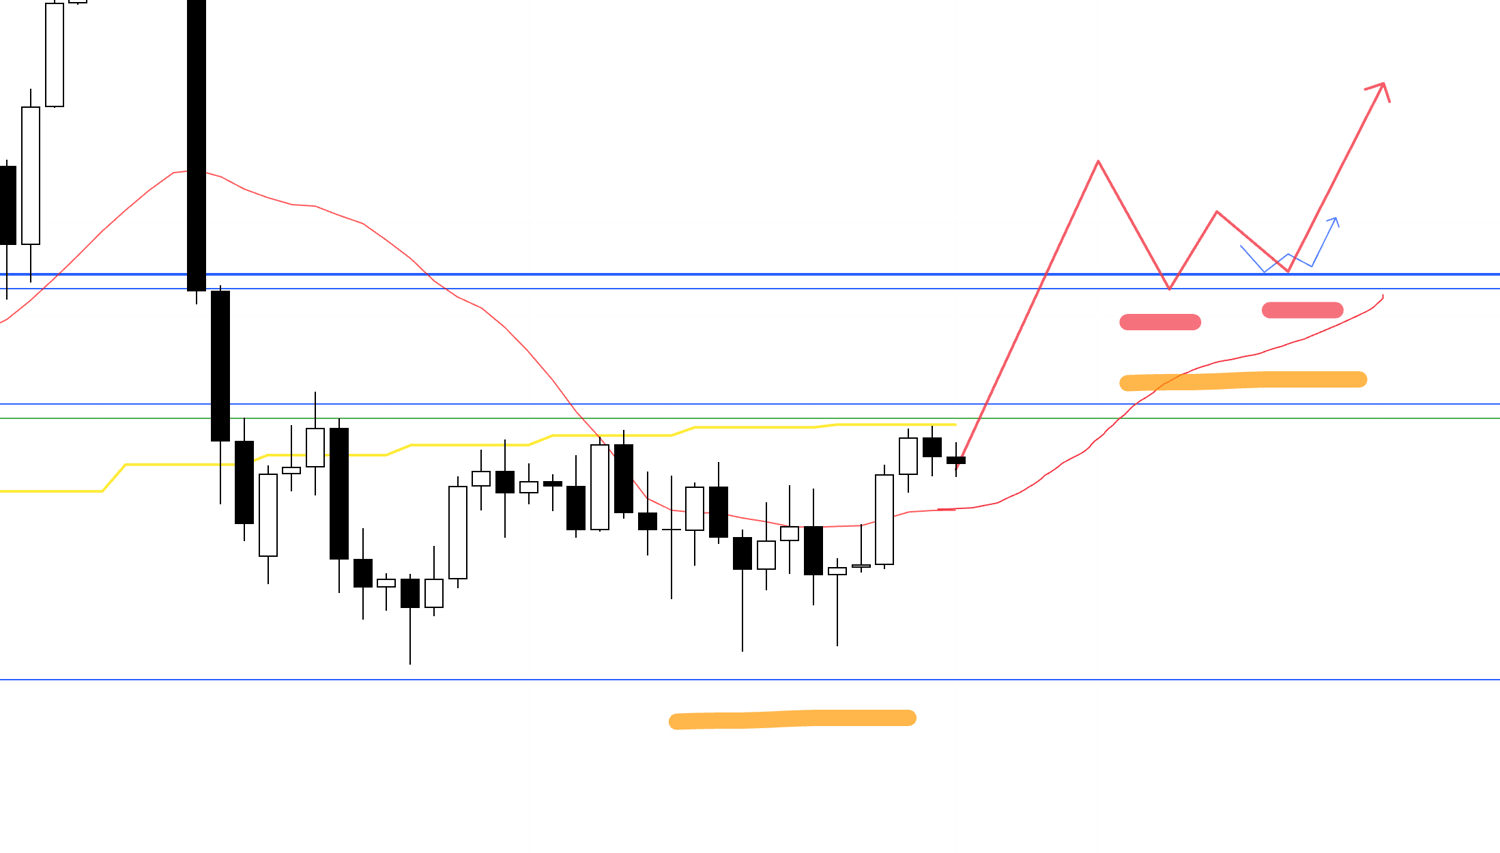
Alternatively, if price first clears this area, then forms a new daily low and the 4h resumes an uptrend, I will consider entries on 1h or 15m.
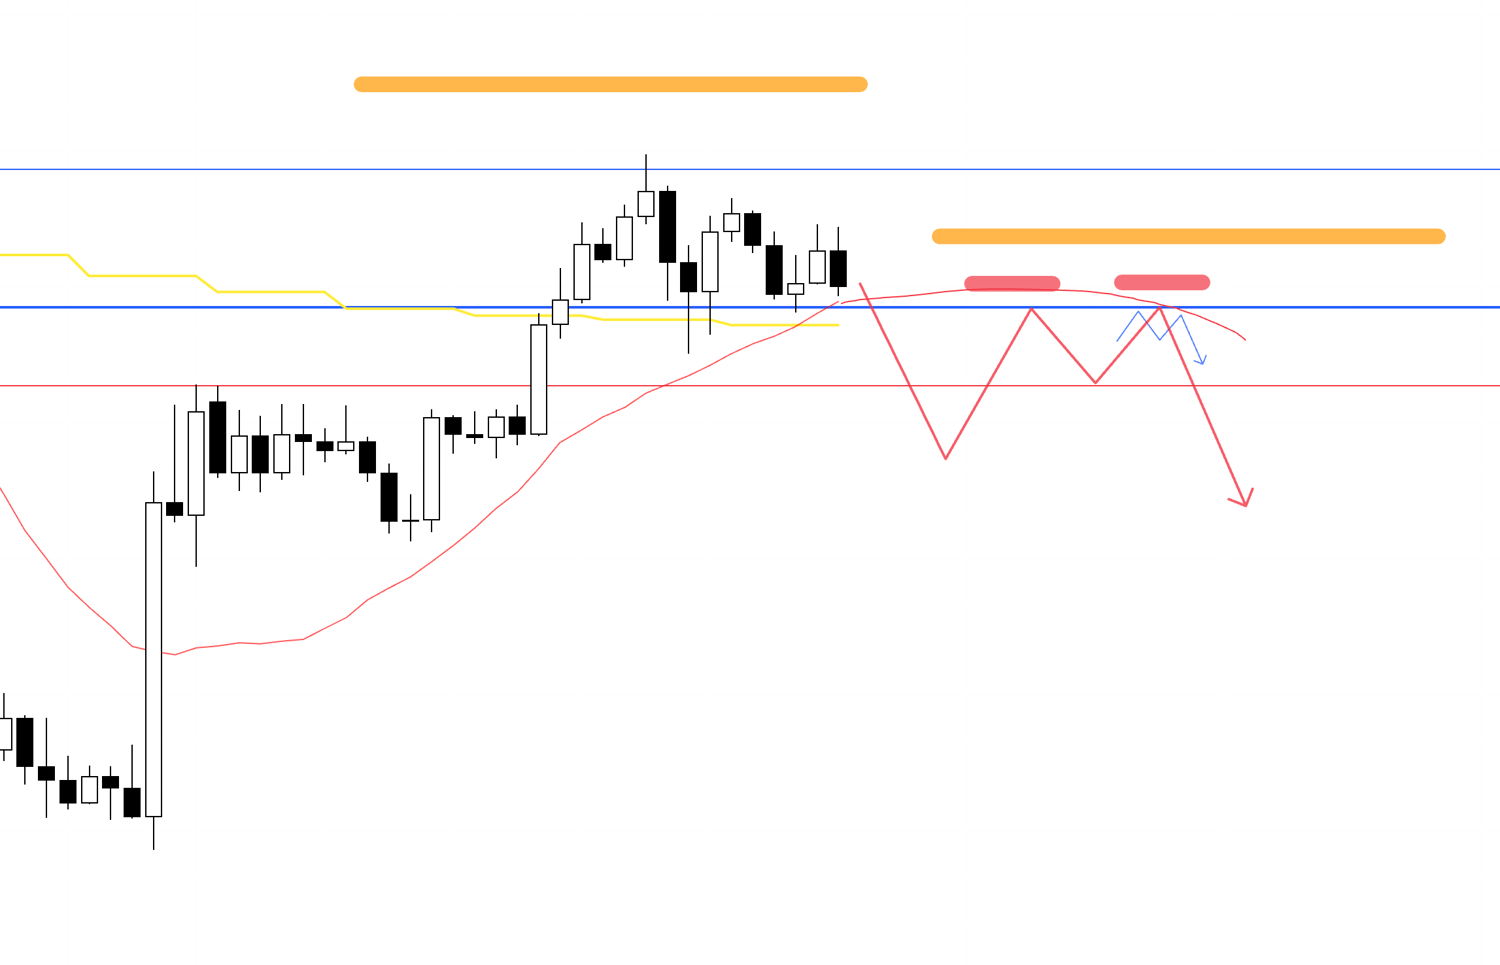
4h
Conversely, if price cannot break through these resistance lines, the 4h trend breaks again, and prior resistance starts capping price again, I will look to trade at a lower high on 1h within the 4h lower-high structure.
4h
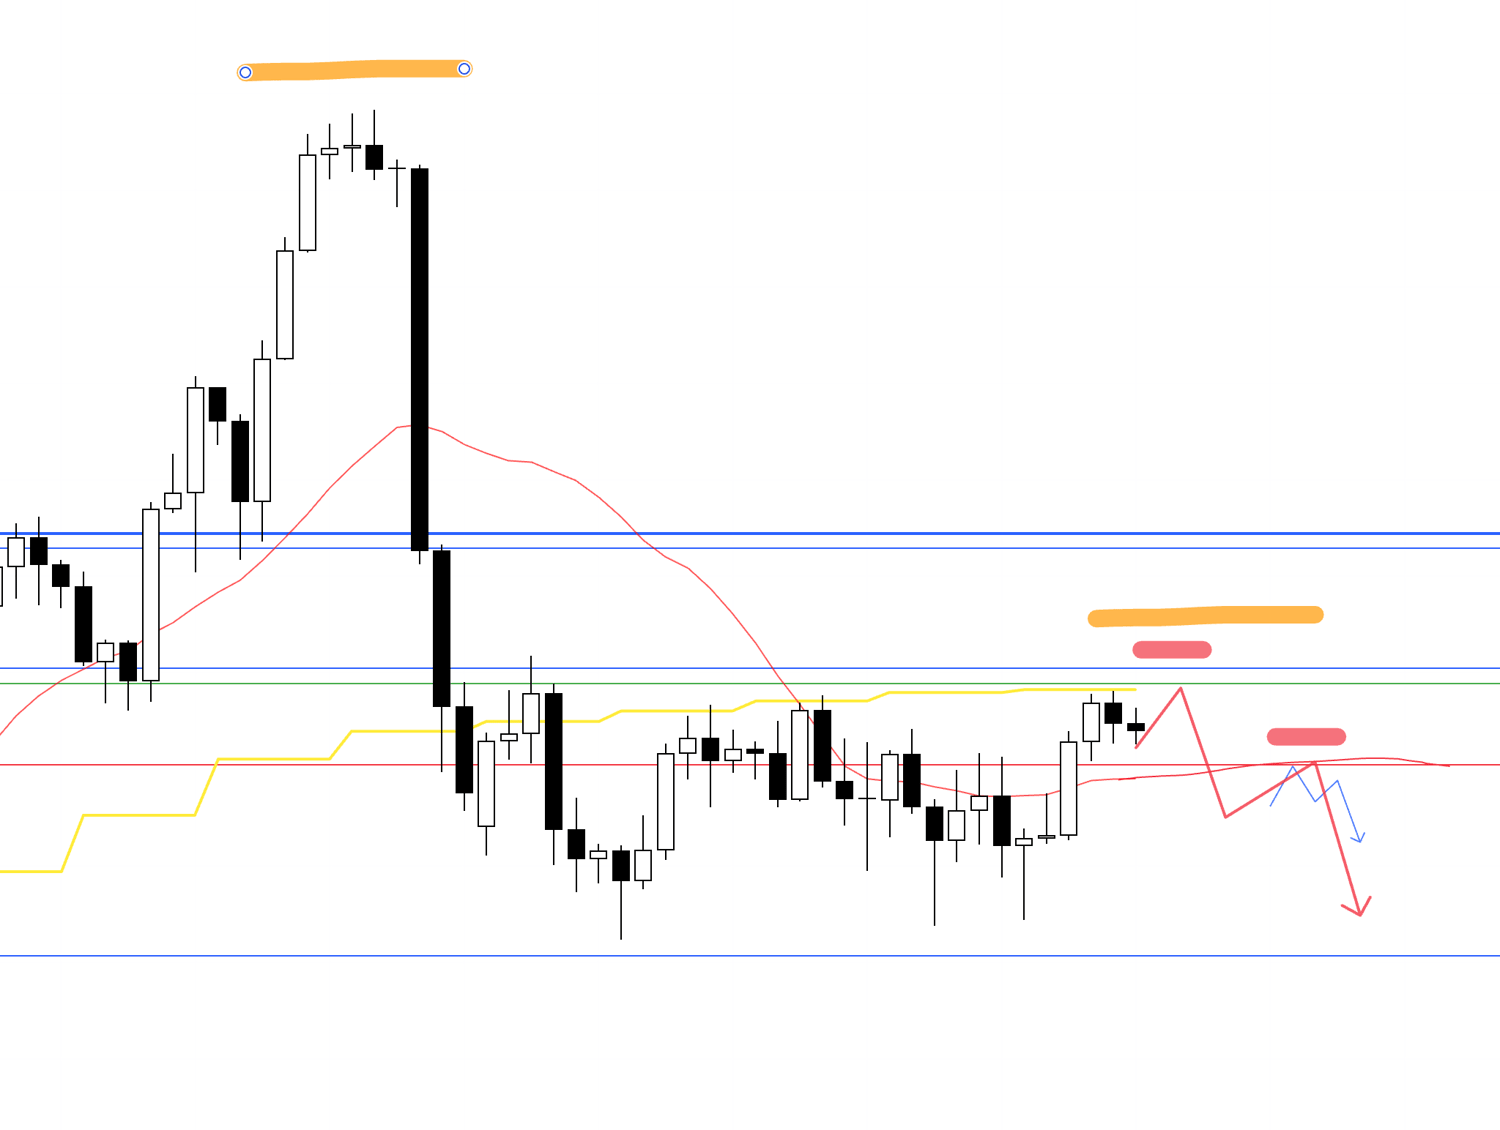
If, within the daily lower-high structure, the 4h also starts to put in another lower high, I will consider entries on still lower timeframes, but in that case buy orders have repeatedly appeared recently near the lower blue line, so the question is whether I can take a trade with acceptable risk-reward.
If a risk-reward that works on 15m appears, I will consider entering.
4h
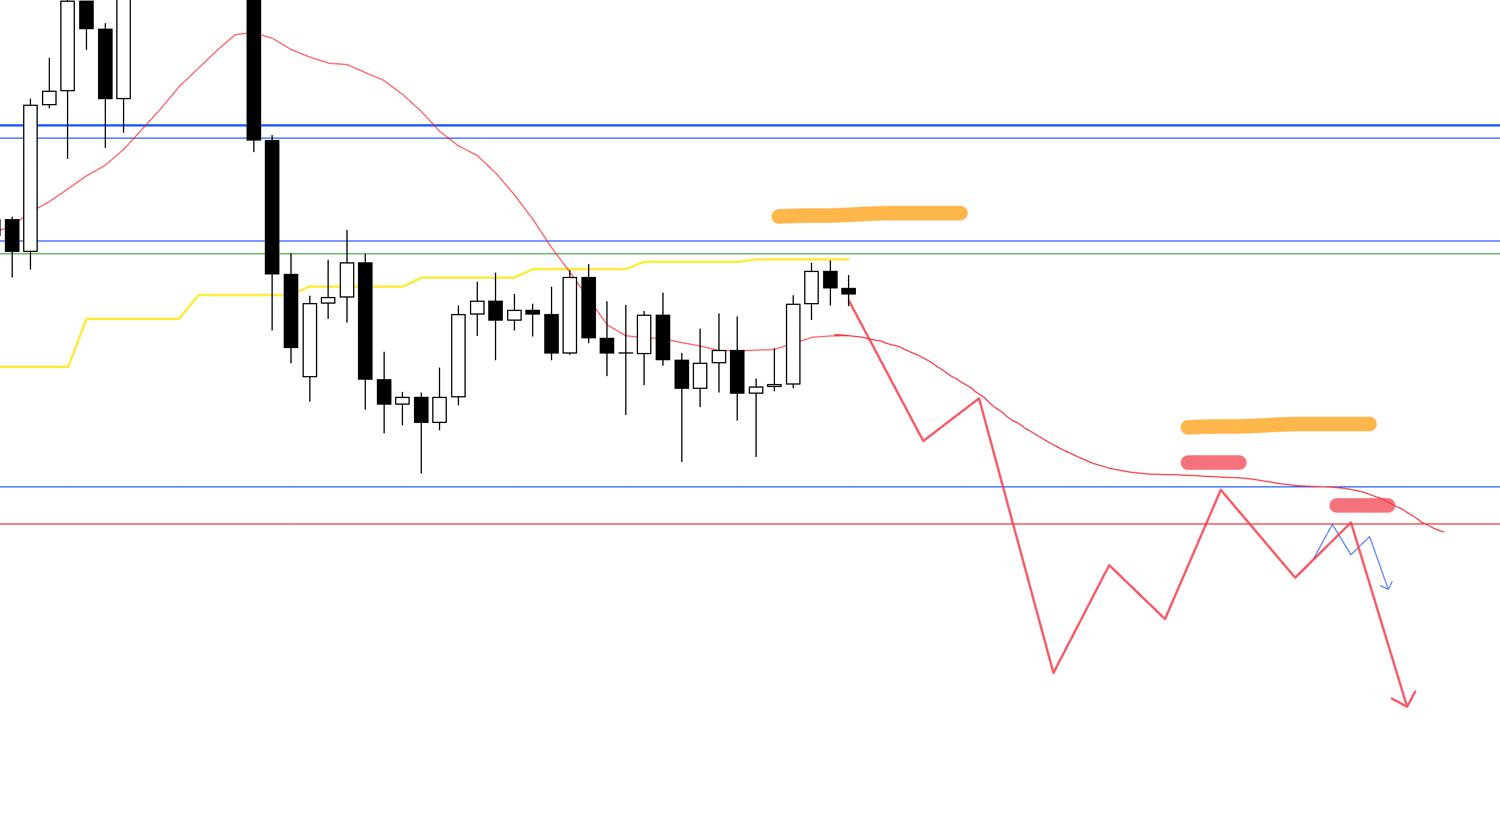
If the earlier short scenario is not viable because the risk-reward does not fit, I will look for a break below the lower blue line and, if price is then capped there and a lower high forms on the daily, consider entries on lower timeframes such as 1h.
Ideally, this would occur after first breaking the 4h downtrend and then turning back into a new downtrend.
〜・〜・〜・〜・〜・〜・〜・〜・〜・〜・〜・〜・〜・〜・
EURUSD
Next, let’s look at EURUSD.
Daily
On the daily, the uptrend was once broken and turned into a downtrend, but price has begun making higher lows and higher highs again.
As a weekly pullback buy, if the daily turns back into an uptrend, the long side gains the advantage.
However, it has not yet exceeded the high that started the prior downtrend, and there is a resistance line just above that must be taken into account, so you need a plan that factors these in.
Let’s look at this on the 4h.
4h
This area is boxed between levels that act both up and down, and on the 4h price action is converging with lower highs and, at the same time, higher lows, making direction hard to read.
If price is supported at the lower blue line and forms another higher low, and if a lower timeframe such as 1h also turns into an uptrend, I will consider buying, but the key will be whether the risk-reward works.
If the risk-reward does not work, I will skip this trade.
4h
If the risk-reward does not fit and I pass on the earlier long scenario, and price breaks above the upper blue line and then, while being supported again, forms a new higher low on the 4h, I will consider entering as a daily pullback buy.
4h
For a short, if price breaks below the lower blue line and is then capped there, and a lower high forms on a lower timeframe such as 1h, I will consider selling.
However, at present the daily is making higher lows and higher highs and is in an uptrend, so around the red line pullback buying on the daily may still step in, making it a high-risk situation.
Therefore, even if price breaks and is capped at the blue line, it is difficult to sell immediately, so I will first look for at least a short-term lower high on the daily and then consider an entry at a 4h lower high.
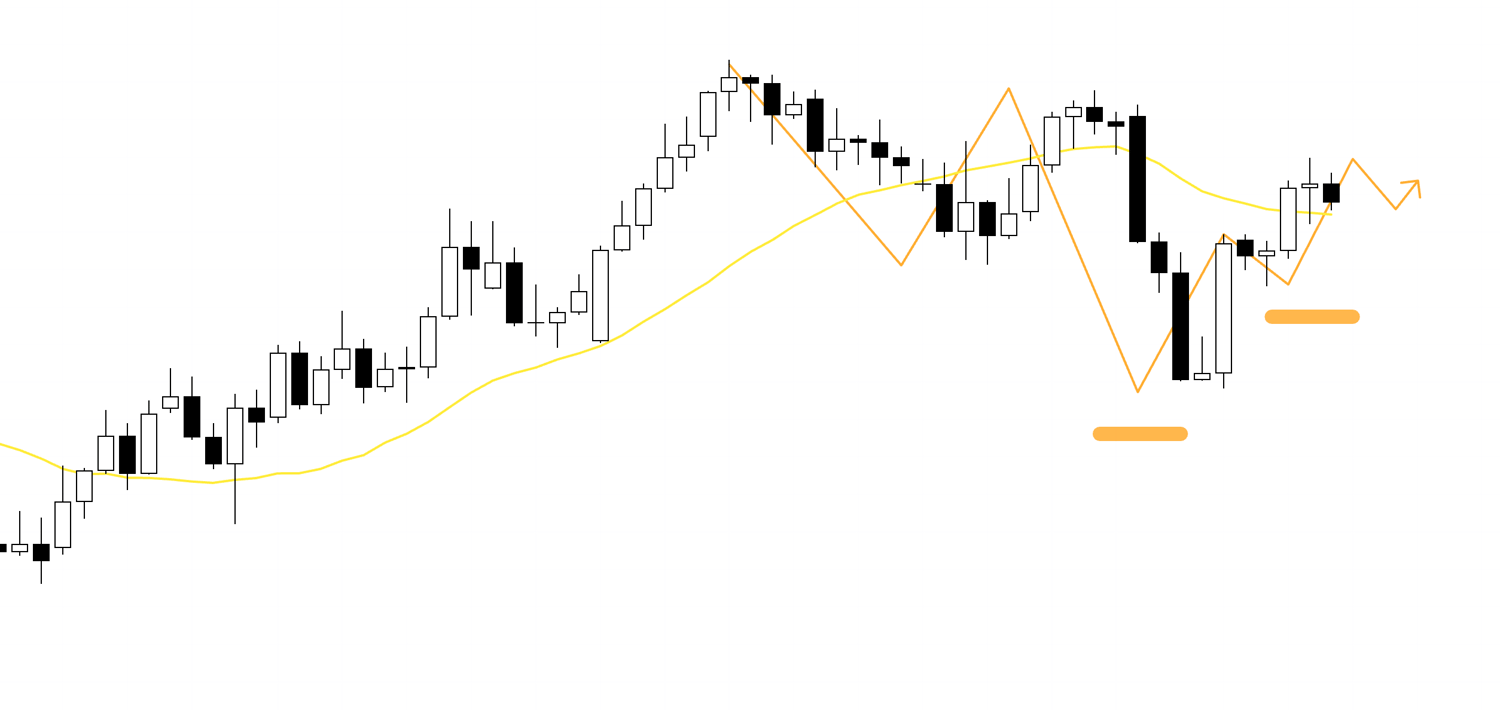
4h
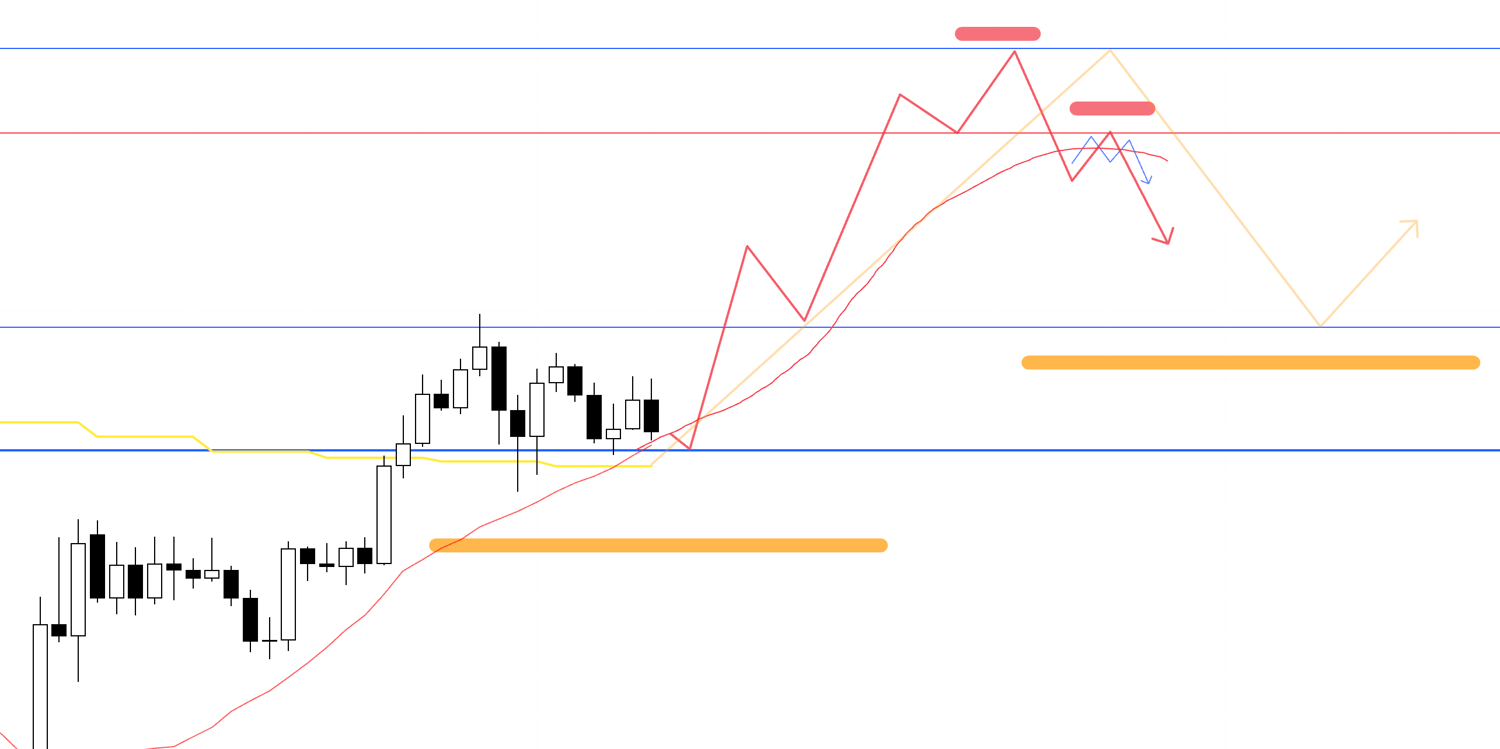
After an initial rise, a point where the 4h uptrend breaks and turns into a downtrend is also a place to consider a short as a decline that closes the gap with the daily moving average.
This is a trade that aims to capture the "decline that forms the daily pullback" on a lower timeframe, but you must keep in mind that it is a daily pullback.
I overlaid the daily movement in light orange on the 4h chart, and if a higher high like this is made the daily is in a state of "wanting to buy on dips," so the lower price goes the stronger the buying pressure as a daily pullback becomes, and you have to take that into account.
Whether a point appears where you can sell from as high a level as possible becomes the key, and in terms of profit-taking you will need a plan such as banking half around price zones where daily pullback buying is likely to appear.
〜・〜・〜・〜・〜・〜・〜・〜・〜・〜・〜・〜・〜・〜・
That is all.
These are scenarios as of now, and as the week actually begins and price action unfolds I plan to update and build the scenarios each time while watching what the market does.
As you will see from my scenarios and my actual trades, I place great emphasis on identifying in advance what risks are lurking where.
This enables me to secure half the profit at appropriate points, maximize profits amid uncertainty, judge whether a trade is worth taking and whether the risk-reward makes sense, and incorporate that into the scenario.
If there are many traders who want to sell very close to the point where I want to buy, that trade becomes highly unfavorable.
These hidden risks cannot be seen by looking at a single timeframe alone, so you must always look at "how traders on other timeframes are thinking," and when entering it is important whether many traders will concentrate orders in the same direction.
Even if chart patterns look the same at first glance, if the higher timeframes differ the meaning changes completely.
I also wrote about this in a previous blog on moving averages, so please give it a read.
I hope this is helpful.
This is solely my trade plan, so if you have not yet settled on your own approach to trading, please feel free to use it as a reference for building your own strategy.
But if your own trading is already set, please stick to your rules without being swayed by my trade plan.
And as I wrote in yesterday’s blog, I will be busy on Tuesday and Thursday next week, so I am not sure how much trading I will be able to do on those days.
I wanted to let you know in advance.
Also, I will be busy on Saturday as well, so the blog update may be a little delayed, but I will make sure to update it, so please don’t worry.
Thank you for reading to the end.