

I will review the key trading points with a focus on the trades I executed this week.
This "Weekly Trade Report" will be posted every Saturday.
If you read it together with the "Trading Scenarios" posted every Sunday, I believe it will help you see how I think ahead of time and how I actually trade based on those scenarios.
This "Weekly Trade Report" was slated to become paid content starting in August, but due to popular demand the free period has been extended and it remains public.
This is not advice like "let’s trade this way," nor am I claiming that this is the right answer.
It is also not intended to showcase individual wins and losses, nor to recommend any particular strategy based on those outcomes.
It is to demonstrate at a practical level the "consistency of process"—how I repeatedly execute a consistent process based on advance scenarios—so that it can serve as a reference for building your own strategy and process consistency.
The results are solely my personal outcomes and do not guarantee your future profits.
With that fully in mind, please conduct thorough testing and preparation for your own trading, and take responsibility for your actions.
Now, please see the charts below.
USDJPY 4h

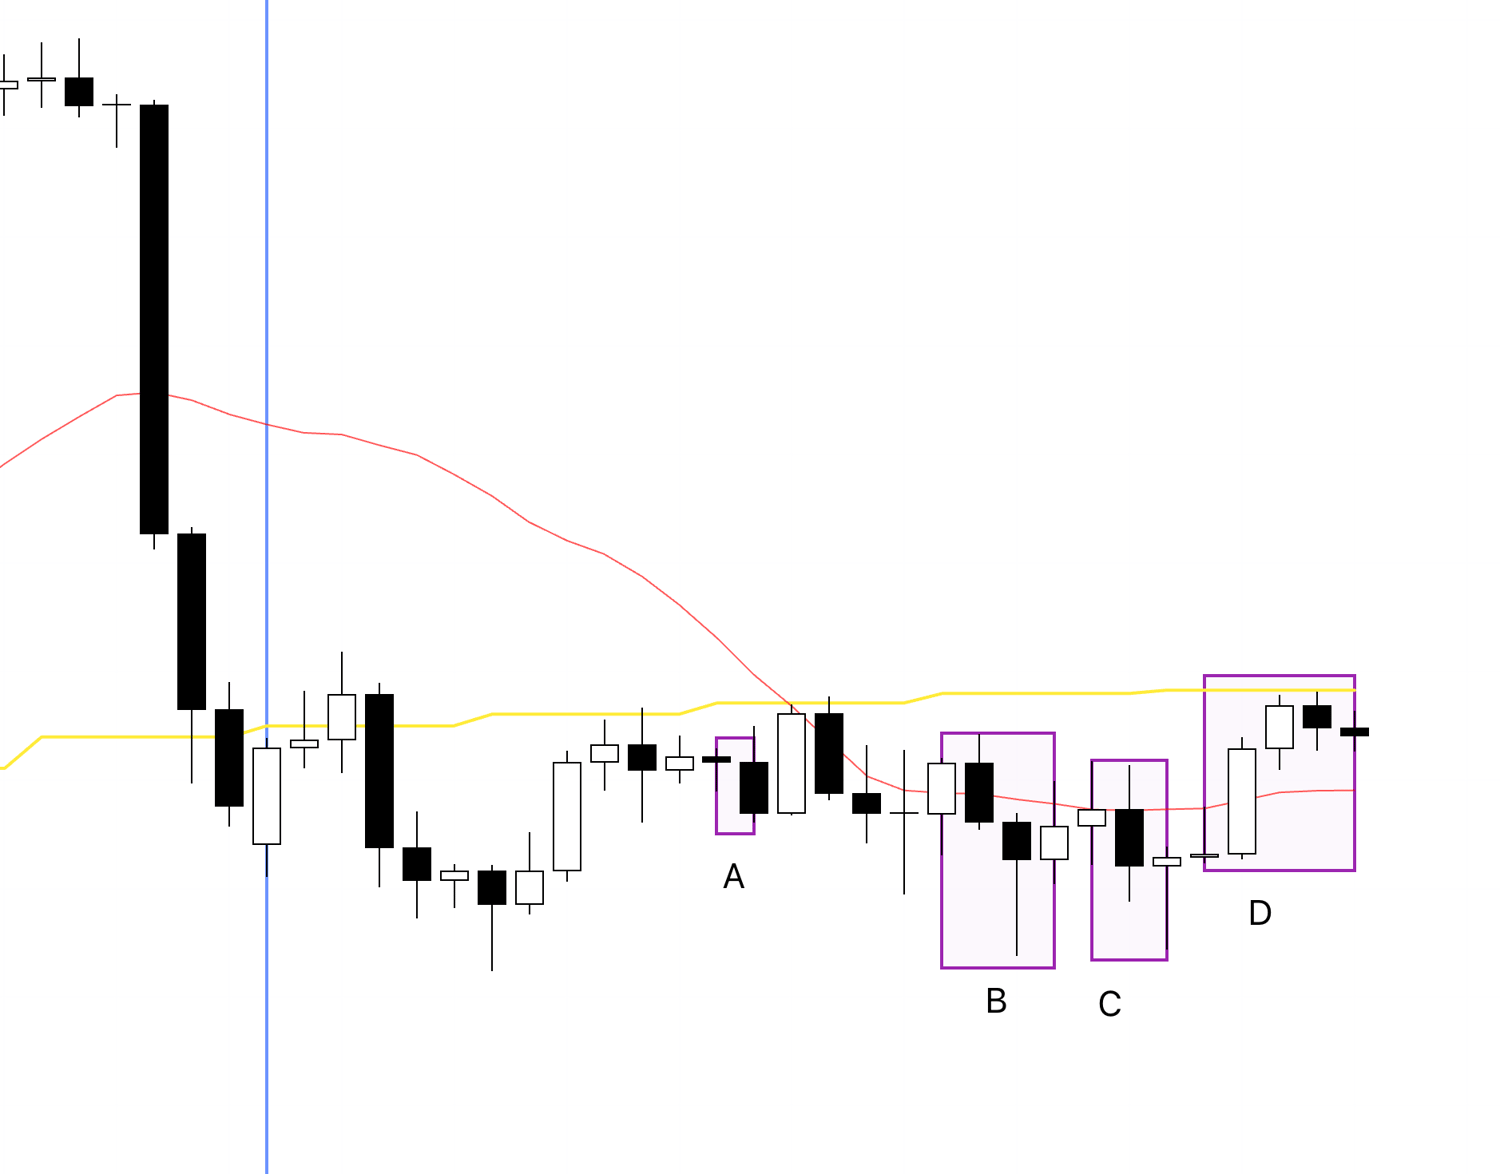
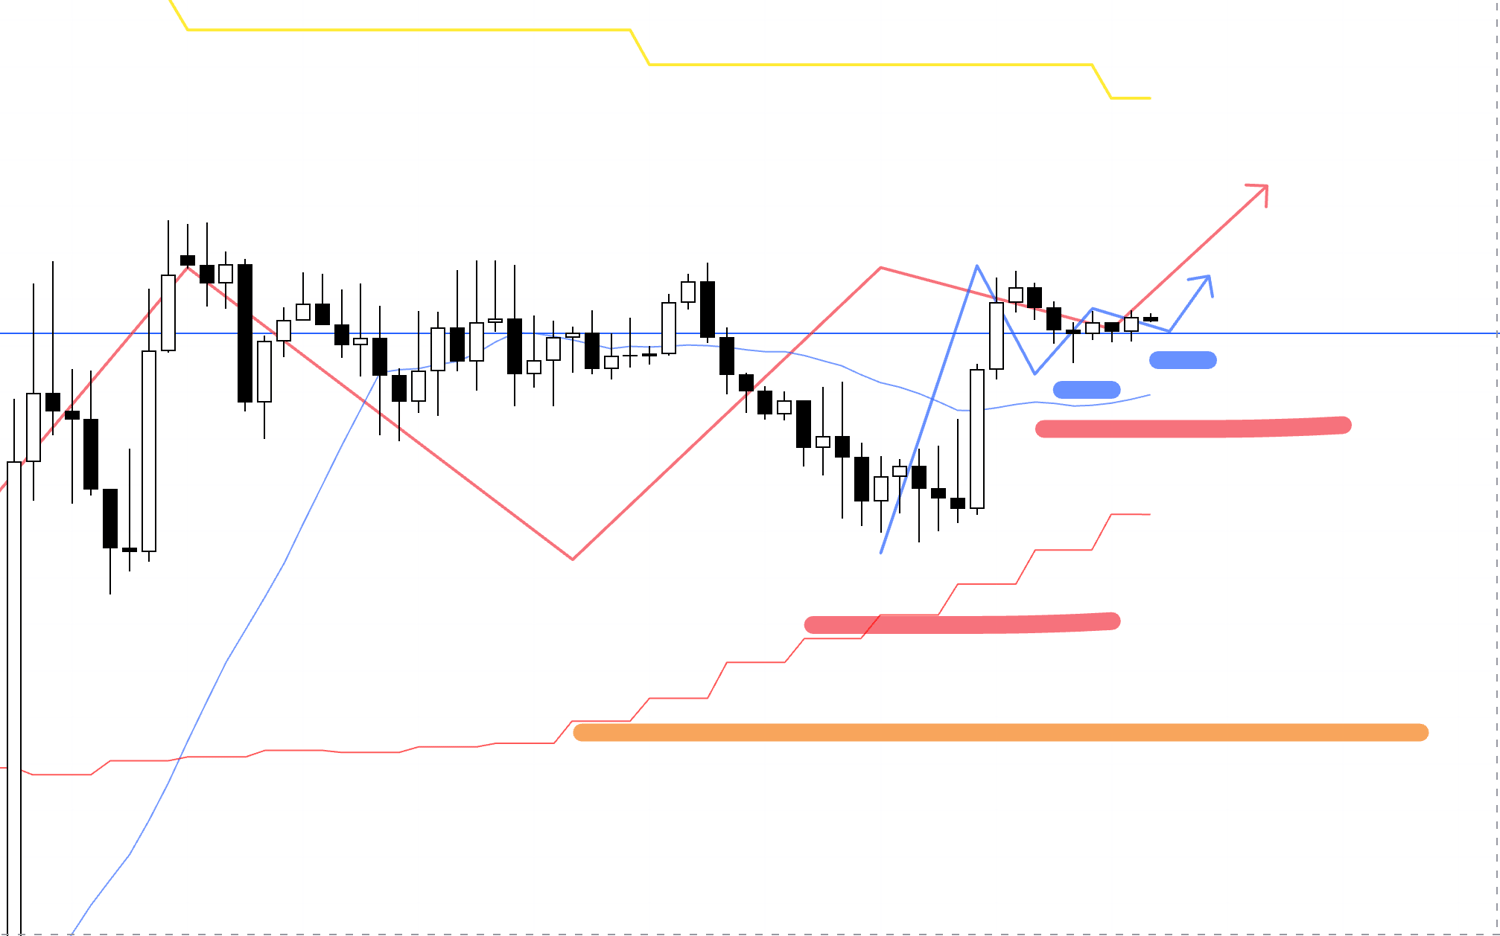
This is the USDJPY 4h chart.
This week’s price action is to the right of the blue vertical line shown on the chart.
I execute pullback buys and rally sells on the 4h, and this week in USDJPY there were three points to consider selling a rally on the 4h and one point to consider buying a dip, four in total.
(For the dip-buy and rally-sell strategies, please see my past blog posts on Dow Theory and multi-timeframe analysis.)
In practice I traded only two locations, A and D, and did not trade B or C.
I will explain later why I skipped them.
Next, please see the EURUSD chart below.
EURUSD 4h
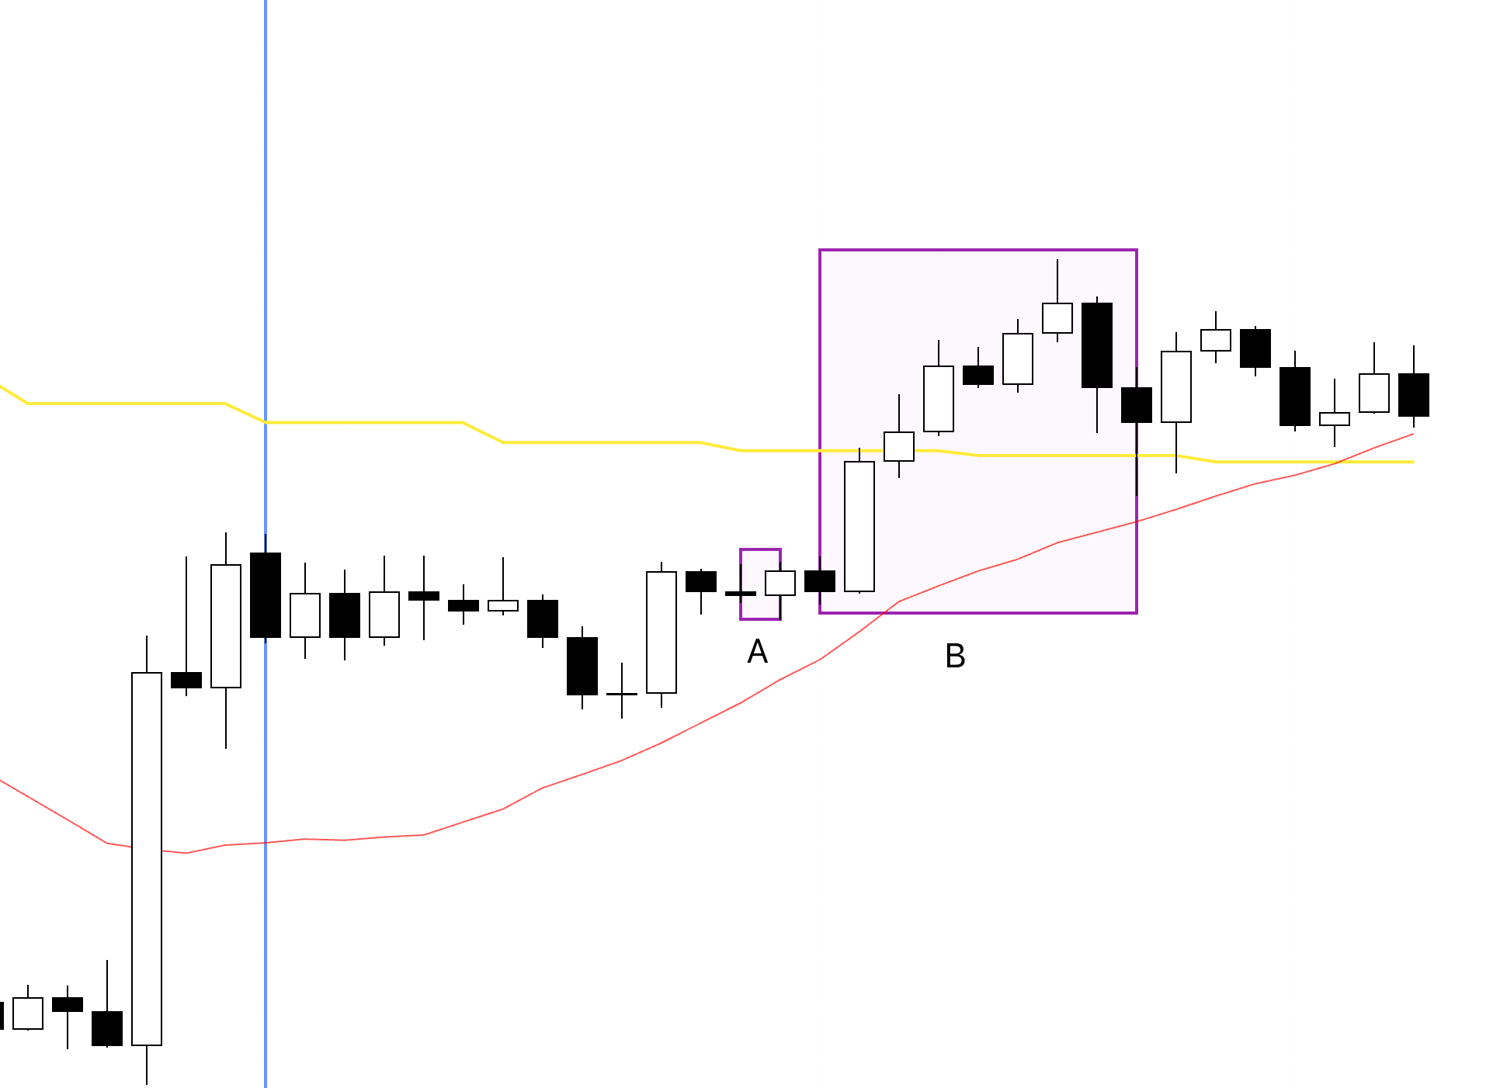
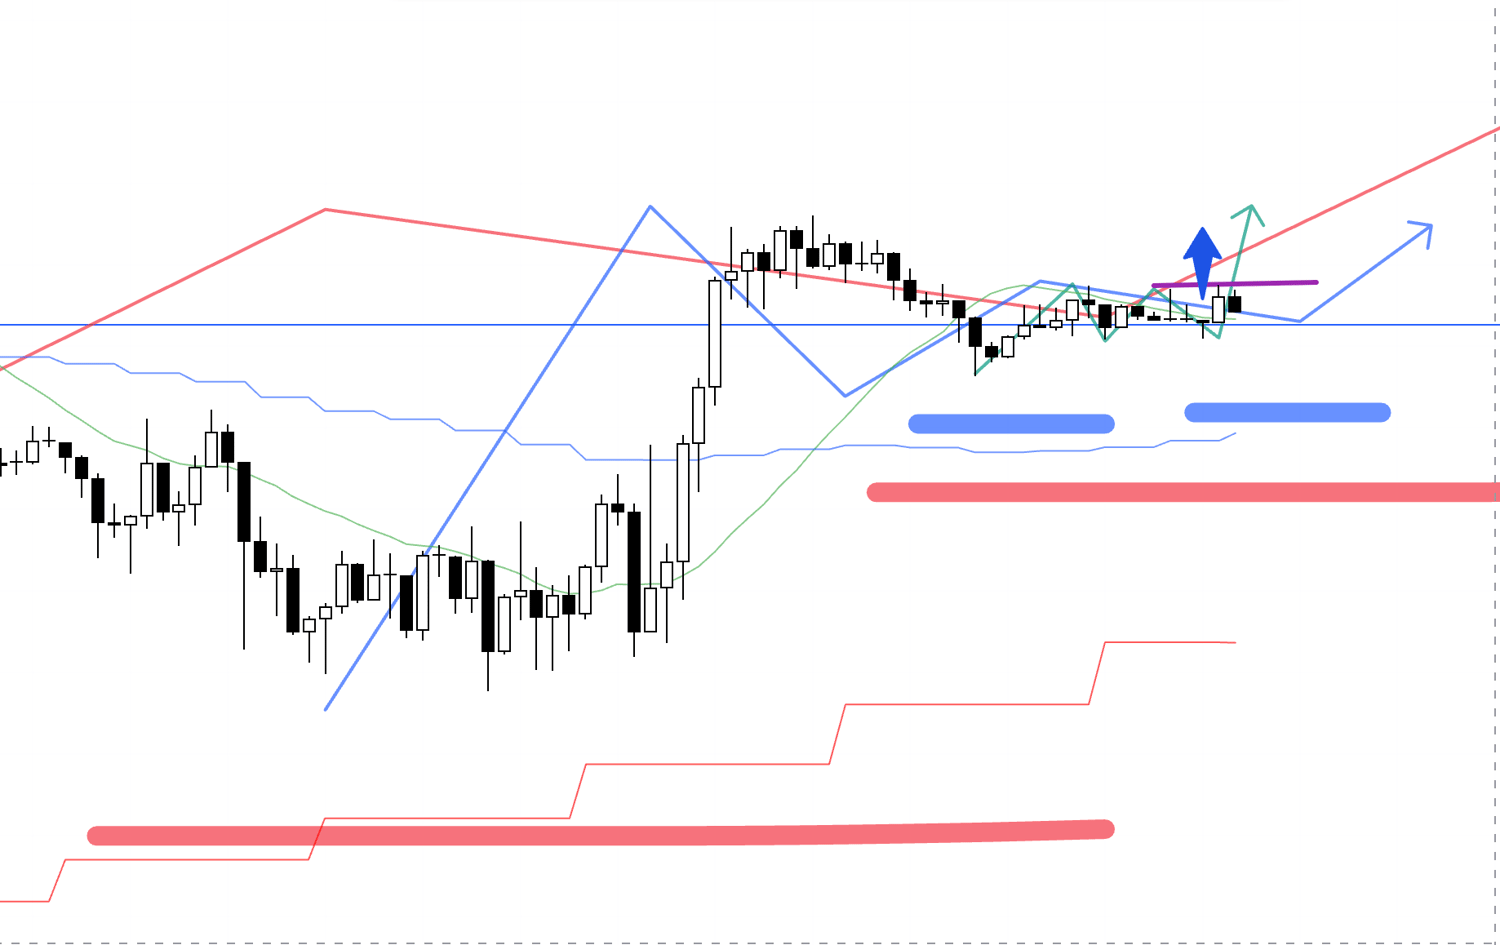
This is the EURUSD 4h chart.
There were two 4h pullbacks to buy in EURUSD this week.
The point I actually traded was A.
I was watching point B right up to the moment, but I had an important commitment that day and was about to board a flight, so I could not take the trade.
I will explain later.
I was busy this week with non-trading personal matters and could not trade from my usual device, so it was difficult to take my time capturing screenshots and writing my usual commentary, but I will still provide as detailed an explanation as possible, so I appreciate your understanding.
By the way, I will also be busy on Tuesday and Thursday next week, and I am not sure how much I will be able to trade, so I wanted to let you know in advance.
First, for USDJPY at points A and D where I actually traded, and for EURUSD at point A, I took screenshots while watching the charts in real time and recorded what I was thinking, so please start by reviewing those.
〜・〜・〜・〜・〜・〜・〜・〜・〜・〜・〜・〜・〜・〜・
August 6 (Wed)
USDJPY
4h
The short setup we outlined in Sunday’s scenario has appeared.
As part of a daily chart sell-the-rally setup, the 4h formed a lower-high point, so I will enter where the lower timeframes flip into a downtrend.
1h
Within the 4h lower-high area, the 1h is in an uptrend forming a 4h pullback high.
However, it is attempting to set a lower high, and if it breaks the recent low, that will end the prior uptrend and start a new downtrend.
This aligns with the daily and 4h downward direction.
15m
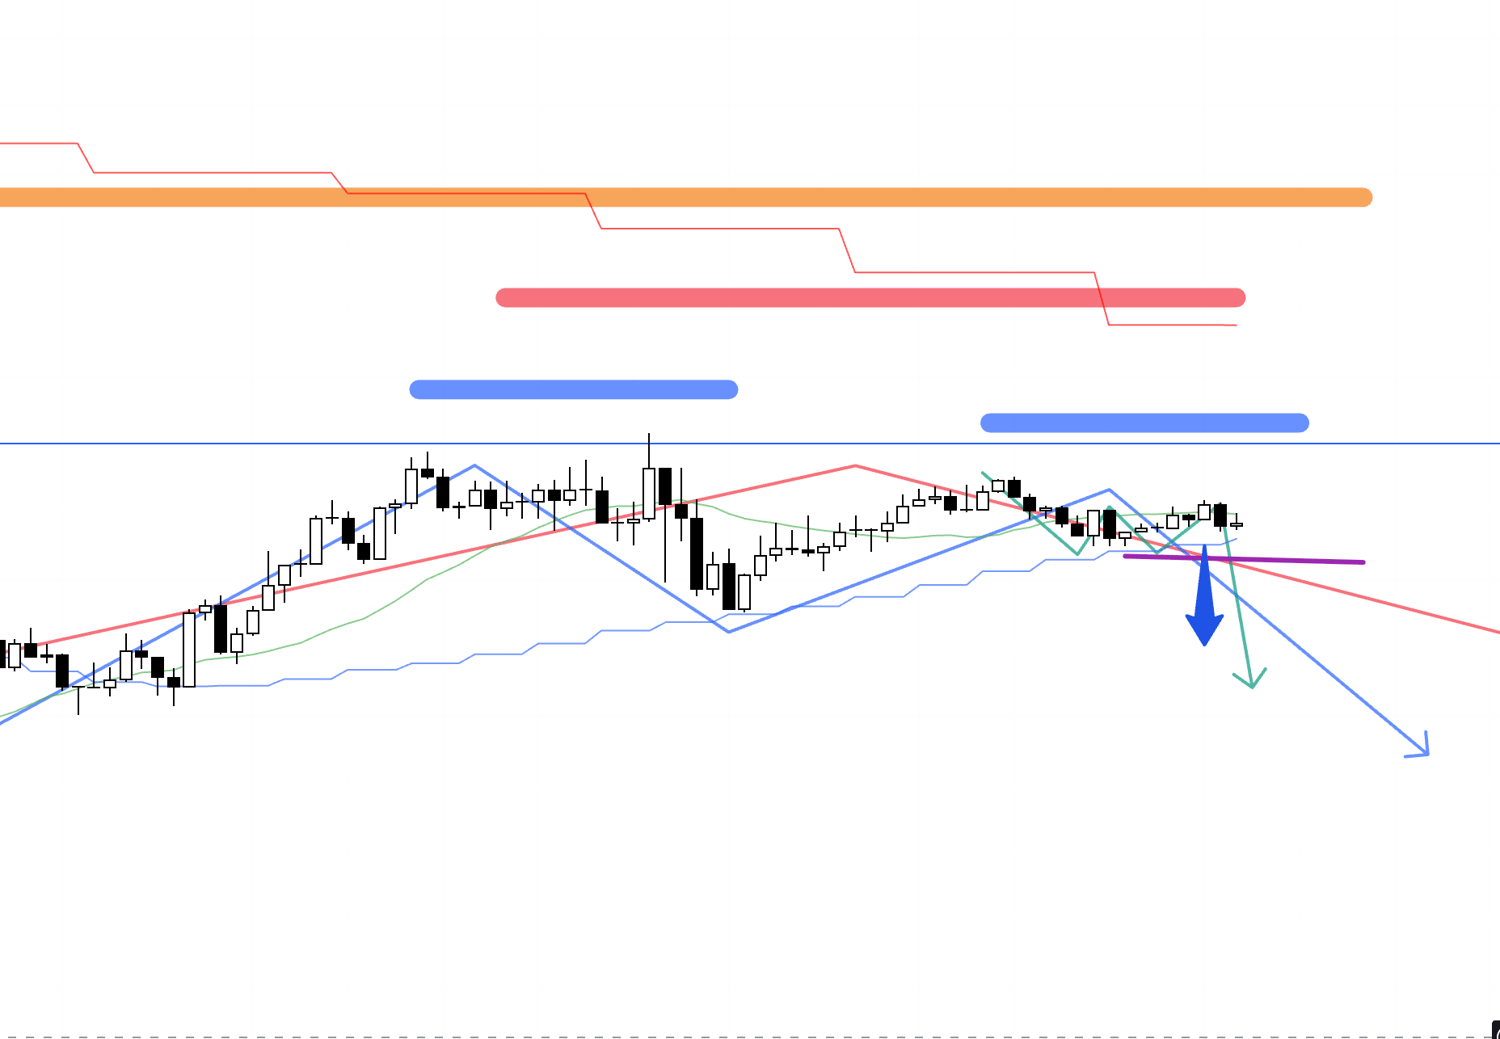
To enter a bit earlier, I will enter where the 15m first flips to a downtrend.
The entry is on a break below this purple line.
After that, the key is whether price can also break the 1h low and propagate into a 1h downtrend.
15m
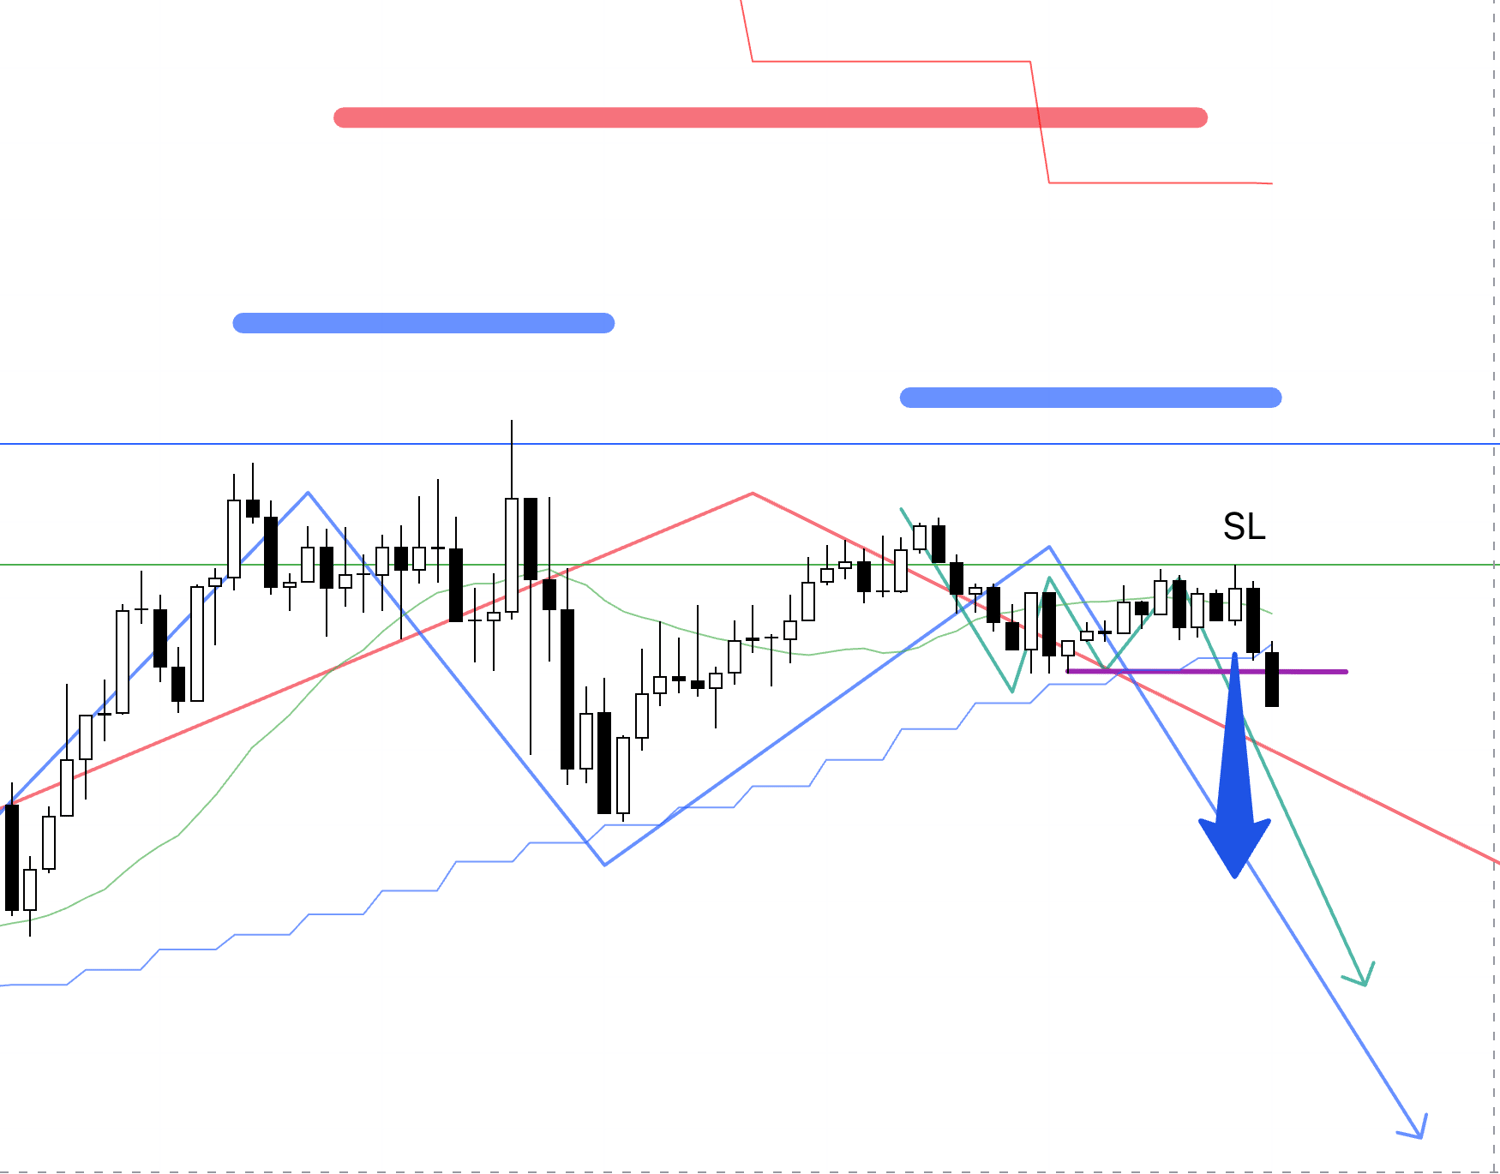
My order has just been triggered, so I plan to hold until the trend breaks on the 15m.
15m
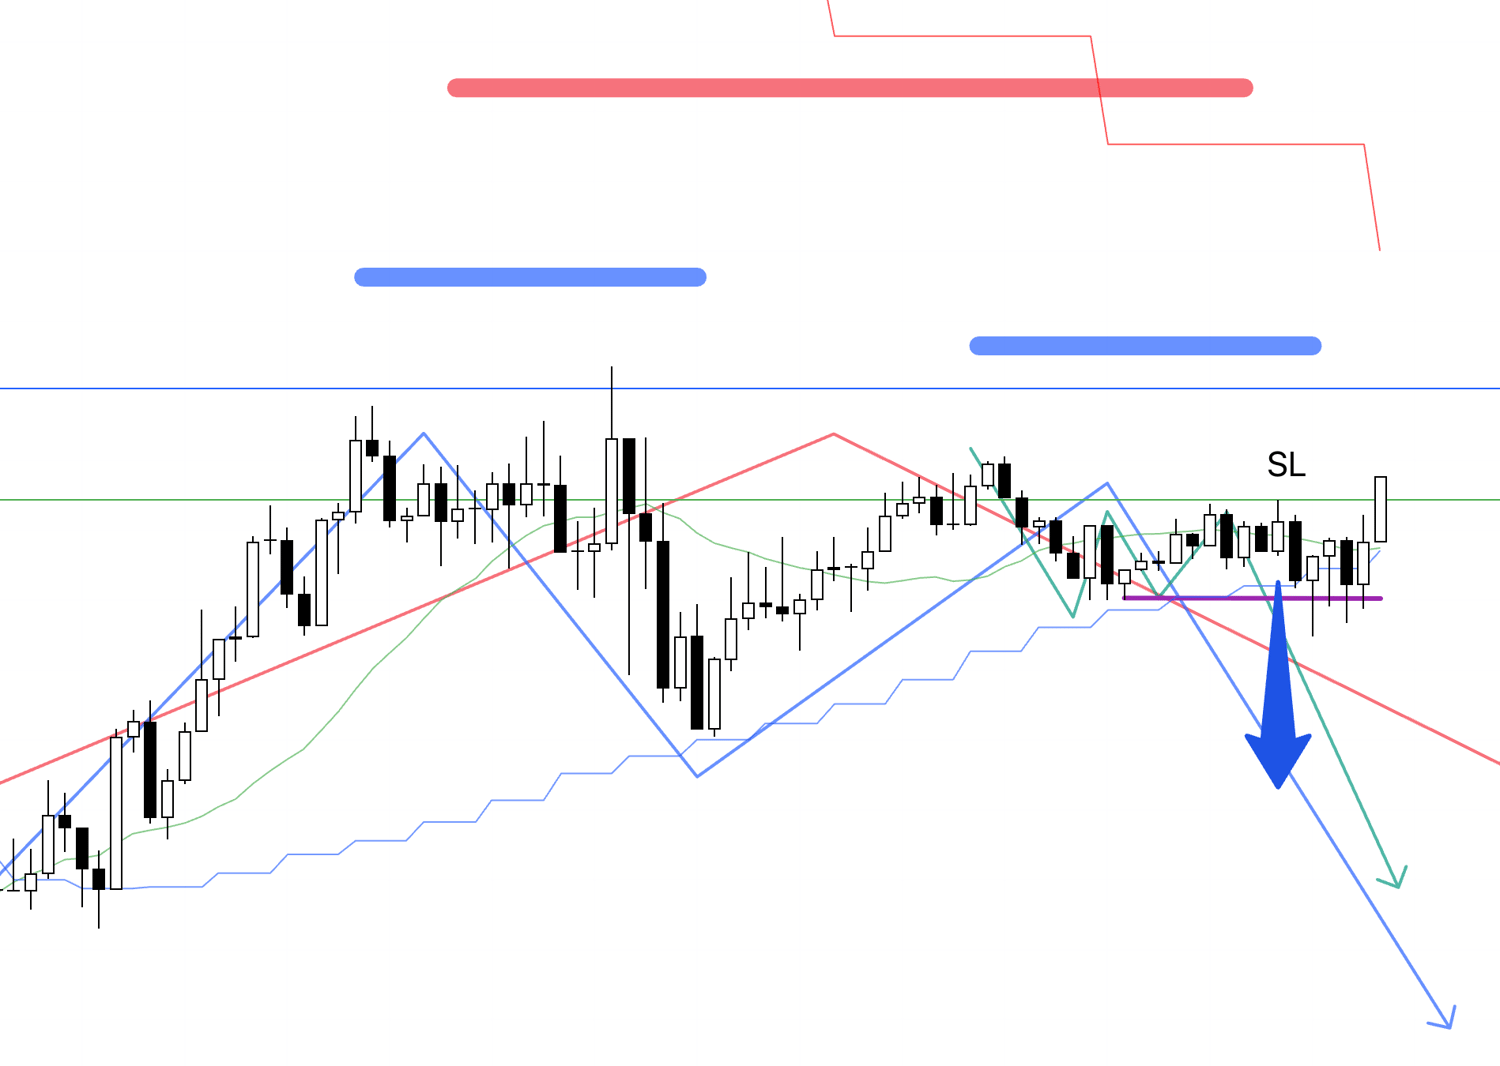
Shortly thereafter, the position hit SL.
〜・〜・〜・〜・〜・〜・〜・〜・〜・〜・〜・〜・〜・〜・
EURUSD
At the same time as USDJPY, an entry opportunity also appeared in EURUSD.
This is likewise the long setup from Sunday’s scenario.
4h
Within a daily higher-low area, the 4h is also attempting to form higher lows.
1h
Similarly on the 1h, this is where it is trying to turn into an uptrend by making higher lows.
This time the 1h breakout point and the 15m breakout point will likely be the same.
15m
On the 15m, a clean double bottom has formed.
The entry is on a break above the high at the purple line.
15m
The entry order has been triggered.
I had set two stop orders, one for USDJPY and one for EURUSD, and EURUSD was triggered first.
I will hold until the trend breaks on the 15m.
The SL is set below the lows that formed the double bottom on the 15m.
I will hold until the trend breaks, but the daily moving average overhead is a capping area, so I plan to take half profits upon reaching that vicinity.
However, I will be going out and may be busy, so I might not be able to capture screenshots along the way.
Afterward, it hit the SL and was stopped out quickly.
I apologize that I do not have a screenshot of the stop-out since I was busy today.
〜・〜・〜・〜・〜・〜・〜・〜・〜・〜・〜・〜・〜・〜・
August 8 (Fri)
USDJPY
Since the 4h has started to make higher lows, I entered on the 15m as a trend-reversal trade.
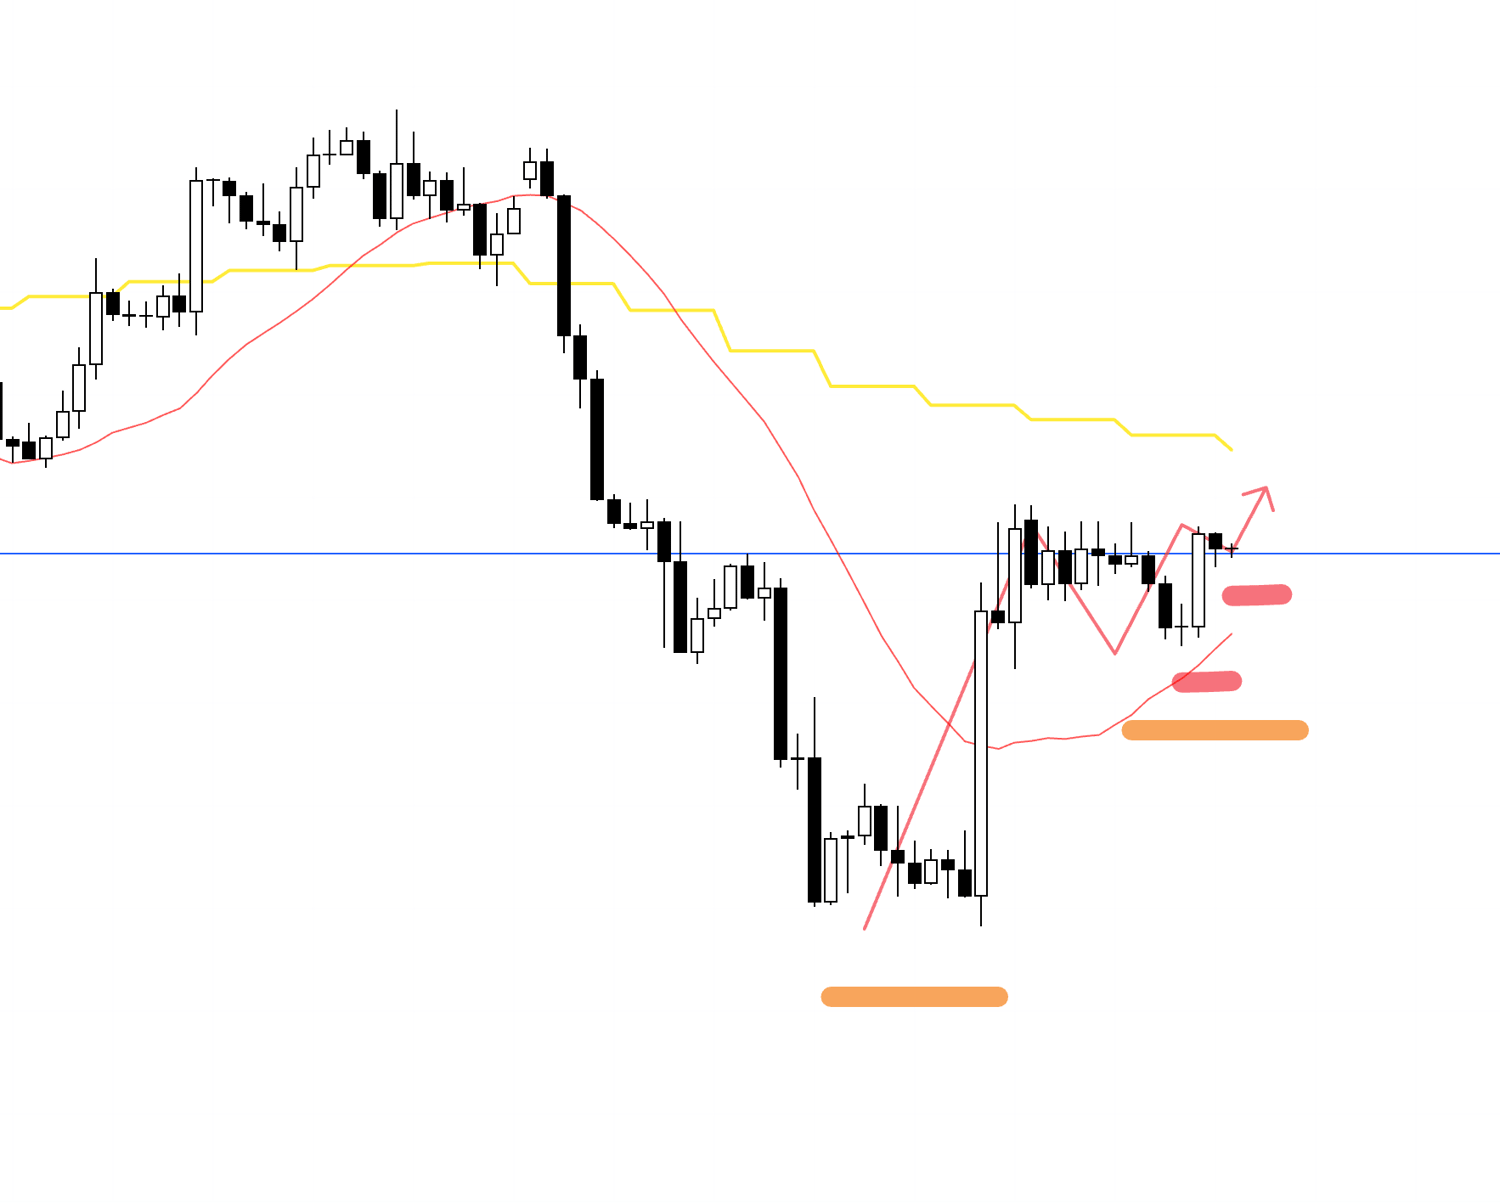
4h
On the 4h, price failed to make new lows and is attempting to form a double bottom on the daily.
At the same time, it broke above the 4h moving average and the slope turned from flat to upward, so this entry is at the first turn to an uptrend.
1h
On the 1h, within the 4h higher-low area, the 1h is also making higher lows and turning into an uptrend.
This is a basic trade I take routinely.
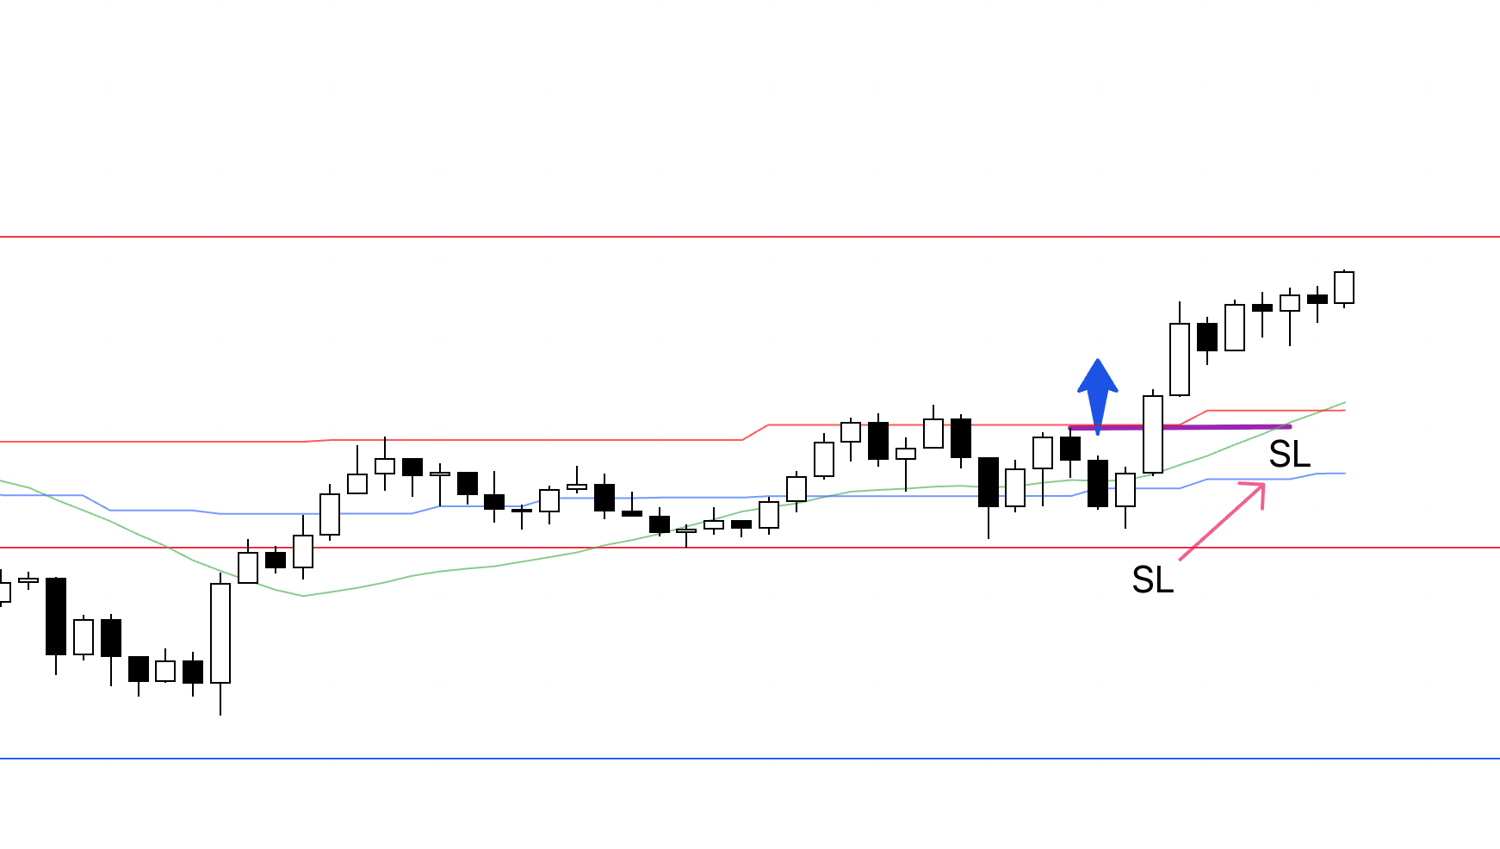
15m
I entered on the 15m, which is an even lower timeframe.
I drew a red line slightly above, which is an area where daily chart selling may appear, and first I want to see whether price can get through it.
Basically, I will hold until the trend breaks on the 15m.
15m
I moved the SL up.
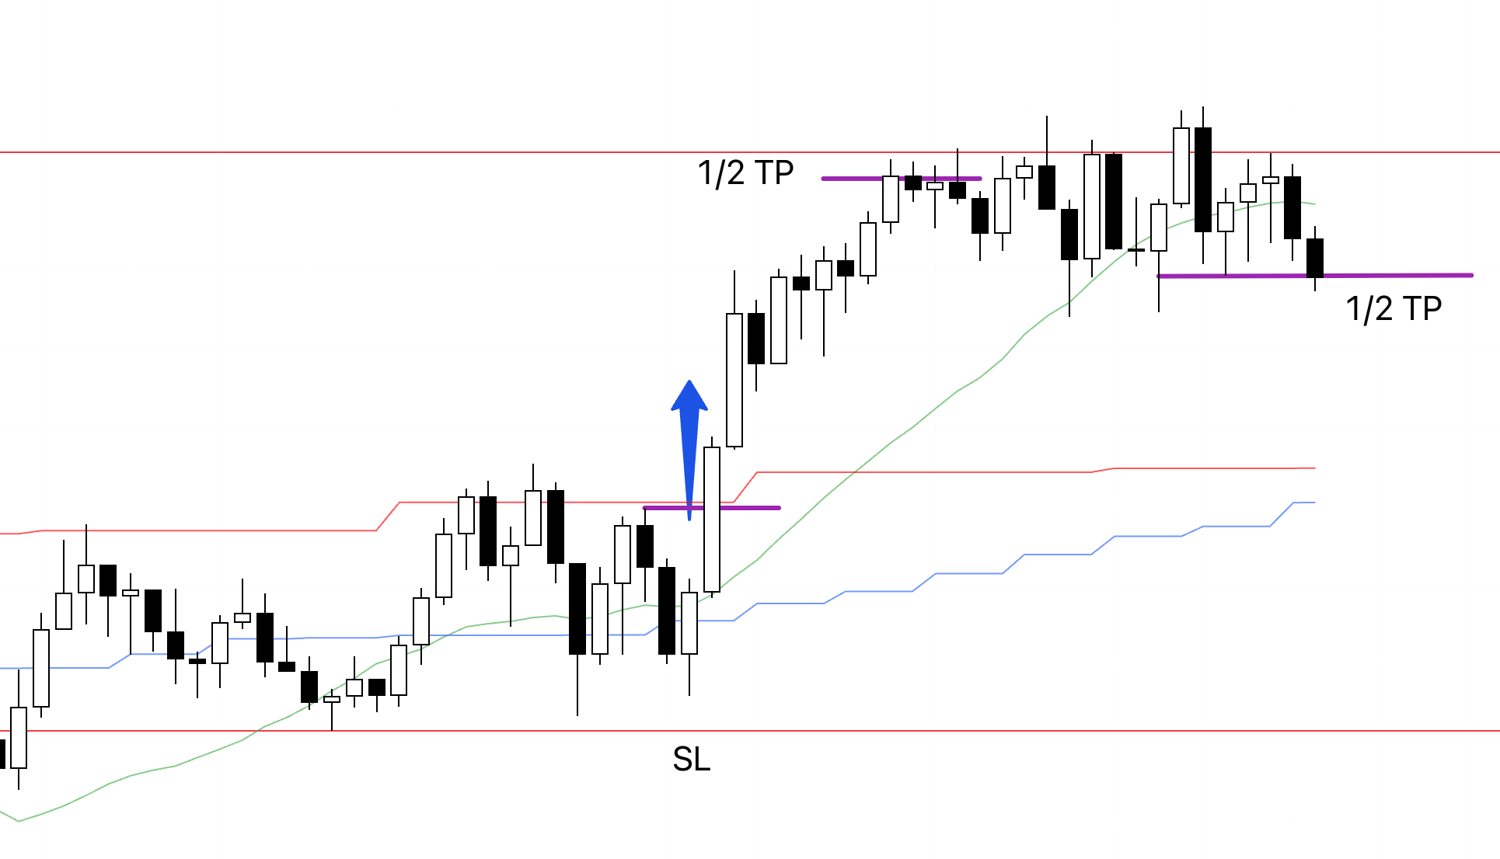
15m
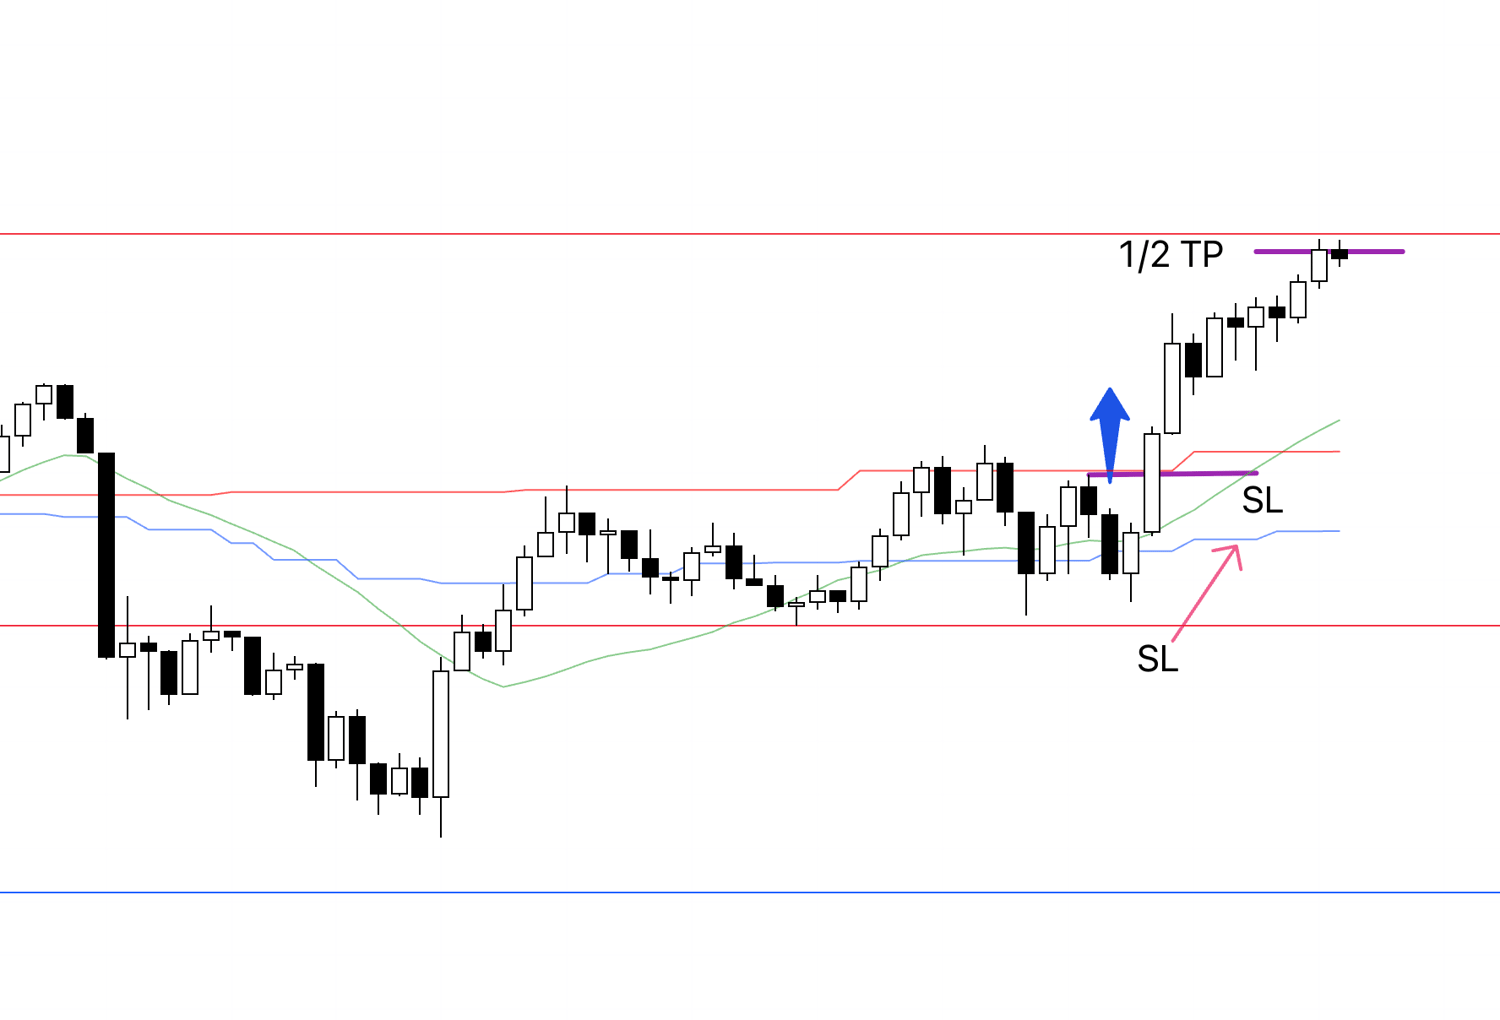
Price reached the red line, so I booked profits on half.
I will hold the remaining position until the trend breaks.
15m
I moved the SL up.
15m
I moved the SL up further.
15m
I nudged the SL up a bit more.
Since it is Friday and I do not carry positions over the weekend, if it is not closed within trading hours I plan to close it manually.
15m
The trailing stop I had been moving up was hit, and I closed the remaining half.
This time, if price had cleared the red line it would have been a point where the move could extend to the daily, so I judged it was well worth taking and traded accordingly.
In the end, price could not get through that red line this time, but because I can identify in advance what risks lie where, I can judge whether a trade is worth taking and keep repeating appropriate actions.
〜・〜・〜・〜・〜・〜・〜・〜・〜・〜・〜・〜・〜・〜・
That concludes the explanation of the trades I actually executed, and from here I will explain the trades I did not take.
Let’s start with USDJPY.
Please see the charts below.
USDJPY 4h

The points I did not take are B and C.
Let’s look at these on the 1h.
1h
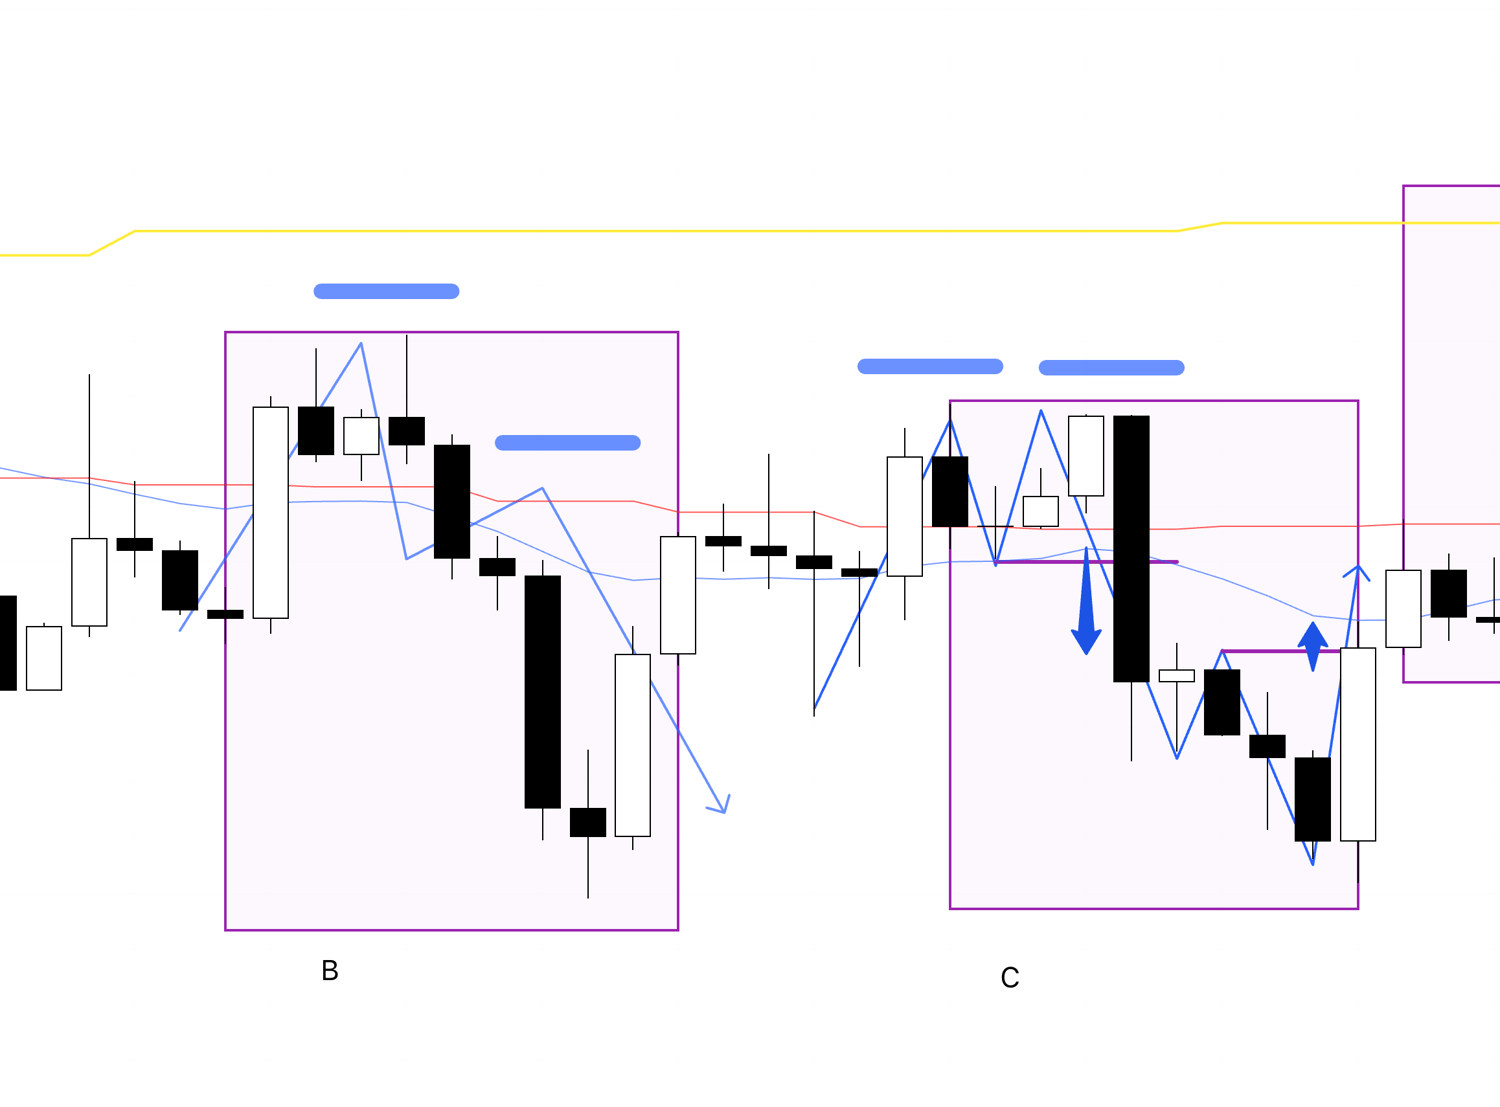
This is the 1h view of points B and C.
I was watching point B, but it did not form a clear lower high on the 1h, so I could not take the trade.
As drawn in blue on the chart, had it formed a lower-high point like that, I might have considered an entry on an even lower timeframe such as the 15m.
At point C, the 1h made a lower high and broke the low, so under normal circumstances I would have liked to trade it, but in Japan that was around 4 a.m., and I do not open new positions at that hour while I am asleep, so I did not trade it.
Had I entered on the 1h at that low break, the exit would have been where the trend broke, so it probably would have ended with a small profit.
Now let’s look at EURUSD as well.
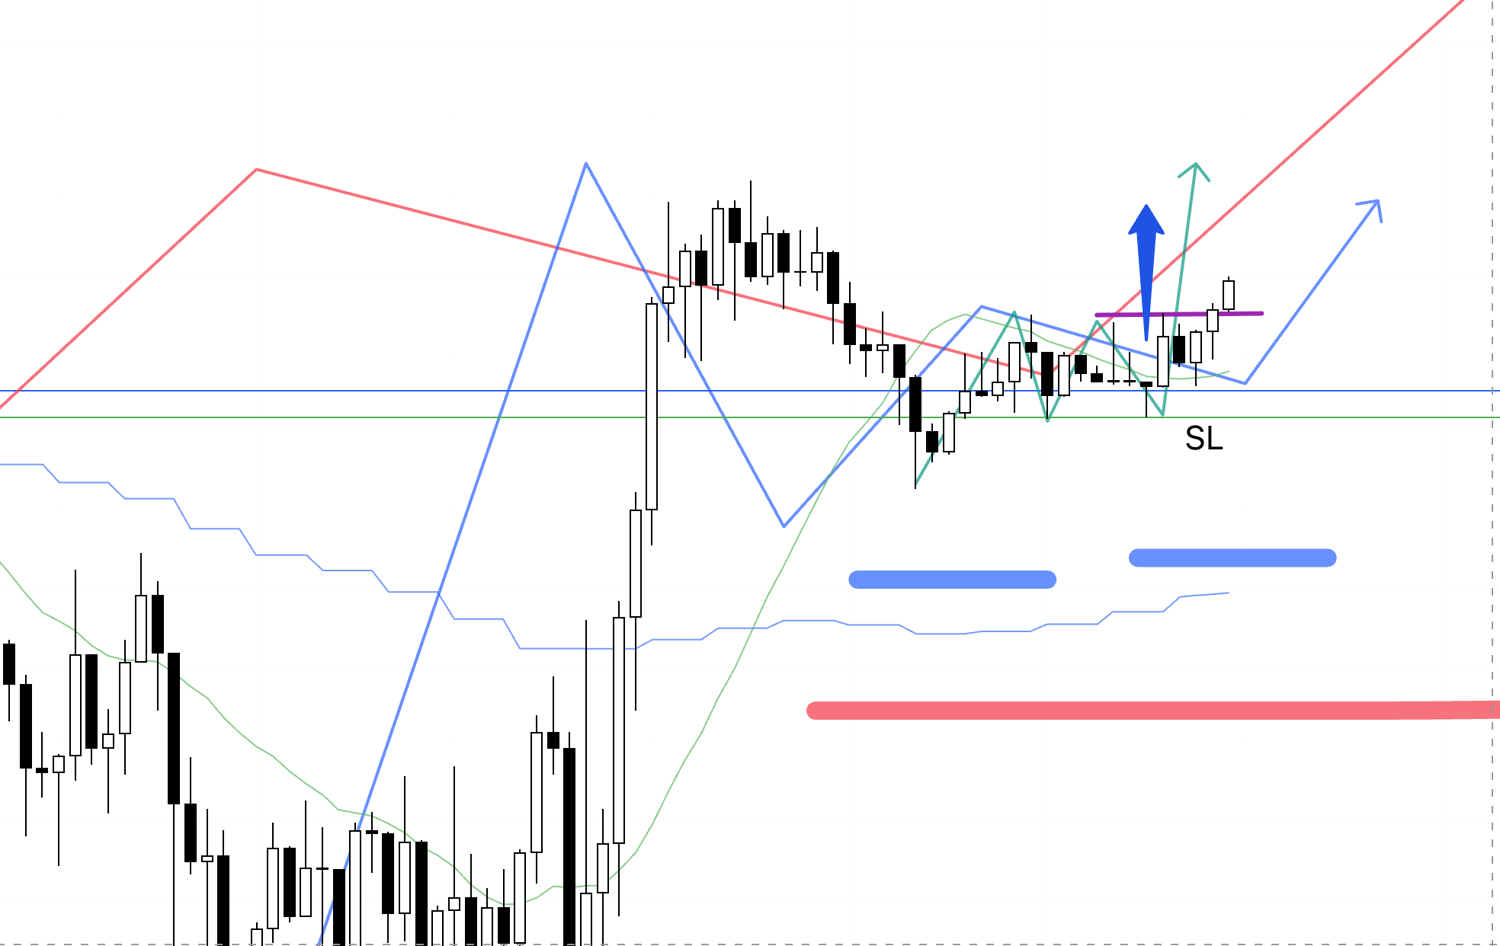
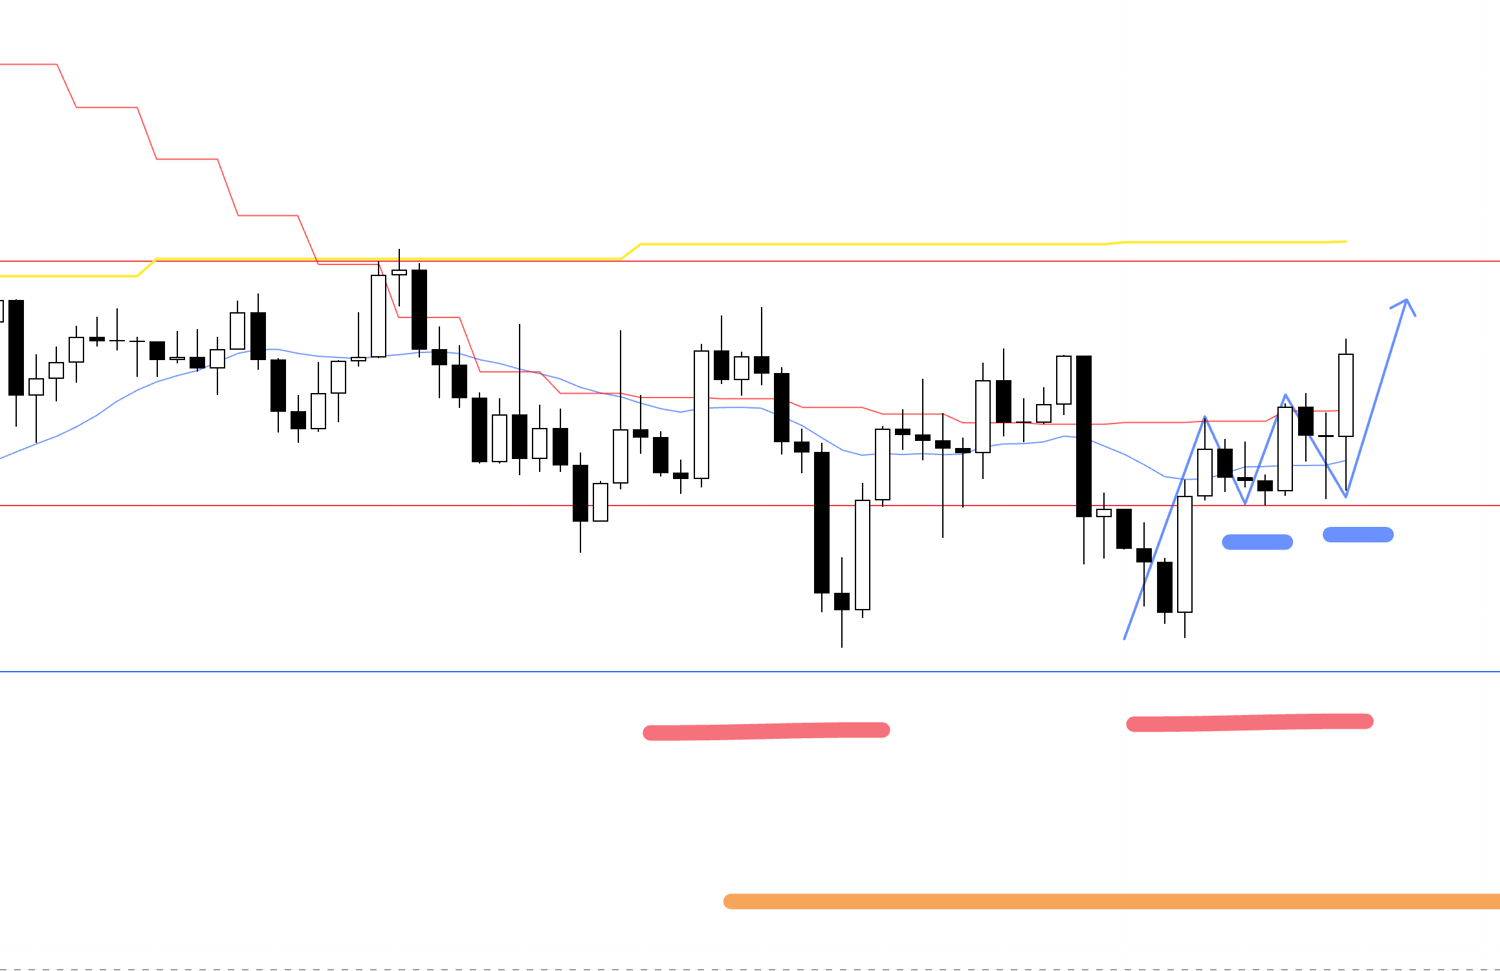
EURUSD 4h

This is the EURUSD 4h chart, and point B appeared a few hours after point A where I was stopped out.
Let’s look at it on the 1h.
1h
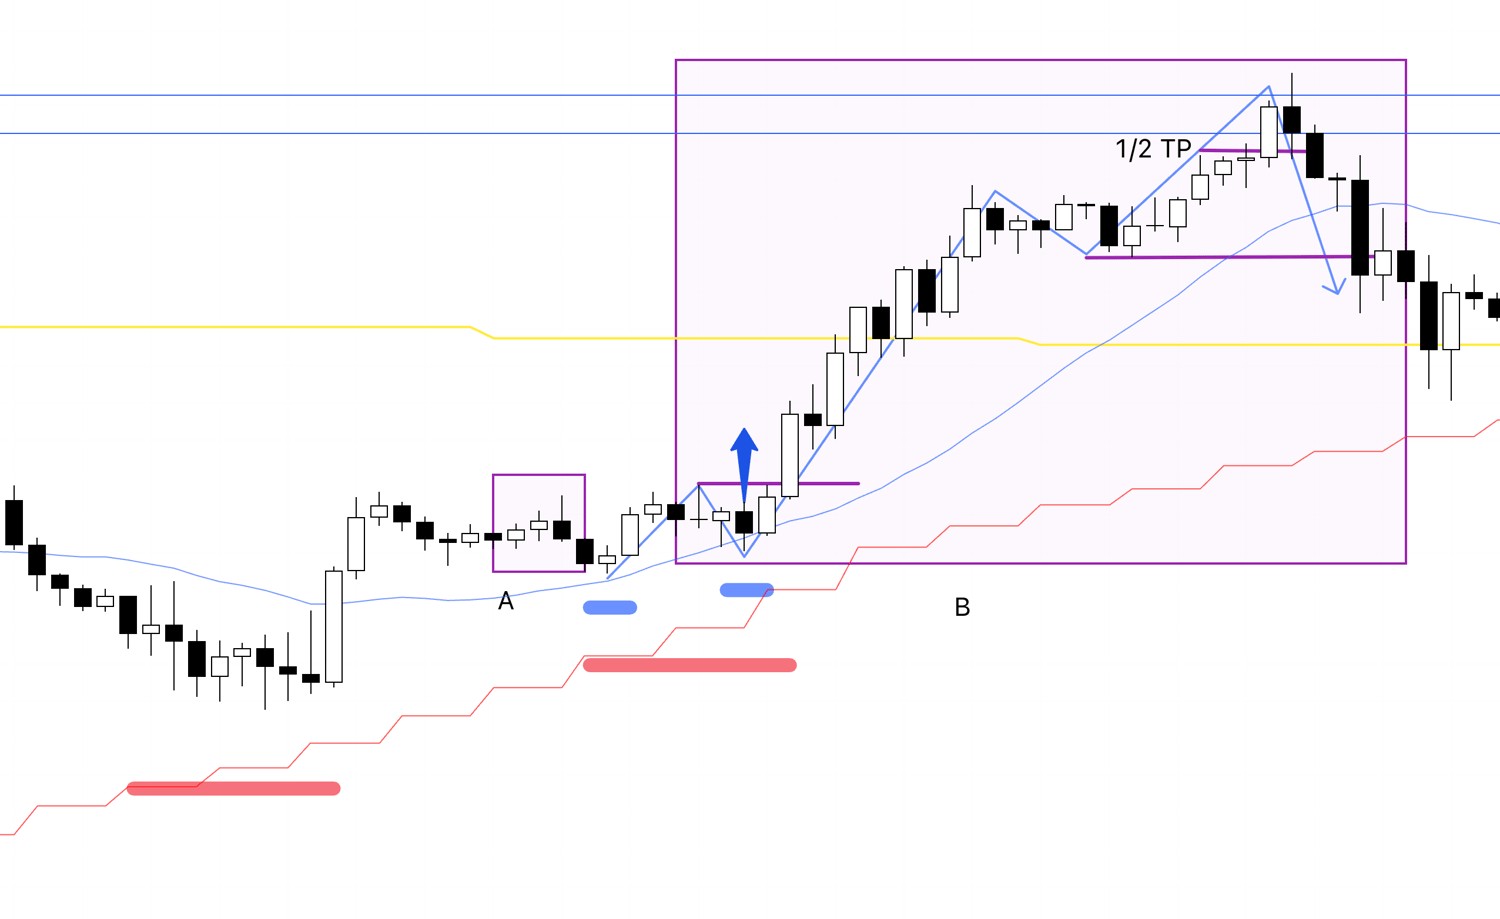
Like point A where I was stopped out, point B is where, within the 4h higher-low area, the 1h makes a higher high and starts to raise the low.
I was watching it right up to the moment, but I was about to board a flight and could not trade it.
If I had traded on the 1h, it would have been my usual trade: enter on the breakout of that high and exit where the trend breaks.
I have drawn two blue lines above, and since those were levels that had been respected previously and I had them marked in advance, I might have taken half profits at those lines.
Of course, since I did not actually take the trade I can say anything after the fact, but if I had traded the 1h, that is likely how the trade would have gone.
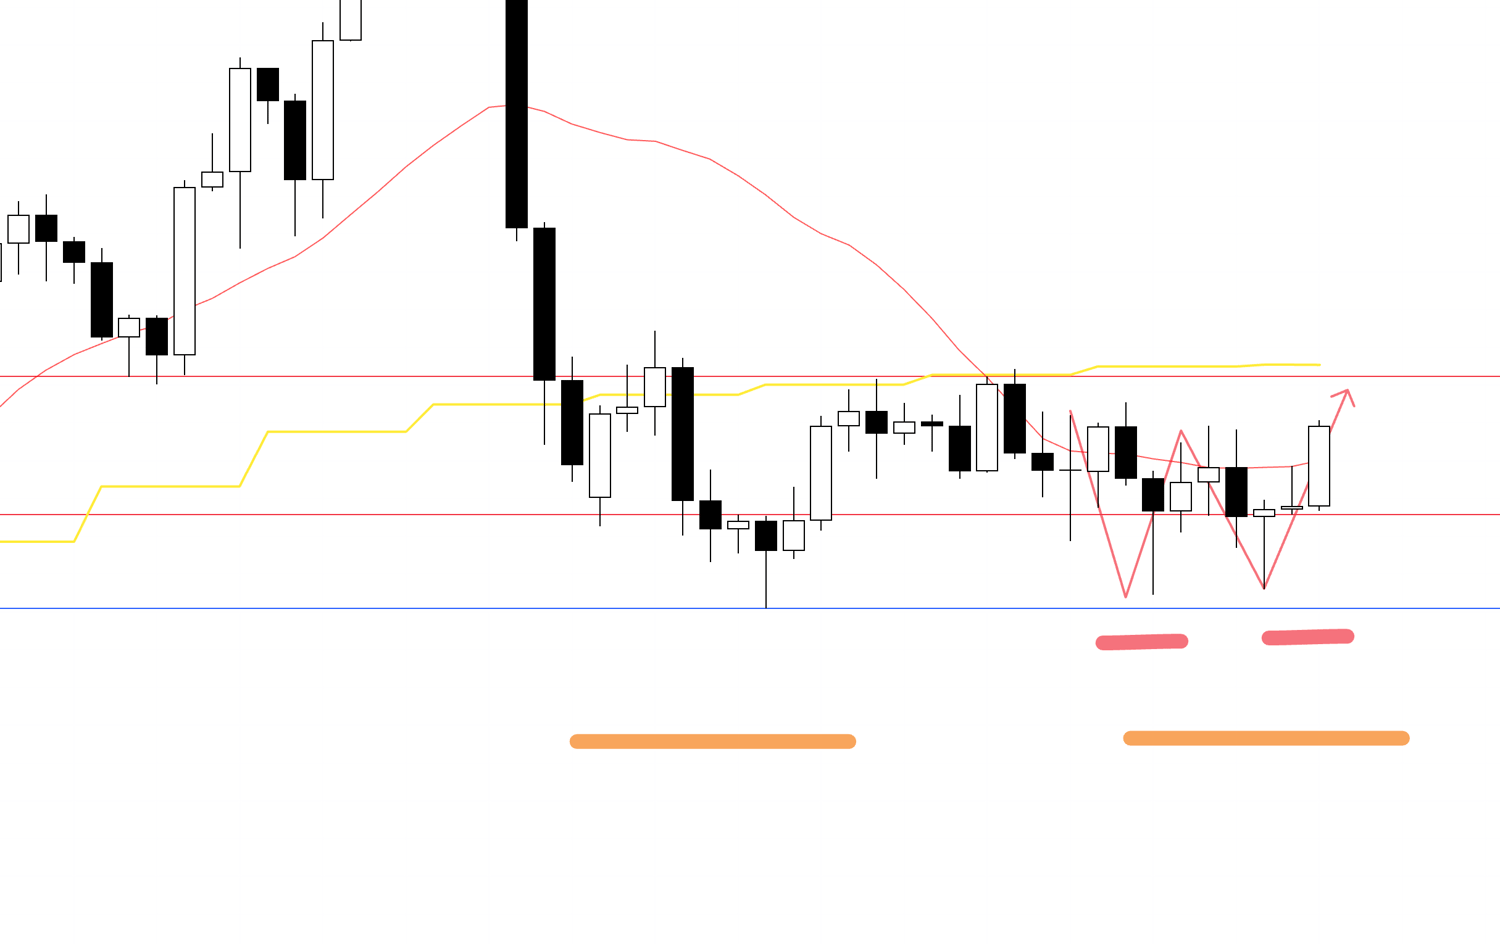
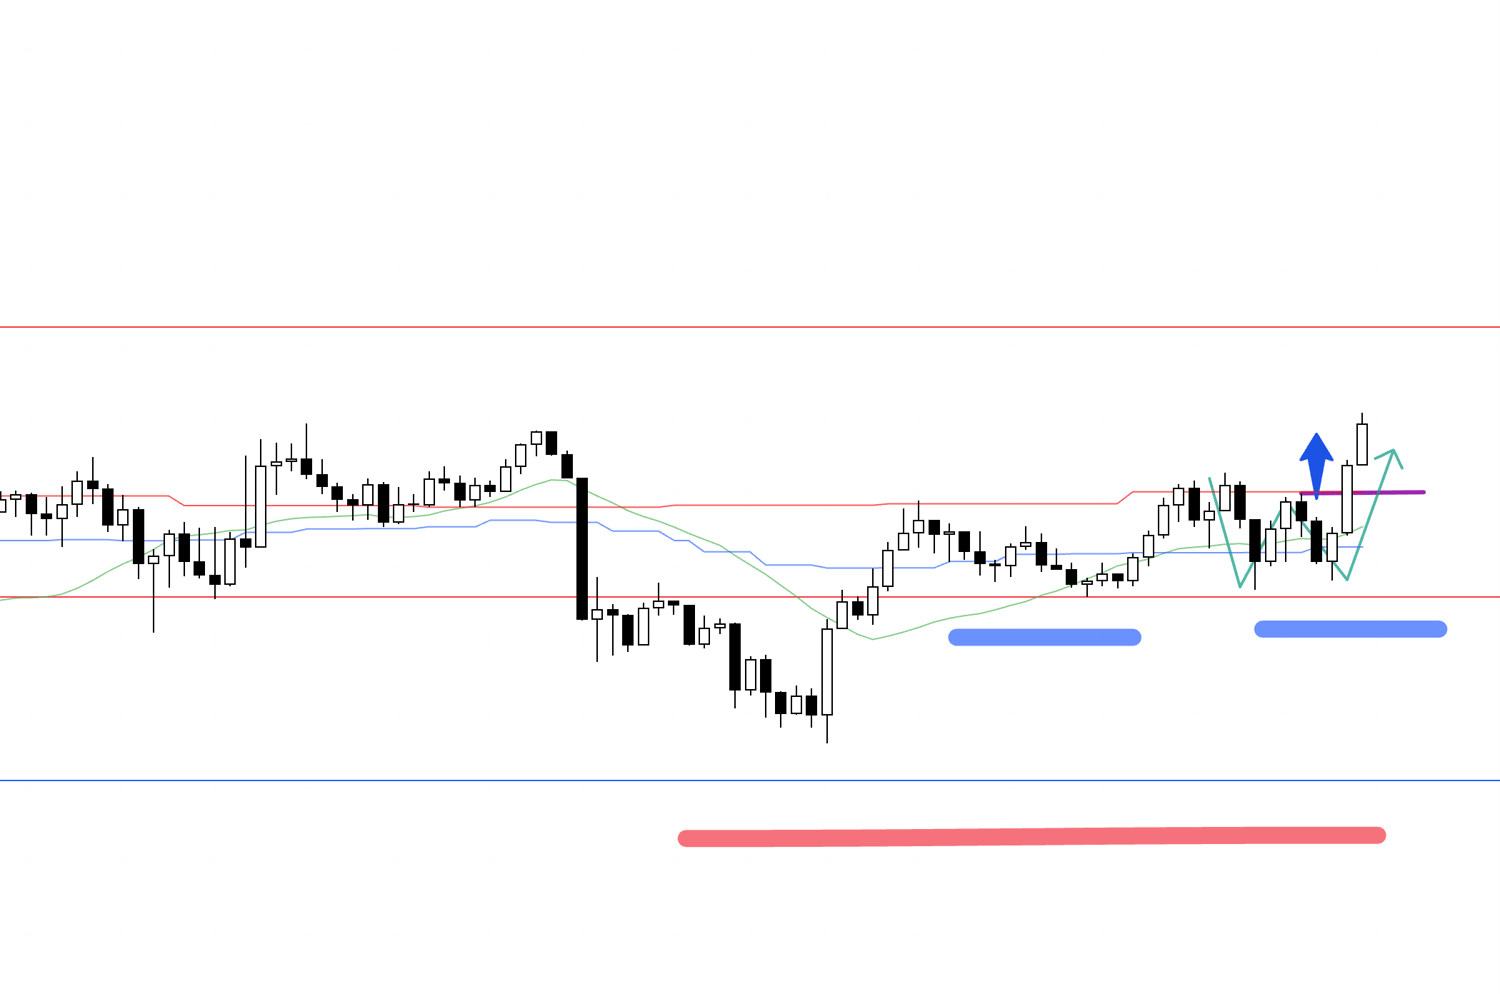
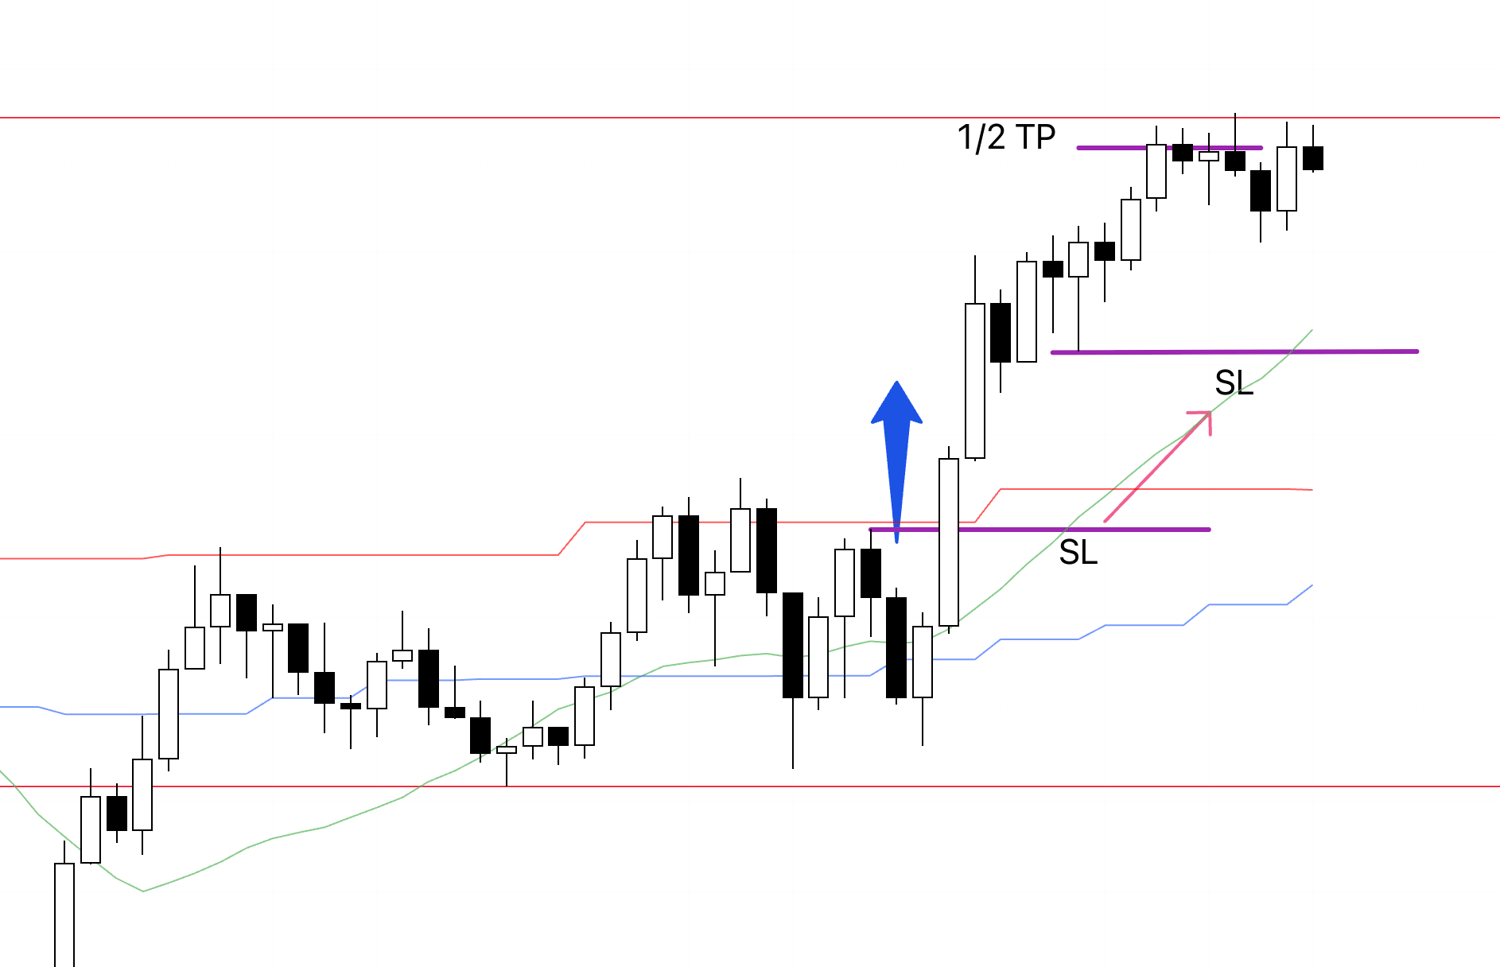
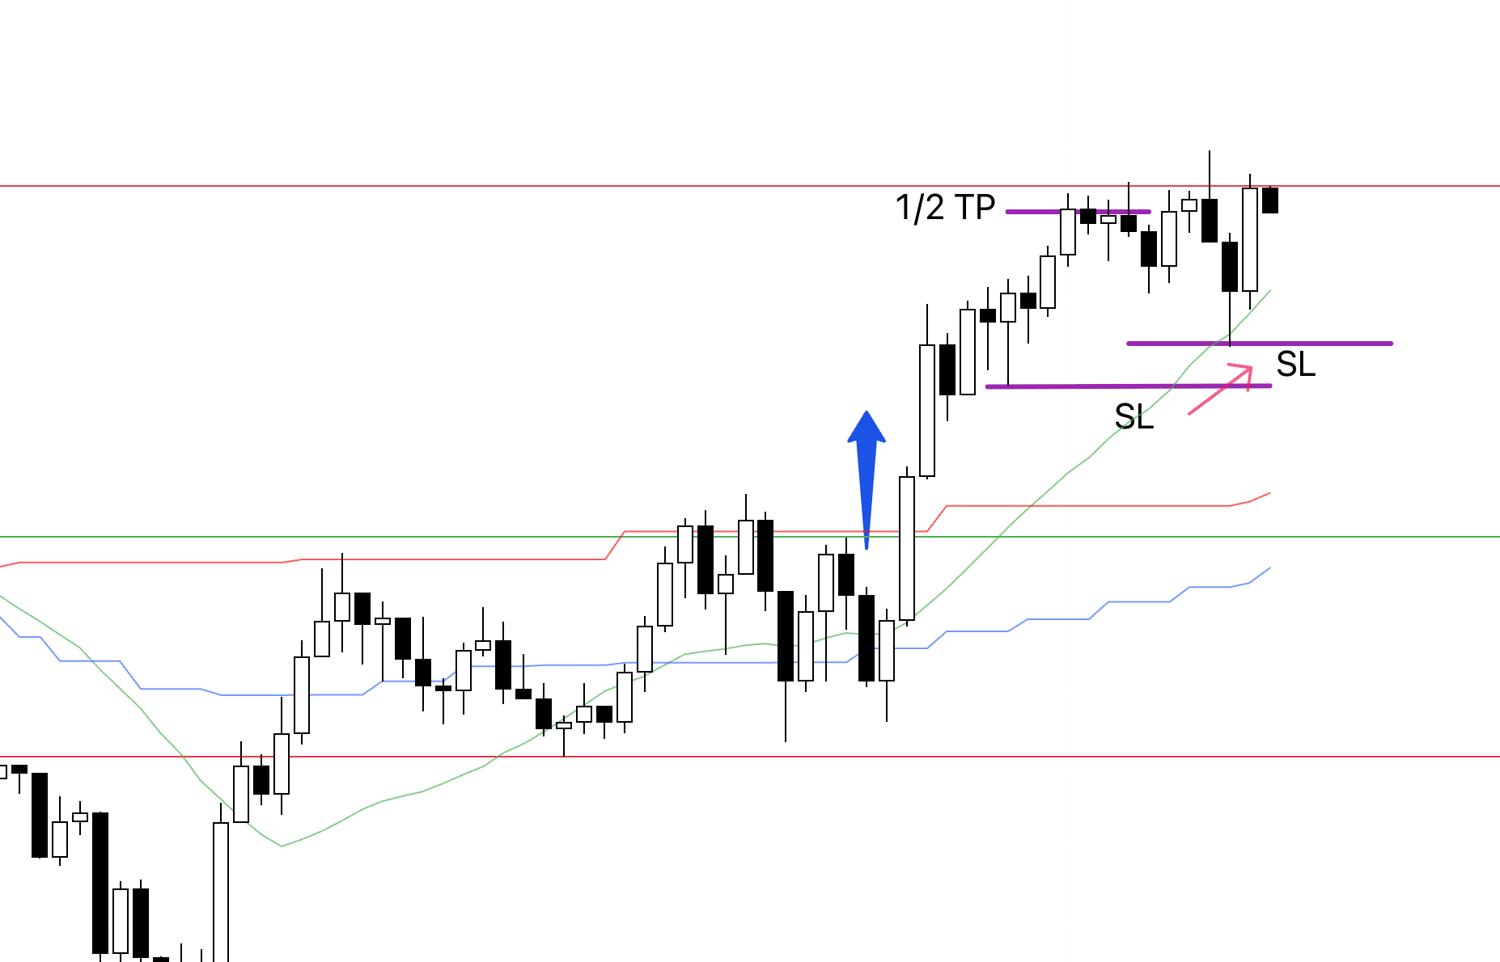
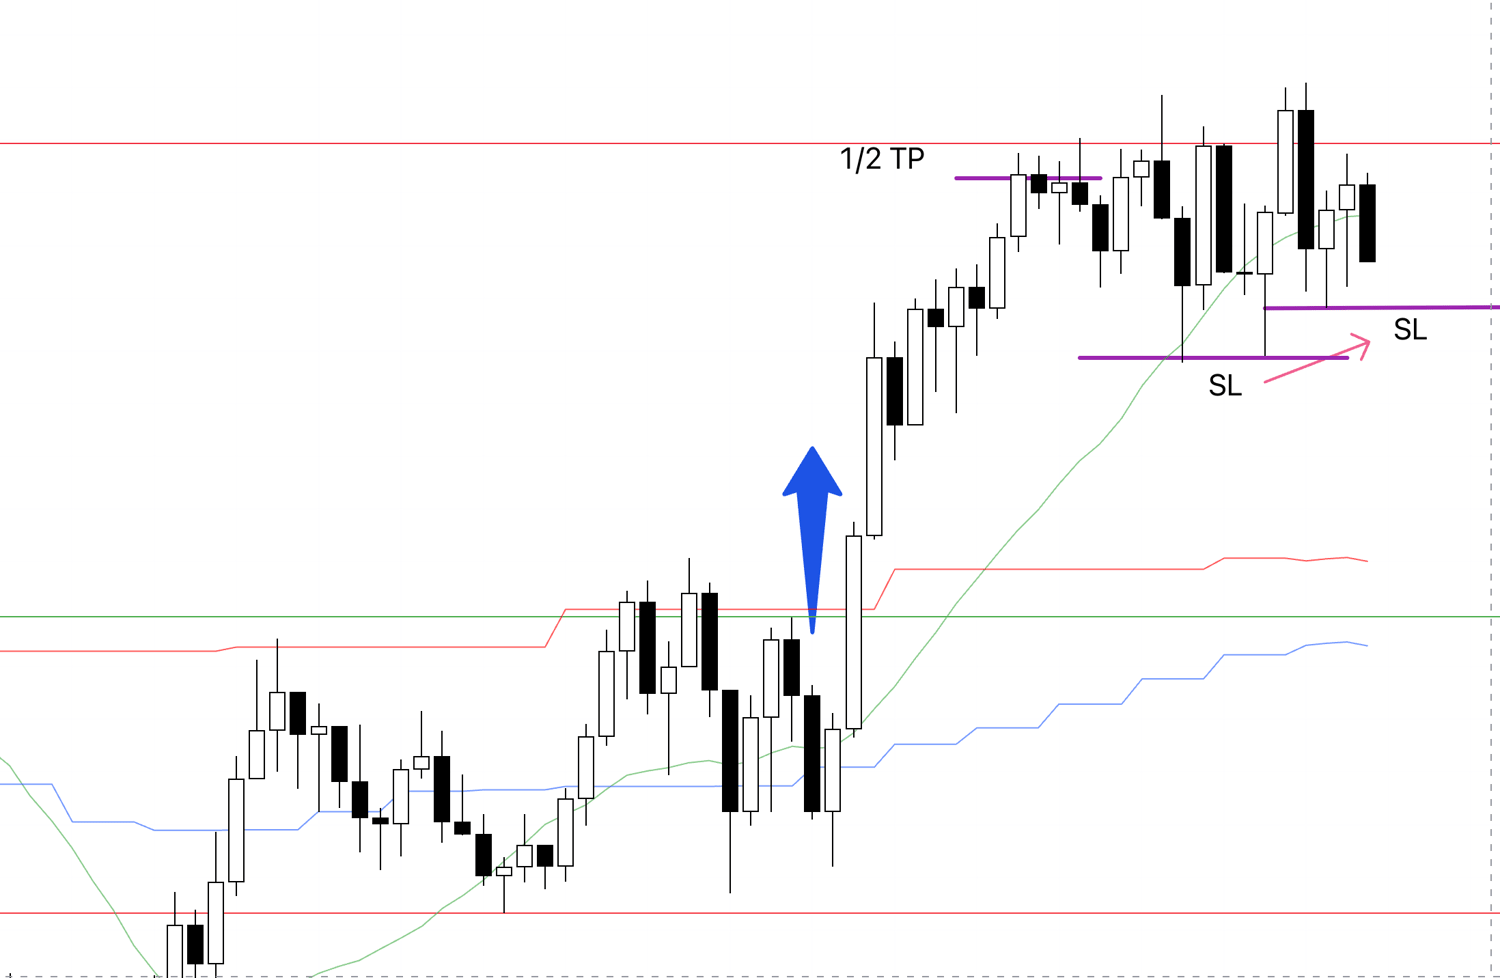
In reality, I was planning to enter here on the 15m.
15m
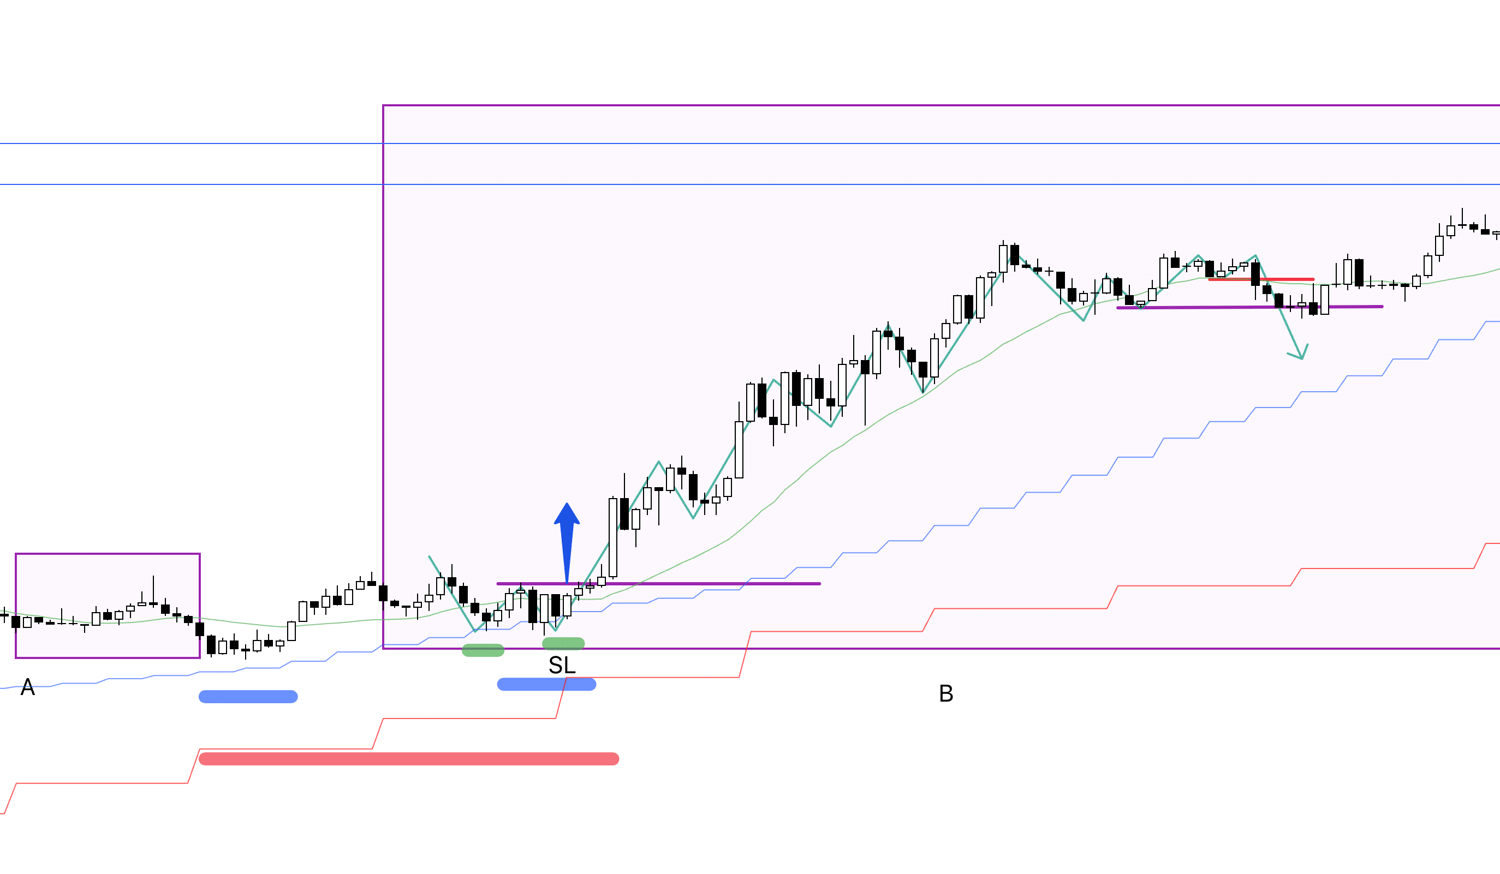
On the 15m, I would have entered on the purple breakout, then raised a trailing stop, and likely exited either on a break below the red line or on a break below the purple line.
〜・〜・〜・〜・〜・〜・〜・〜・〜・〜・〜・〜・〜・〜・
That is all.
In the end, I was busy with personal matters this week and could not trade in a relaxed manner.
I will be a bit busy until next week as well, so I do not know how much I will be able to trade, but I will strive to keep the explanations careful, and I appreciate your understanding.
As with my week, it often happens in trading that you get stopped out right after entry and then fail to catch the move that really runs.
We cannot know in advance which trade will be profitable, so those are outcomes judged in hindsight, and all we can do is keep executing consistent trades based on the information available at the time.
We must avoid overreacting to a single short-term result and constantly ask whether we executed the trade we should have taken.
Continuing to execute that process carefully is a skill in itself, so I will keep at it each day without neglect and continue honing it.
This "Weekly Trade Report" was slated to become paid content starting this month, but due to its popularity I will keep it free for a while longer.
In this report, published every Saturday, I summarize my real-time thought process during the trades I actually took that week, including entry, stop-loss, and take-profit decisions.
This "Weekly Trade Report" is planned to become paid content in the future, so please take this opportunity to experience my real-time thinking.
Note that this content is provided solely for educational purposes and is not an instruction for you to buy or sell, nor does it guarantee future profits.
You are solely responsible for any trades you make, so take the time to build and test your strategy and trade at your own risk.
I hope my consistent trading serves as a reference for your own consistent trading.