


Hello.
I will set up my trade scenarios for the upcoming week.
This "Trade Scenario" blog is posted "every" Sunday.
And every Saturday, I post a "Weekly Trade Report" on how I thought and traded during that week.
By reading it together with the Trade Scenario blog, I believe you can reference a consistent process at a practical level, showing how to think in advance, what to wait for, and how to execute.
For my strategy, please see the blogs on Dow Theory and Multi-Time Frame Analysis.
A scenario is not a prediction.
It is not a prediction, but my personal plan of "if this happens, then I will do this".
I do not predict the market, and this is not that kind of thing, so please understand this in advance.
And this is not intended to give you trading instructions or provide signals.
It does not guarantee future profits, and it is provided for educational purposes, using the consistent process I execute as a subject.
I cannot take responsibility for any outcome of the trades you make, so please trade at your own risk.
Now, let's look at USDJPY.
〜・〜・〜・〜・〜・〜・〜・〜・〜・〜・〜・〜・〜・〜・
USDJPY
Daily Chart
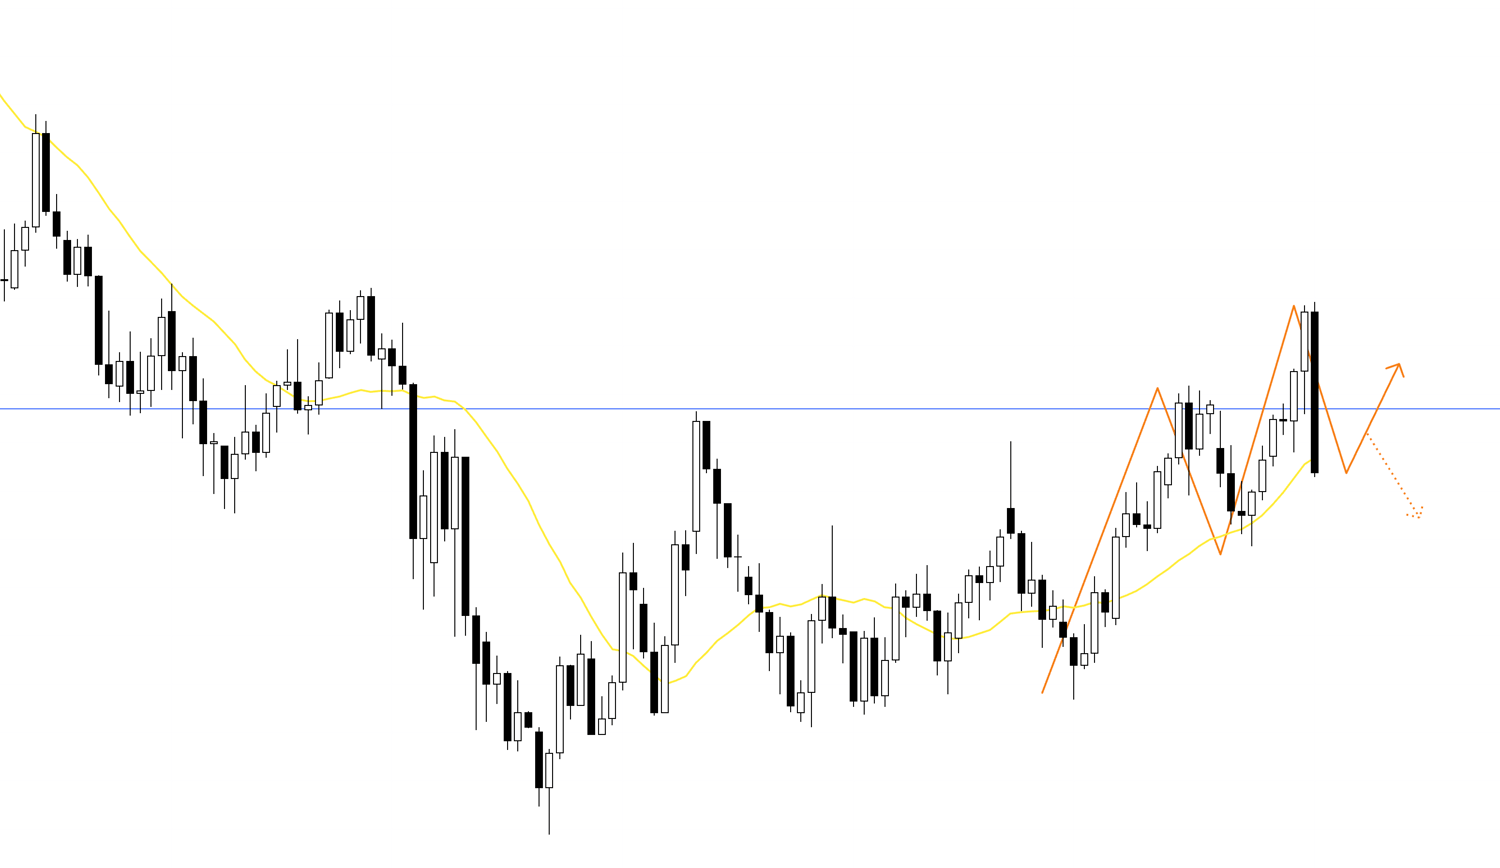
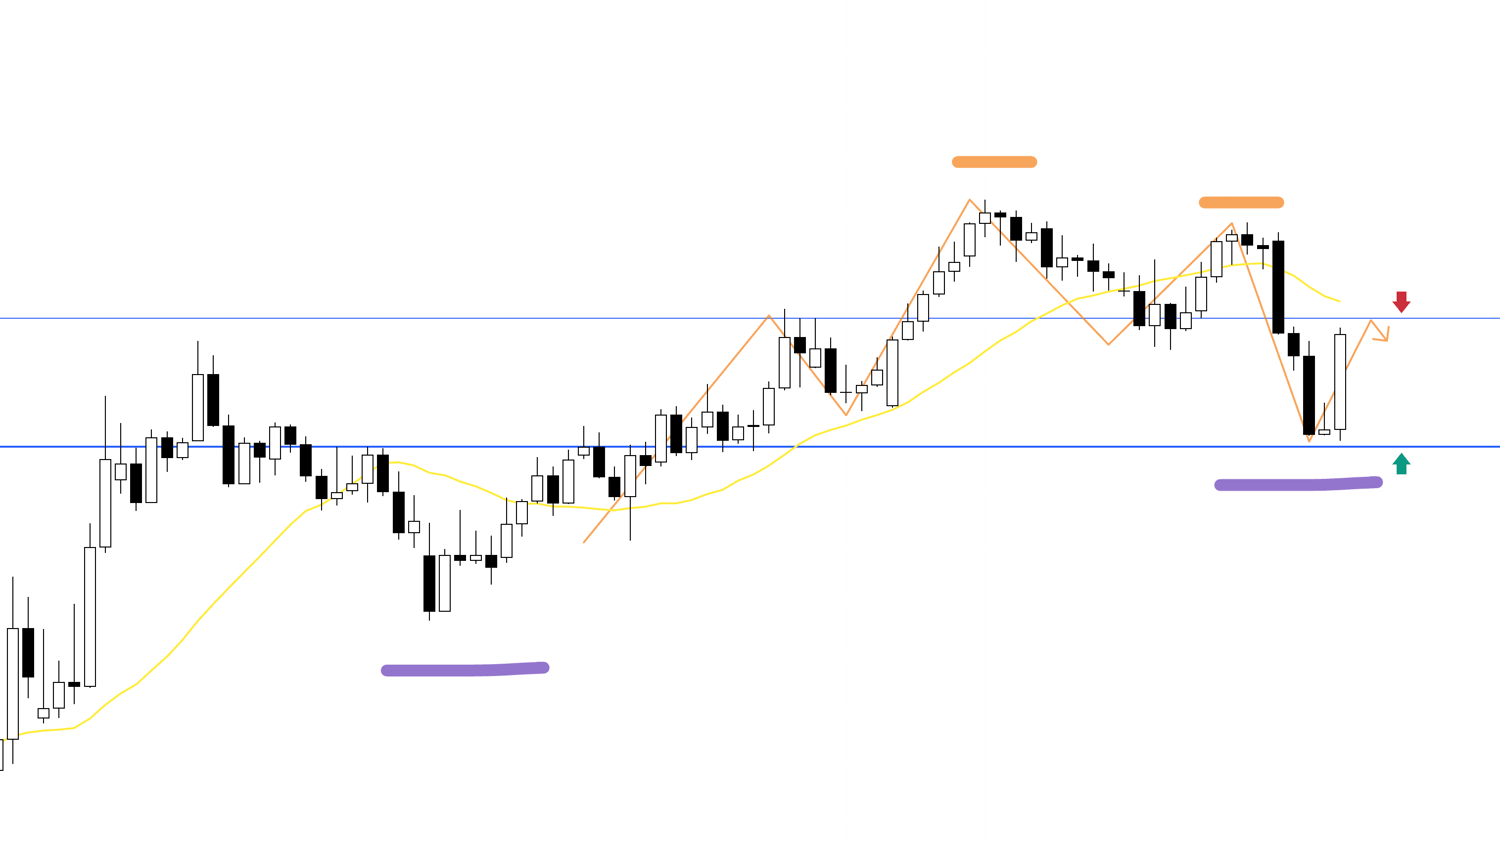
On the daily chart, the price was finally able to break above this blue line, which was a weekly pullback sell point that had been holding the price down for a long time, but due to events like the employment report, it has fallen back below the blue line again.
However, by making a higher high and a higher low, the uptrend is continuing, and since it has not yet broken the low, this is a situation where a pullback buy on the daily chart could be considered.
On the other hand, if we see this as a failure to break through the blue line, a scenario where it forms a new lower high and reverses into a downtrend can also be considered.
These are not predictions, but preparations to trade at the most advantageous point, no matter which way it develops.
I don't care whether it goes up or down, nor am I making a prediction.
This is scenario building to plan in advance under what conditions an edge will be created to buy, and under what conditions an edge will be created to sell.
With that in mind, let's look at the 4h chart.
4h
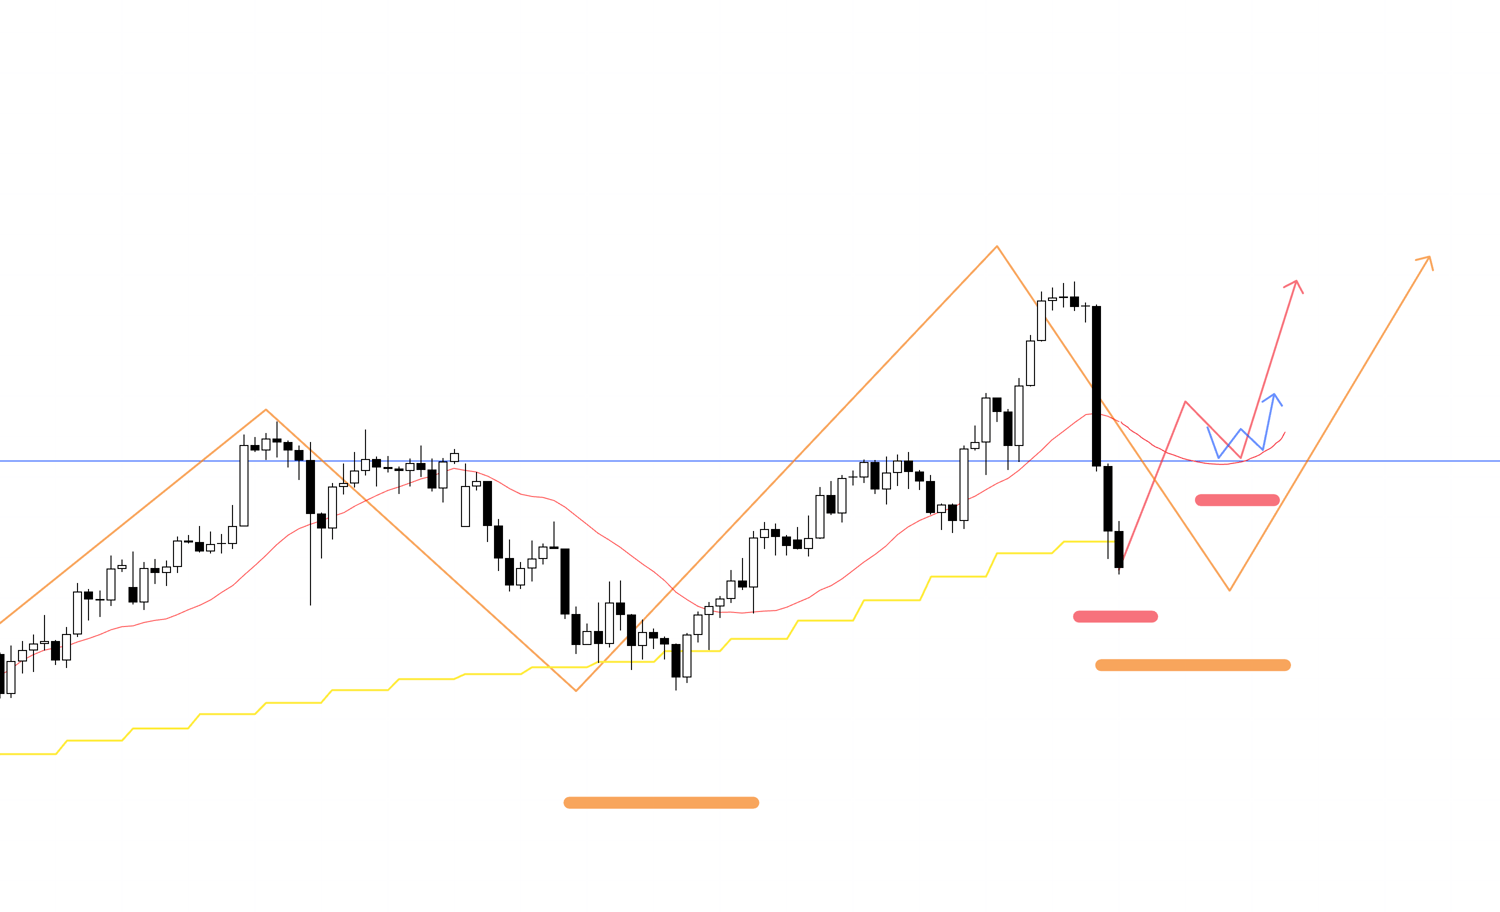
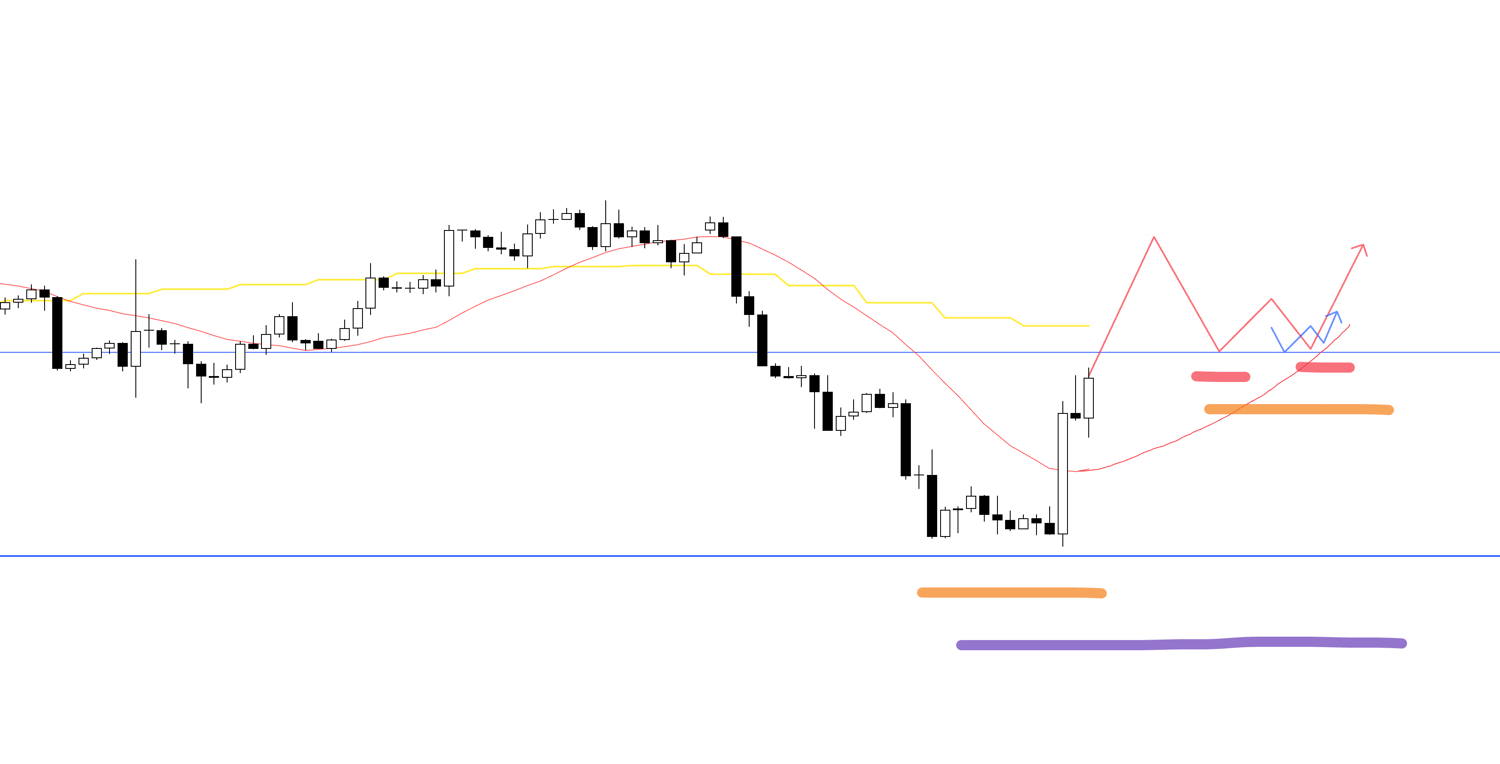
If I were to buy, it would be like this: as a pullback buy on the daily chart, the price would re-establish a higher low point on the 4h chart as well, and within that, if it makes a higher high and higher low on the 1h, for example, I would consider an entry.
At this time, I will see if it is firmly supported by something like this blue line, and whether the moving averages have also been crossed once and are now providing support from below.
On this 4h chart, what is drawn in orange is the movement on the daily chart, red is the 4h movement, and blue is the 1h movement.
4h
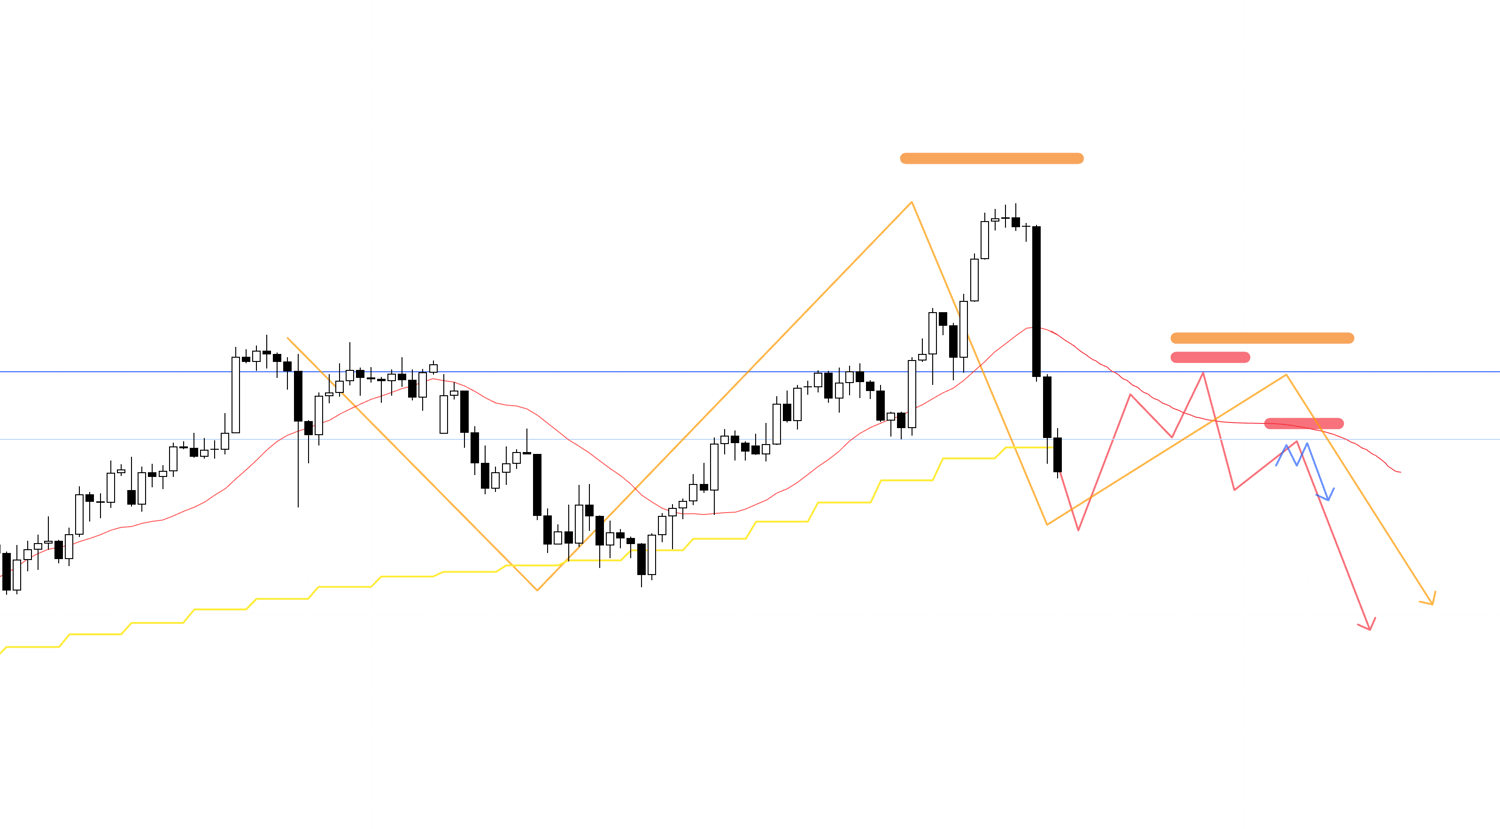
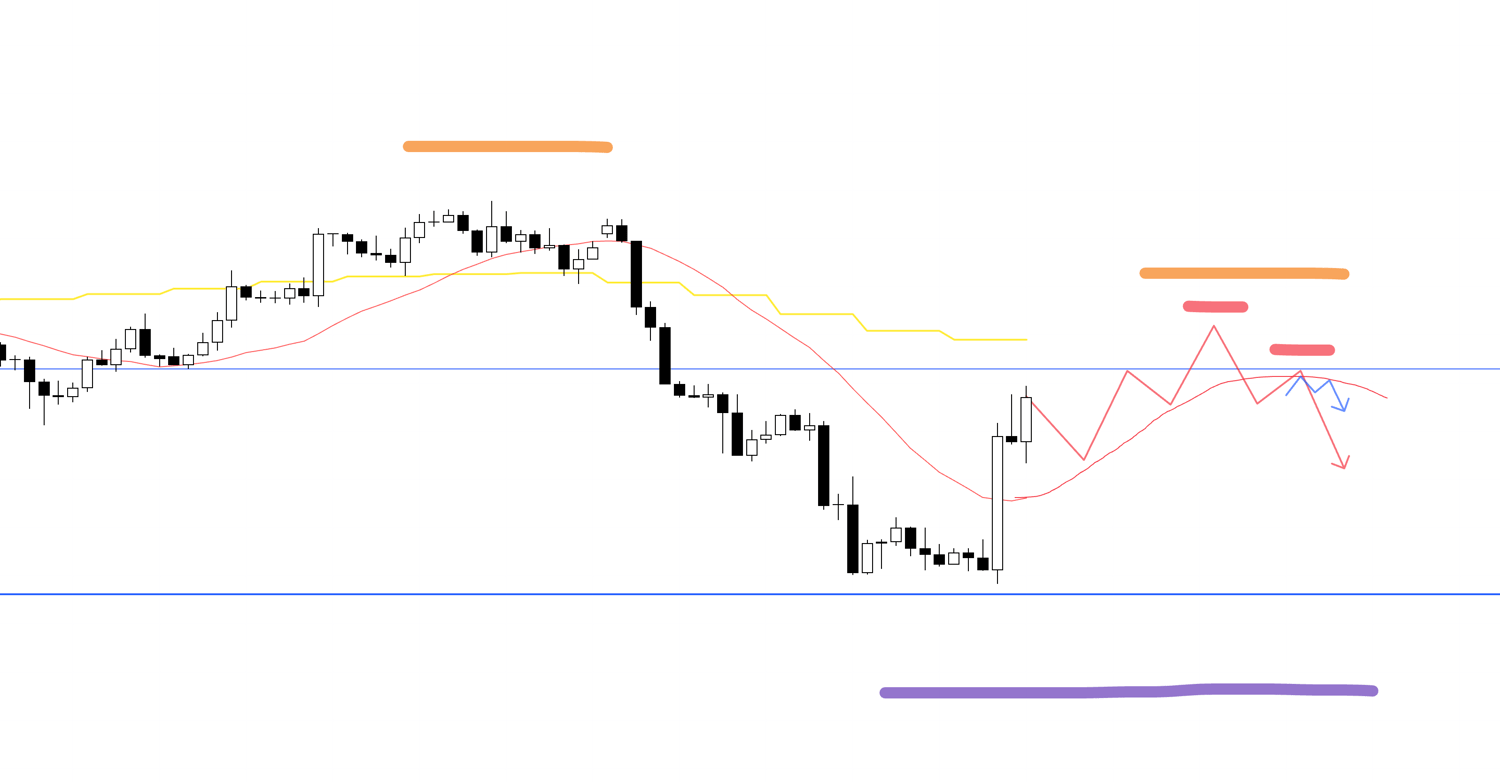
If I were to sell, it's currently at a pullback buy point on the daily chart, so it's difficult to sell immediately. Therefore, after it forms something like a daily lower high point, and within a 4h lower high point, if the lower timeframes show a reversal to a downtrend, I would consider an entry.
4h
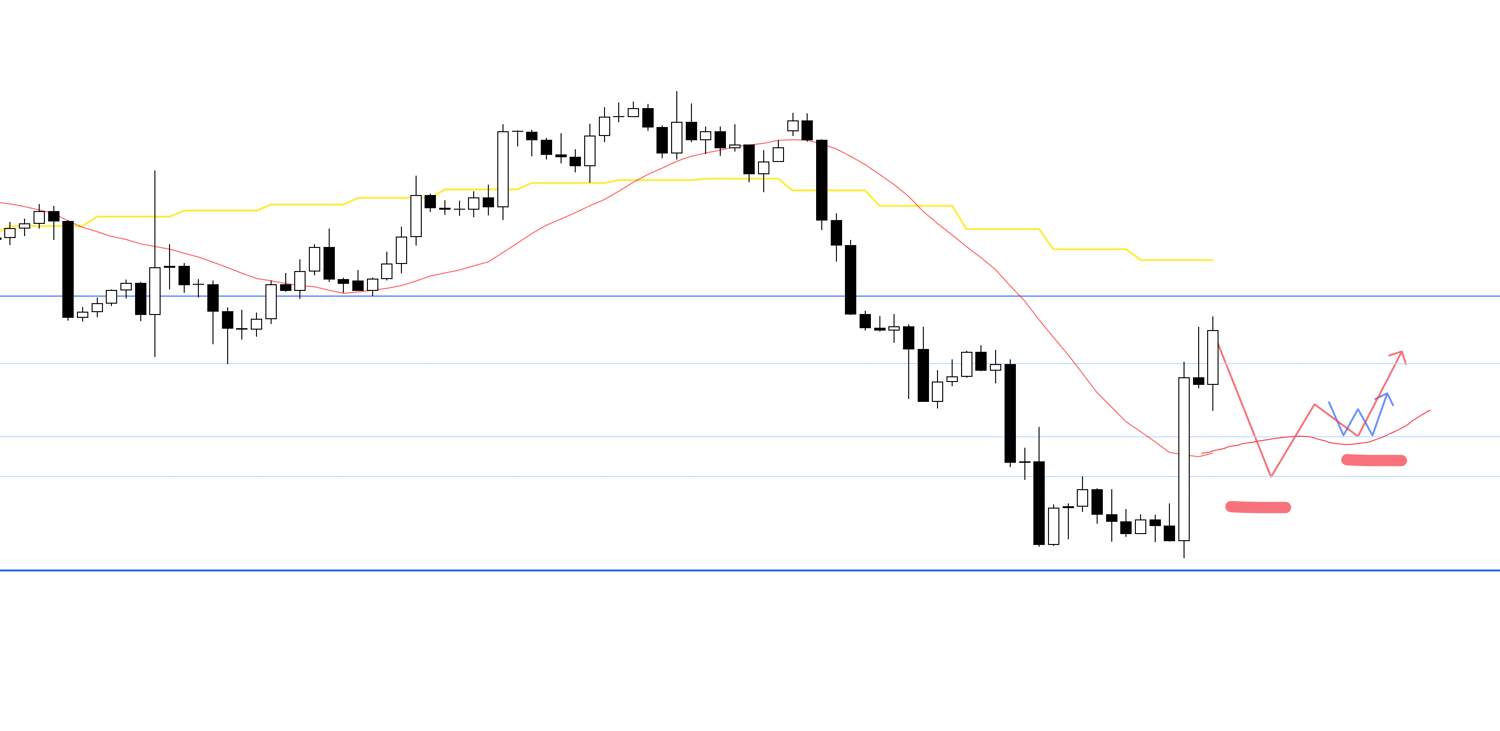
It's possible for the daily chart to create a lower high point like this, and I don't know how it will actually develop, but I want to update my scenario while watching the chart's movement and determine a point to sell.
If it just falls from here without forming a pullback, I probably will not trade.
〜・〜・〜・〜・〜・〜・〜・〜・〜・〜・〜・〜・〜・〜・
EURUSD
Now, let's look at EURUSD next.
Daily Chart
This is the daily chart, and currently, it has broken its previous uptrend and reversed into a downtrend, like this.
However, on the weekly chart, which is an even higher timeframe, it is still a pullback in an uptrend, and it was thought that buying pressure would increase at this blue line.
(On this daily chart, what is drawn in purple is the movement on the weekly chart, and what is drawn in orange is the movement on the daily chart.)
The price did indeed reverse near this blue line, and it is now in a situation caught between both buyers and sellers: will it make a higher low as a weekly pullback buy, or will it continue the downtrend as a daily pullback sell and test the lower blue line again.
Now, with that in mind, let's look at the 4h chart.
4h
A point that becomes easier to buy is once it breaks above this upper line and the daily moving average, then forms a higher low point on the daily chart again, and within that, a point where it makes a higher low on the 4h chart.
In this case, within the weekly pullback buy, the daily chart would be making the initial move of reversing back into an uptrend from a higher low, making it a point where the buying advantage becomes very high.
4h
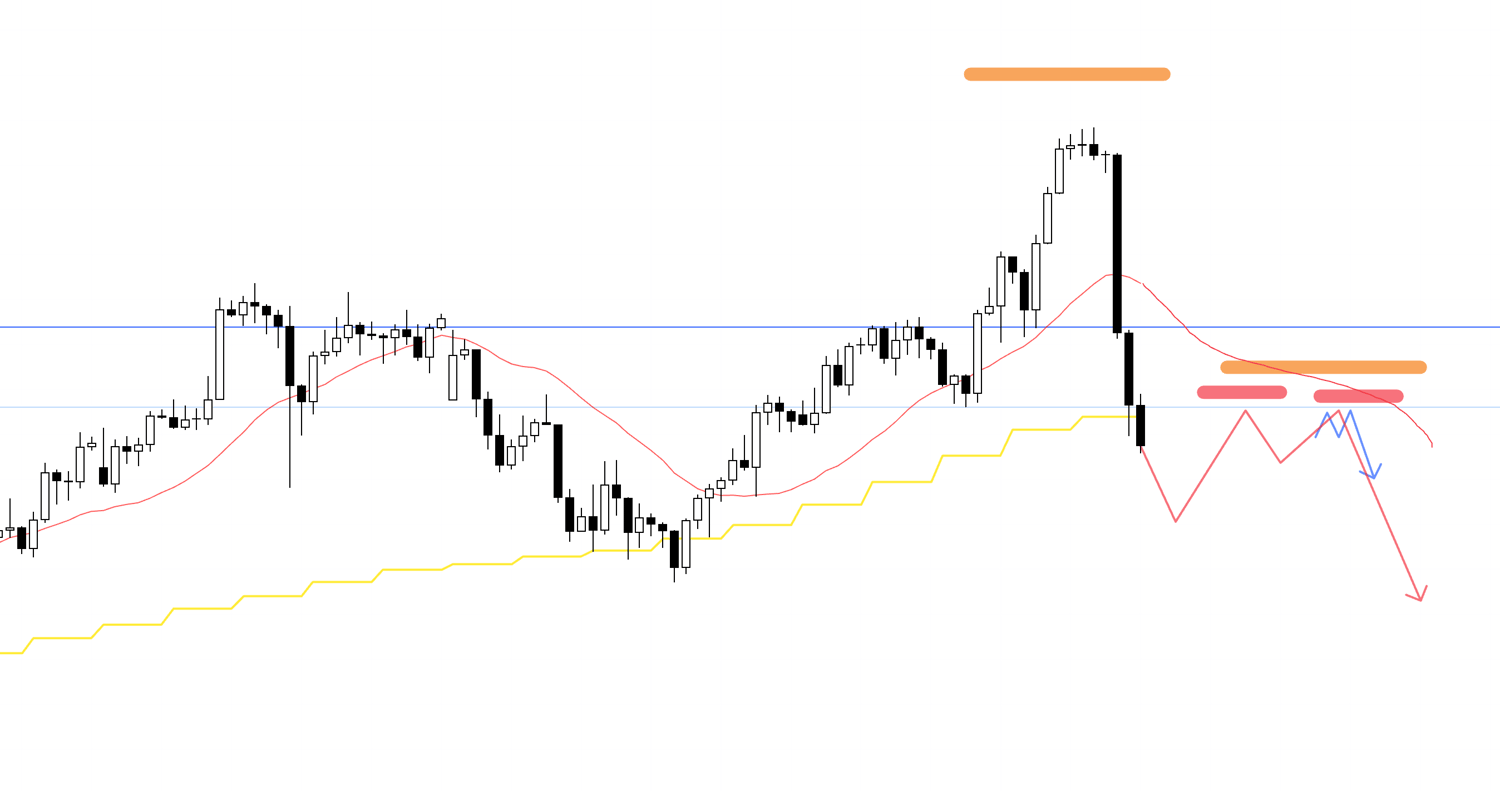
When considering a sell, the moving average on the 4h chart is currently providing support from below, so I cannot sell immediately.
On the 4h chart, the recent rise has broken the downtrend, putting it in a state where "I want to buy if it gets cheaper," and it is a high-risk situation where orders from the daily pullback sellers and the 4h buyers are conflicting.
In this case, at the point where the 4h uptrend ends and reverses into a downtrend, if it forms a lower high point, for example, by being held down by a line like this upper blue one, and also held down by the 4h moving average, I would consider an entry at a point where a lower timeframe makes a lower low and lower high.
This would be a high-edge selling point as the 4h chart would align with the direction of the daily pullback sell.
4h
On the 4h chart, the downtrend has been broken and it is in a state of "I want to buy if it gets cheaper," so if it were to newly create a higher low point like this, I could consider buying. However, as we've been seeing, there are several lines where sells are likely to come in as a daily pullback sell, so the key will be whether a point appears where I can enter with a favorable risk/reward ratio.
After considering those risks, if the conditions are met, I will consider a buy entry.
〜・〜・〜・〜・〜・〜・〜・〜・〜・〜・〜・〜・〜・〜・
That is all.
These are the scenarios at the current moment, and I plan to update or build scenarios each time while watching how the price actually moves once the week begins.
Both USDJPY and EURUSD are currently in a "difficult" phase to trade, but the important thing is "not to create" the "difficulty". To do that, one must firmly grasp what risks are hidden where in advance, and decide "under what conditions I will act".
If you do that, it's not a matter of whether it's difficult, but only the perspective of "does it meet the conditions, or not?" remains.
I often say, "There is no such thing as a difficult market," which, in other words, is about how much ambiguity you can eliminate beforehand.
That said, situations where judgment is difficult do indeed exist.
In that case as well, the problem is solved if you have a rule that says, "If I'm hesitant to judge, I don't act".
It becomes "difficult" because you rack your brain asking, "How can I make a trade?".
If you have to struggle, don't do it.
Only trade where it's simple.
By deciding this, you can avoid unnecessary losses, and taking losses only at pre-decided points functions as a cost, which leads to trading without hesitation or regret.
I hope this has been of some reference.
This is just my personal trade plan, so if you are someone whose trading method is not yet established, I think you can use it as a reference for building your own strategy. But if you already have your own solid trading style, please do not be swayed by my trade plan and stick thoroughly to your own rules.
Thank you for reading to the end.