

I will review the key points of my trades, focusing on the trades I made this week.
I will be posting this "Weekly Trade Report" every Saturday.
If you read it as a set with the "Trade Scenario" that I post every Sunday, I believe you can use it as a reference for how I think in advance and how I actually trade based on the scenario.
This "Weekly Trade Report" was scheduled to become paid content starting in August, but due to its popularity, we will be extending the free period and keeping it public.
This is not advice such as "This is how you should trade," nor do I intend to say that this is the correct answer.
It is purely a single result of mine as an individual, and by showing the consistency of the process of how I repeat a consistent process based on my advance scenarios at a practical level, it is meant for you to use as a reference for your own strategy building and the consistency of your process.
Regarding your own trades, please conduct thorough testing and preparation yourself, and perform them under your own responsibility.
Now, please see the charts below.
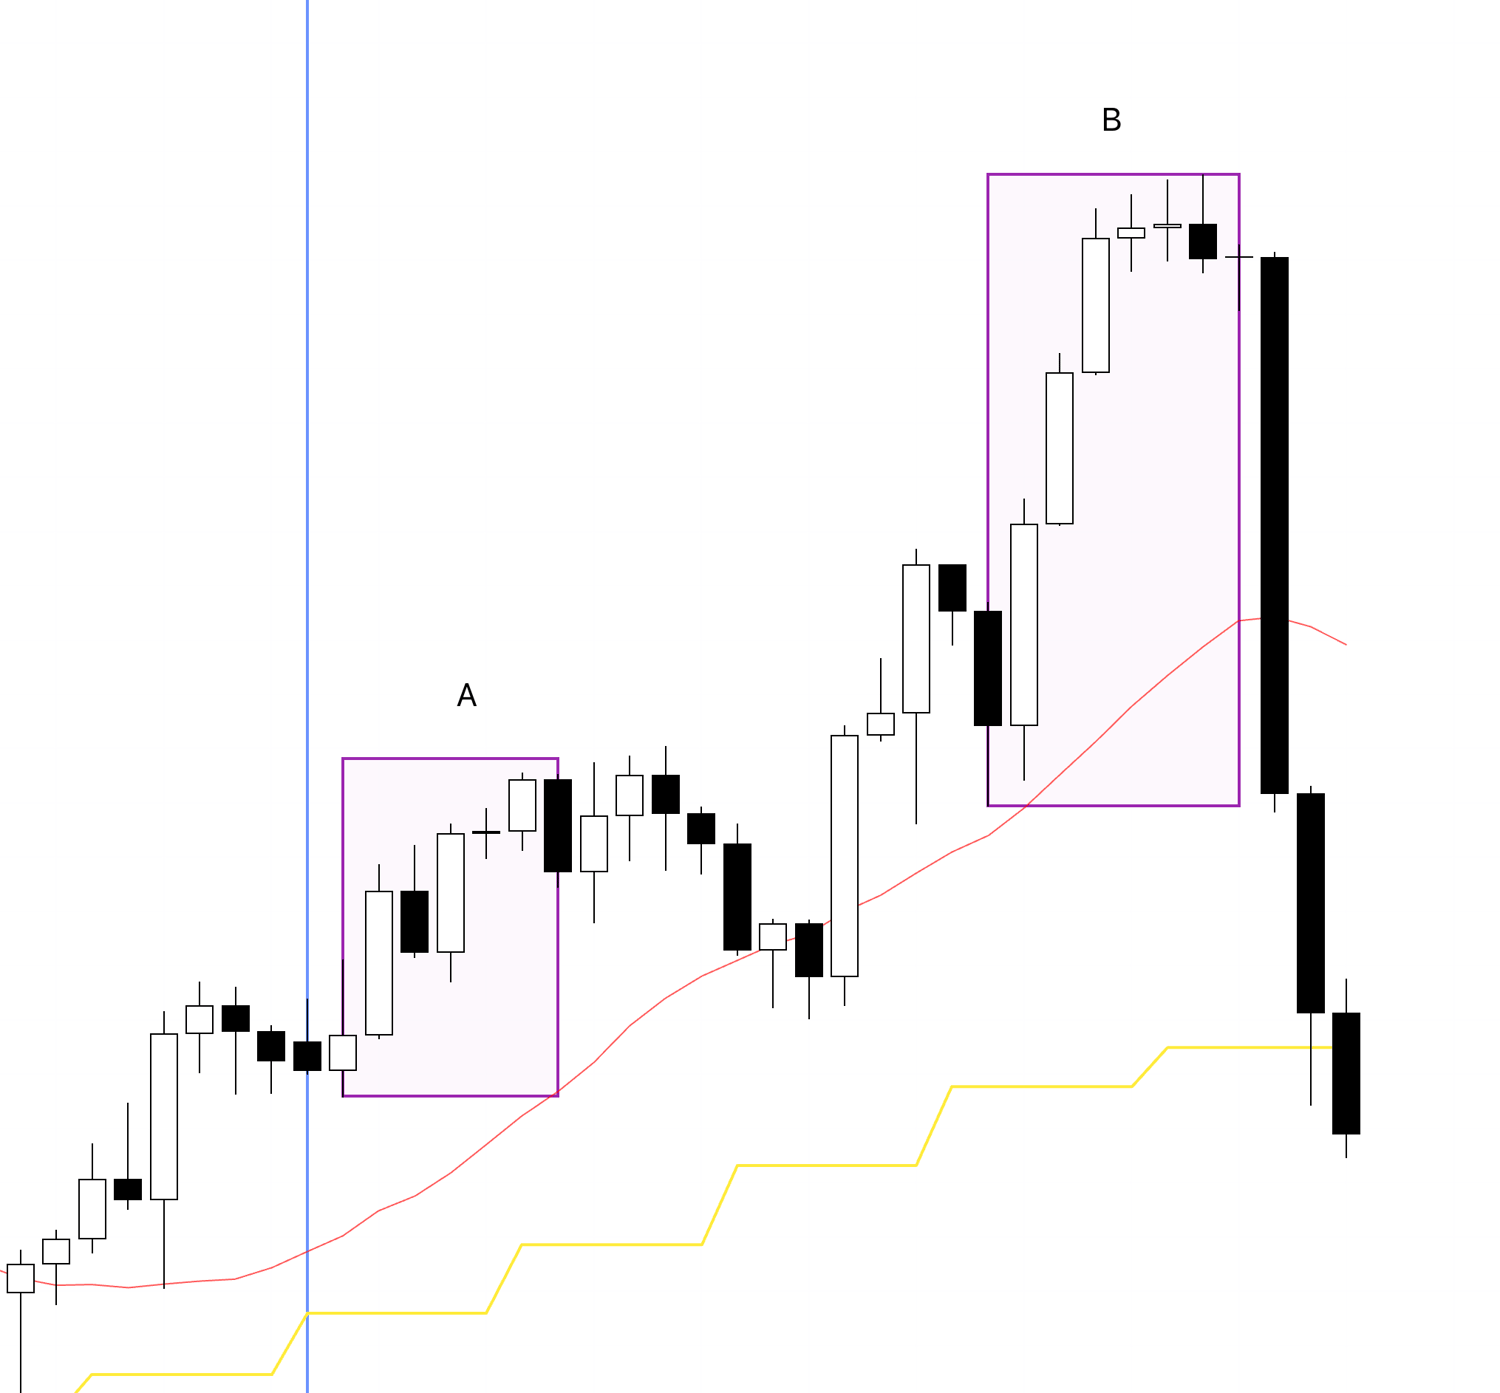
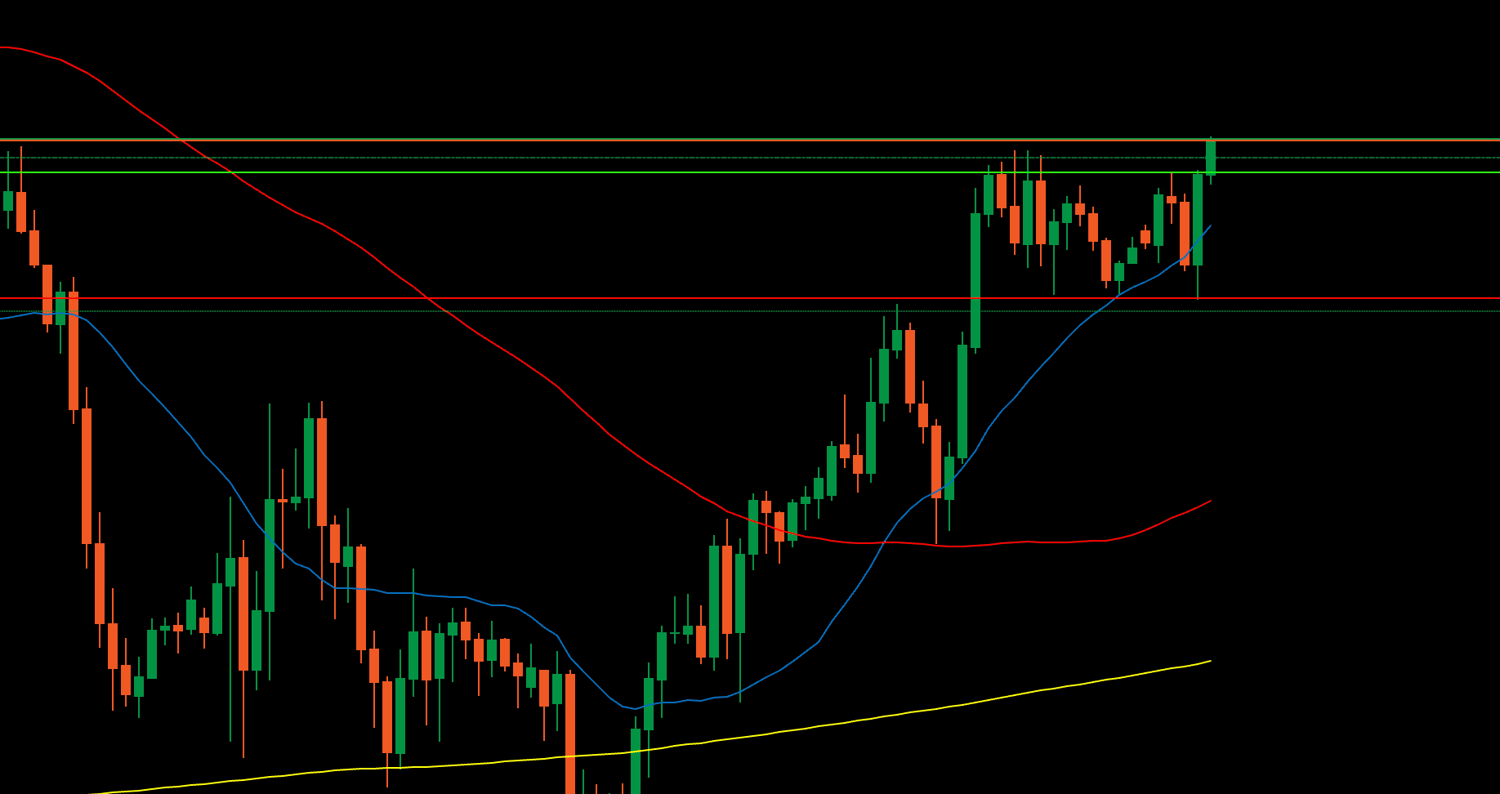
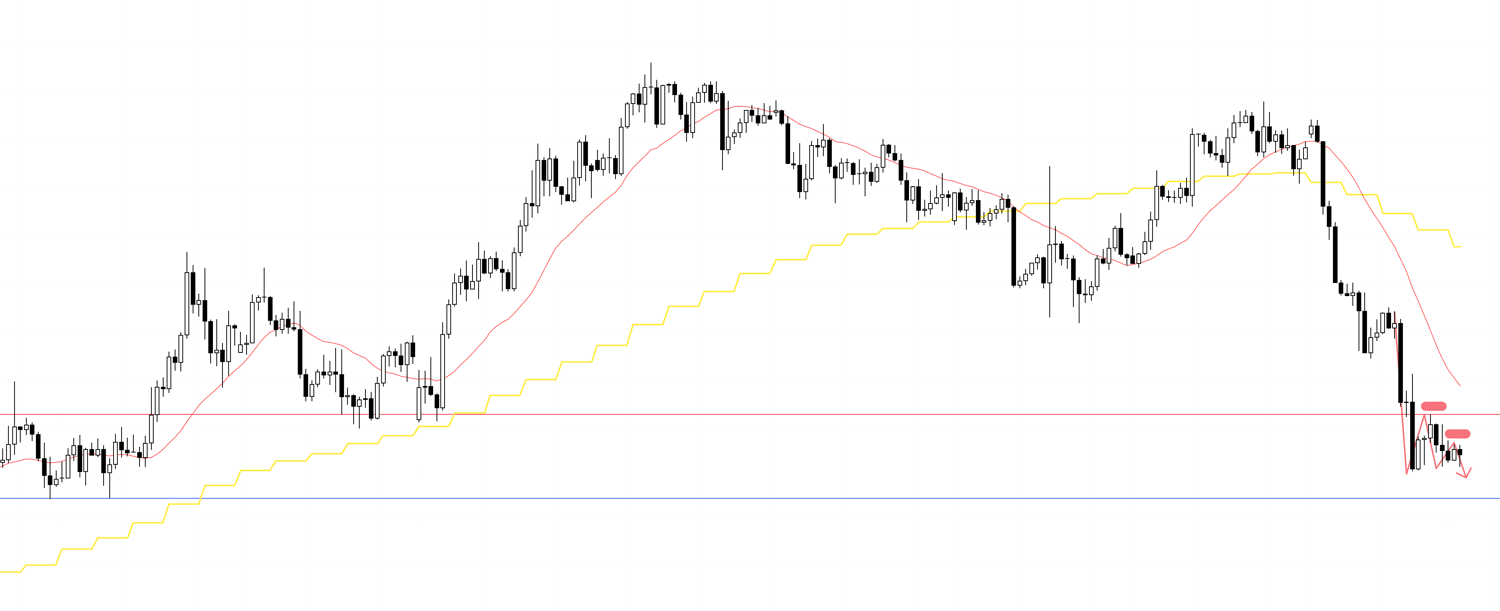
USDJPY 4h

This is the 4h chart for USDJPY.
This week's movement is from the blue vertical line shown on the chart onwards.
I engage in buying on dips and selling on rallies on the 4h chart, and this week there were two points for buying on a 4h dip.
(Regarding the strategy for buying on dips and selling on rallies, please read my past blog posts on Dow Theory and multi-timeframe analysis)
The point where I actually traded is point A.
Point B was a move caused by the BoJ Monetary Policy Statement, but I do not take positions right before such news events are scheduled, so I did not trade here.
Next, please see the EURUSD chart below.
EURUSD 4h
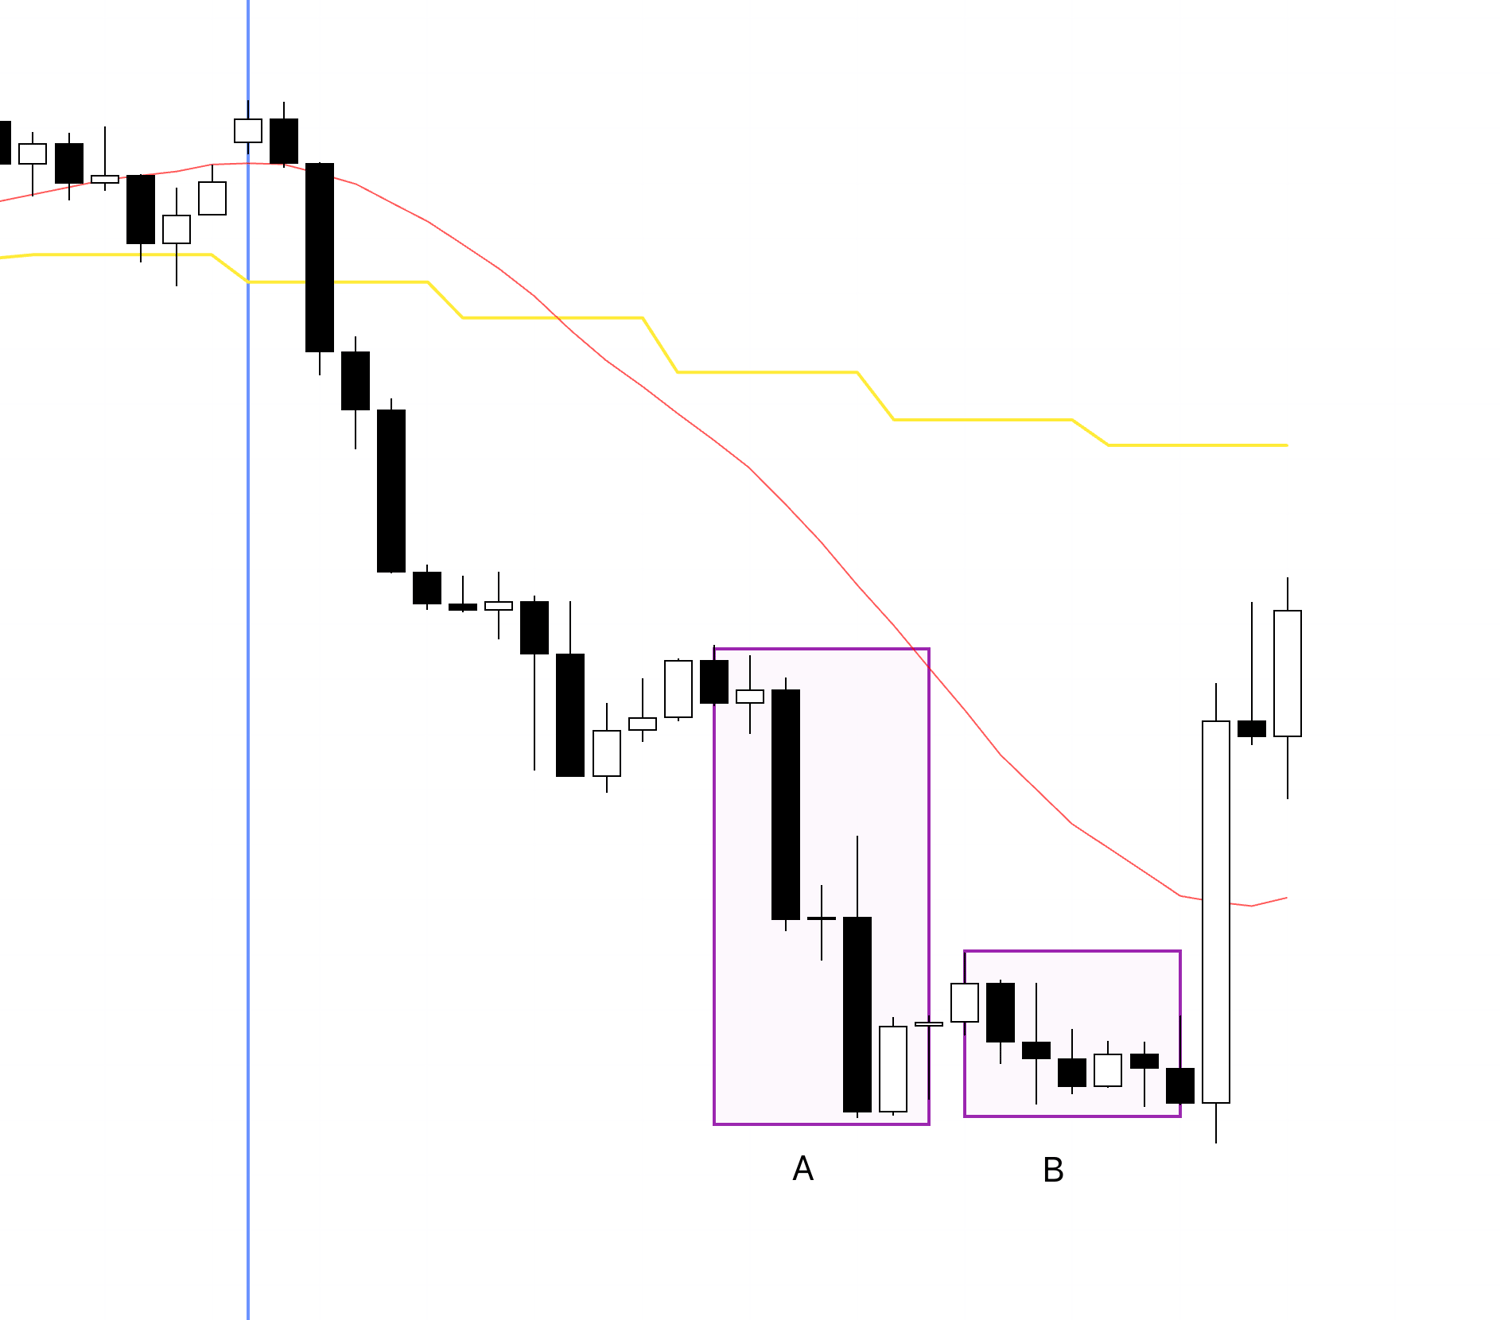
This is the 4h chart for EURUSD.
In EURUSD, there were two points to consider for selling on a 4h rally.
I did not trade at point A because a news event was scheduled immediately after.
At point B, I was waiting to enter if the conditions were met, but the conditions did not materialize, so I passed on it.
There is a very important point as to why I passed on this B, but at that time, I was waiting for the entry while preparing by taking real-time screenshots and writing down my thoughts, so I think the process that led to me passing on it can be a useful reference.
There were many news events this week, so it was a week with few situations where I could enter at a good timing.
Now, first, regarding point A on the USDJPY where I actually traded, I recorded my thoughts while taking screenshots in real-time as I was looking at the chart, so please take a look at this first.
〜・〜・〜・〜・〜・〜・〜・〜・〜・〜・〜・〜・〜・〜・
July 28th (Monday) USDJPY
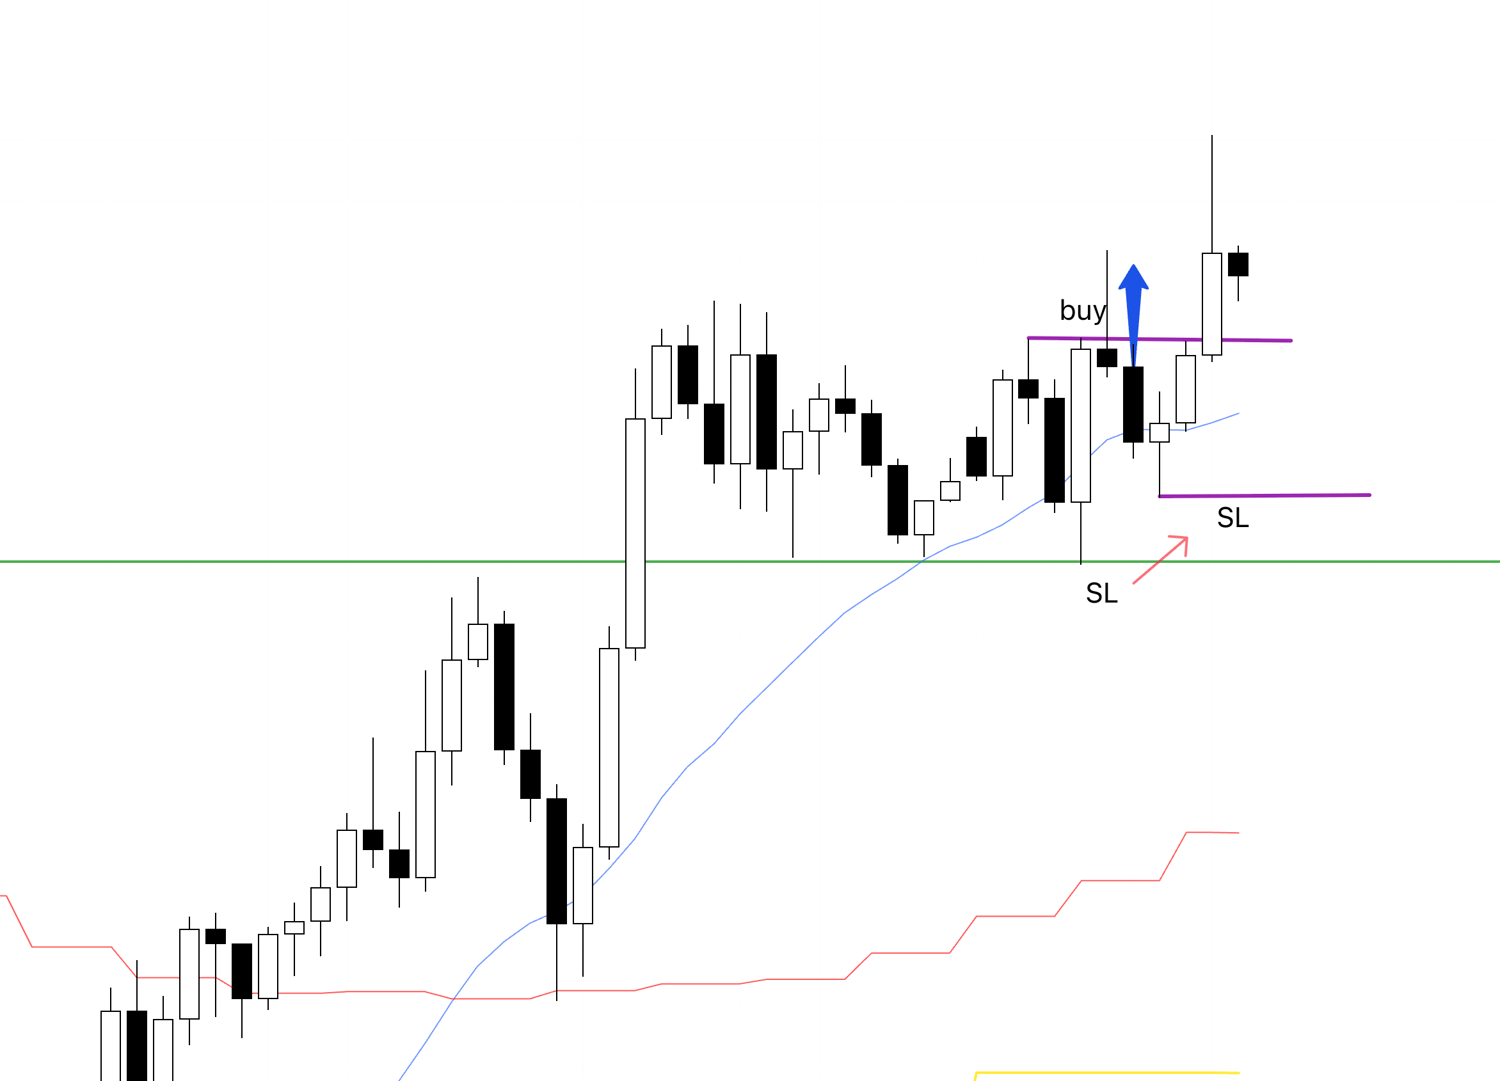
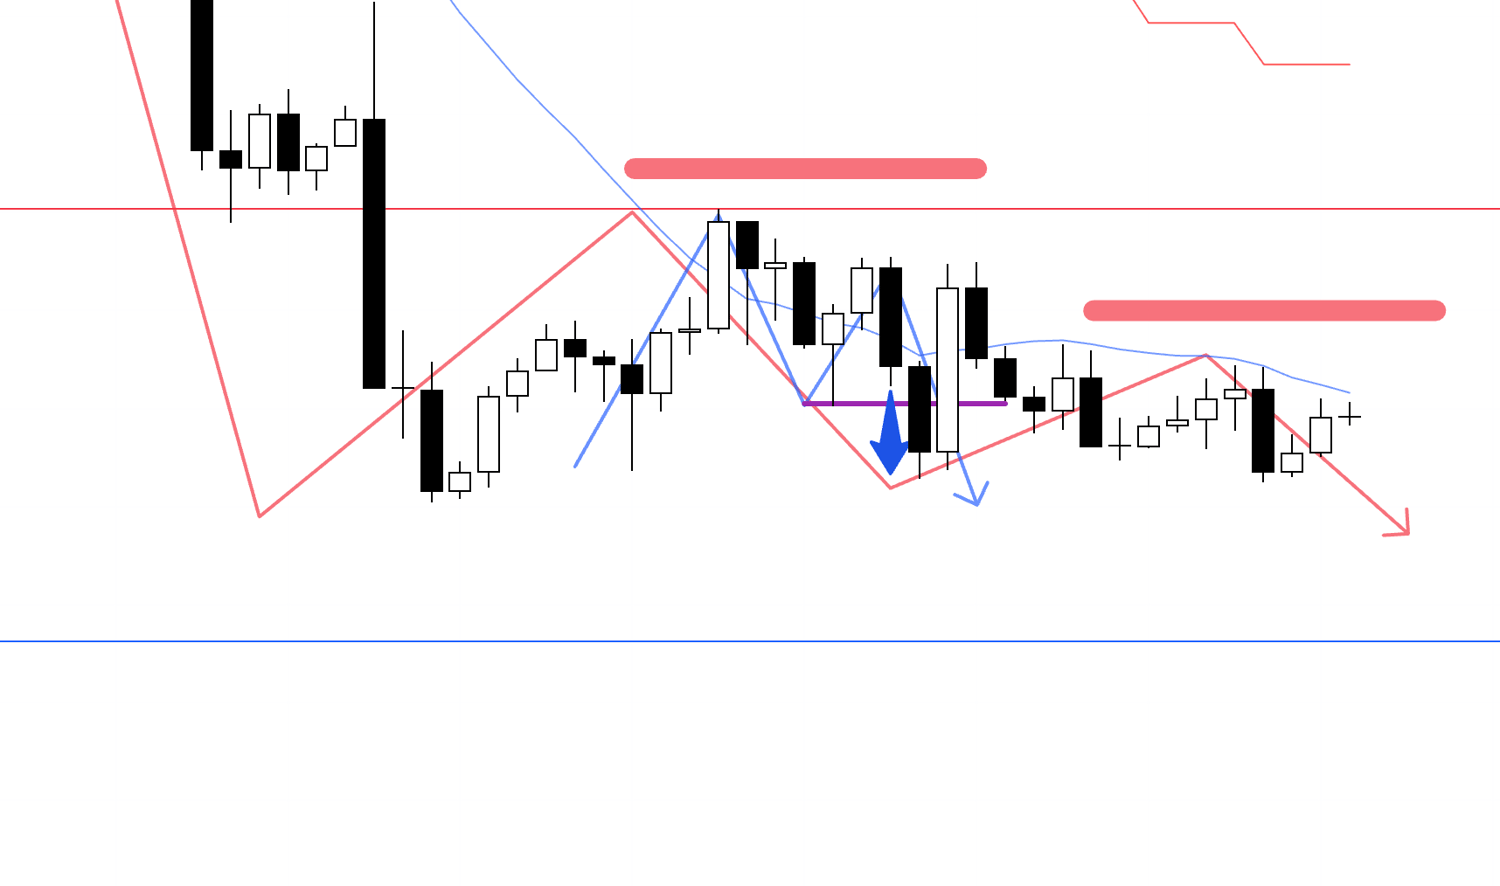
4h Chart from the Scenario Blog Post
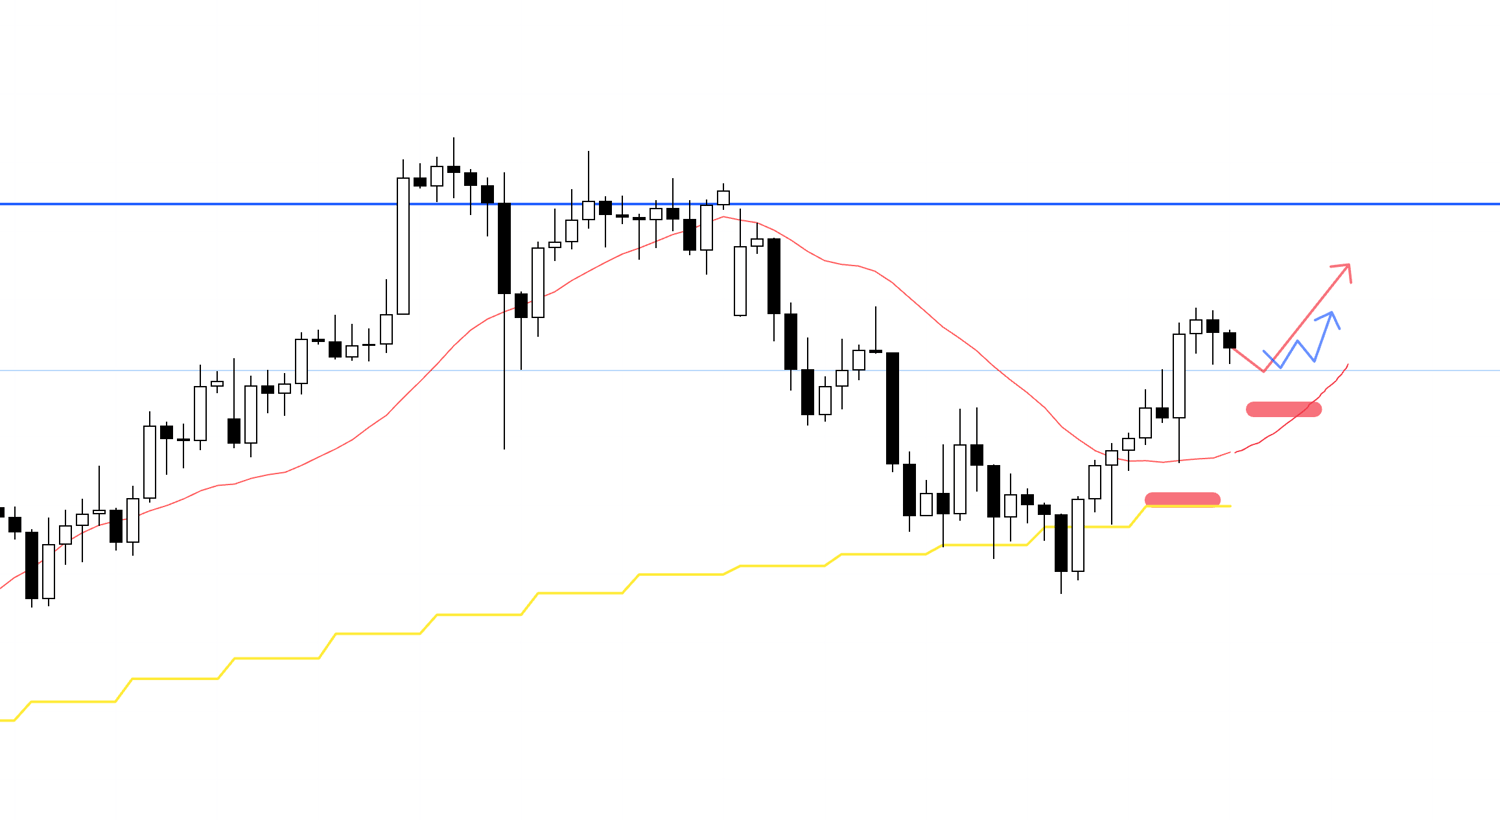
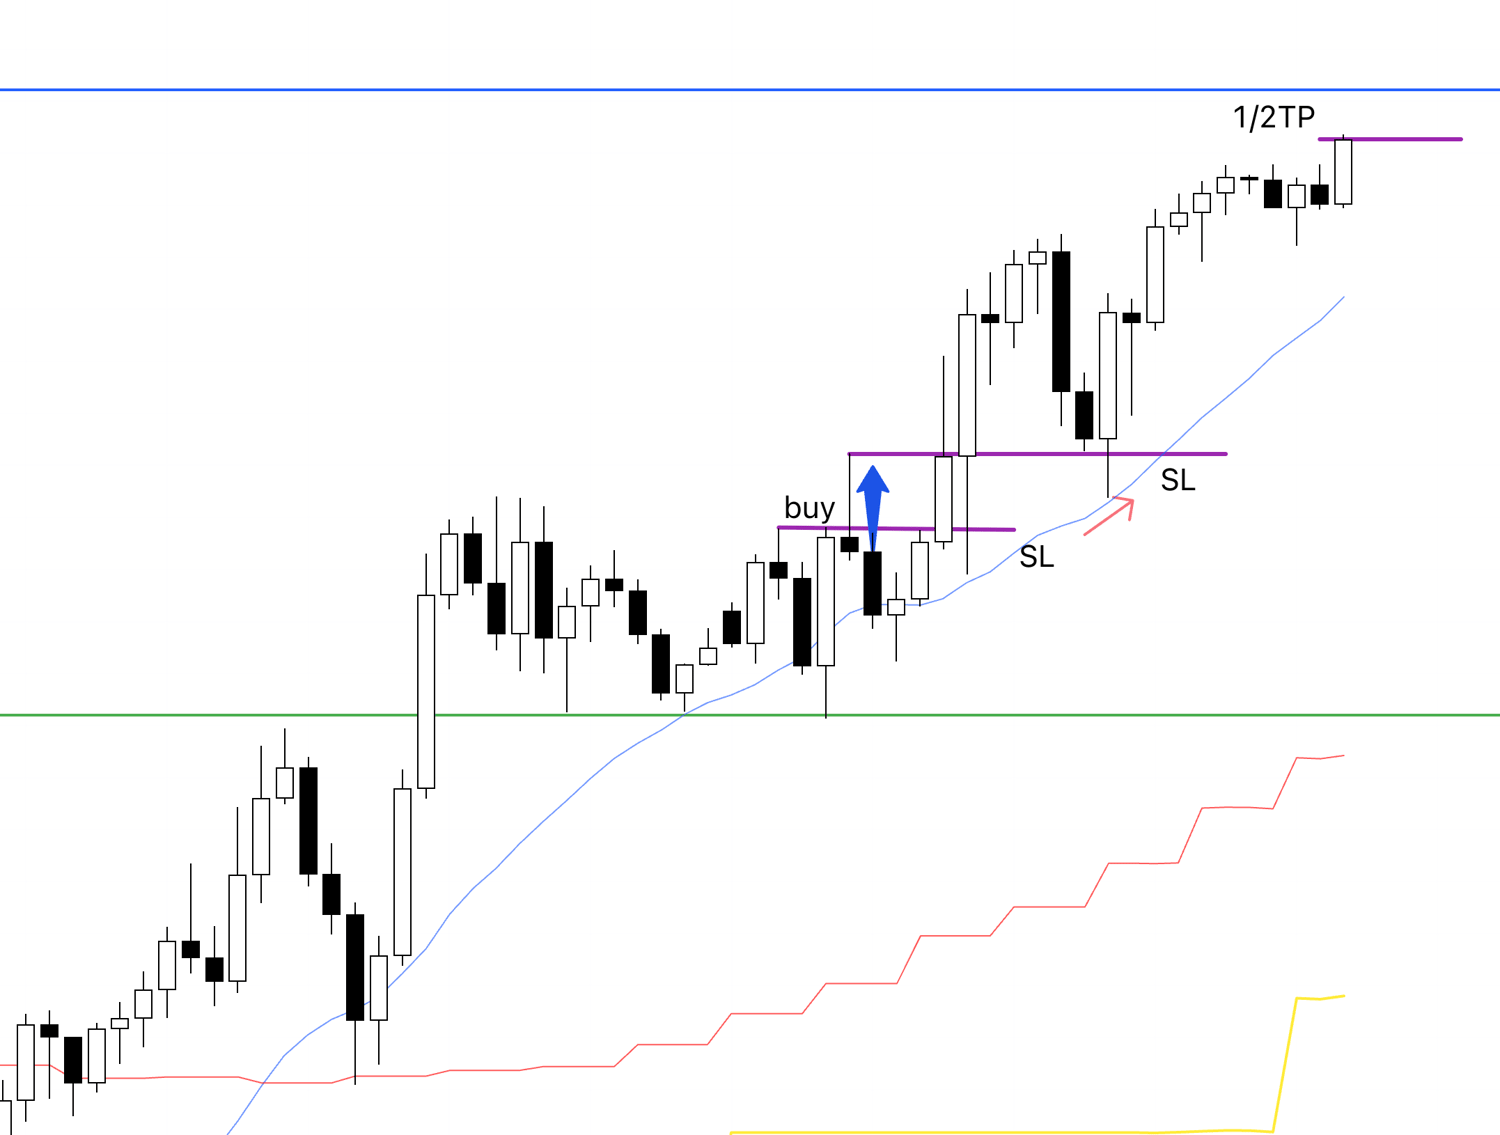
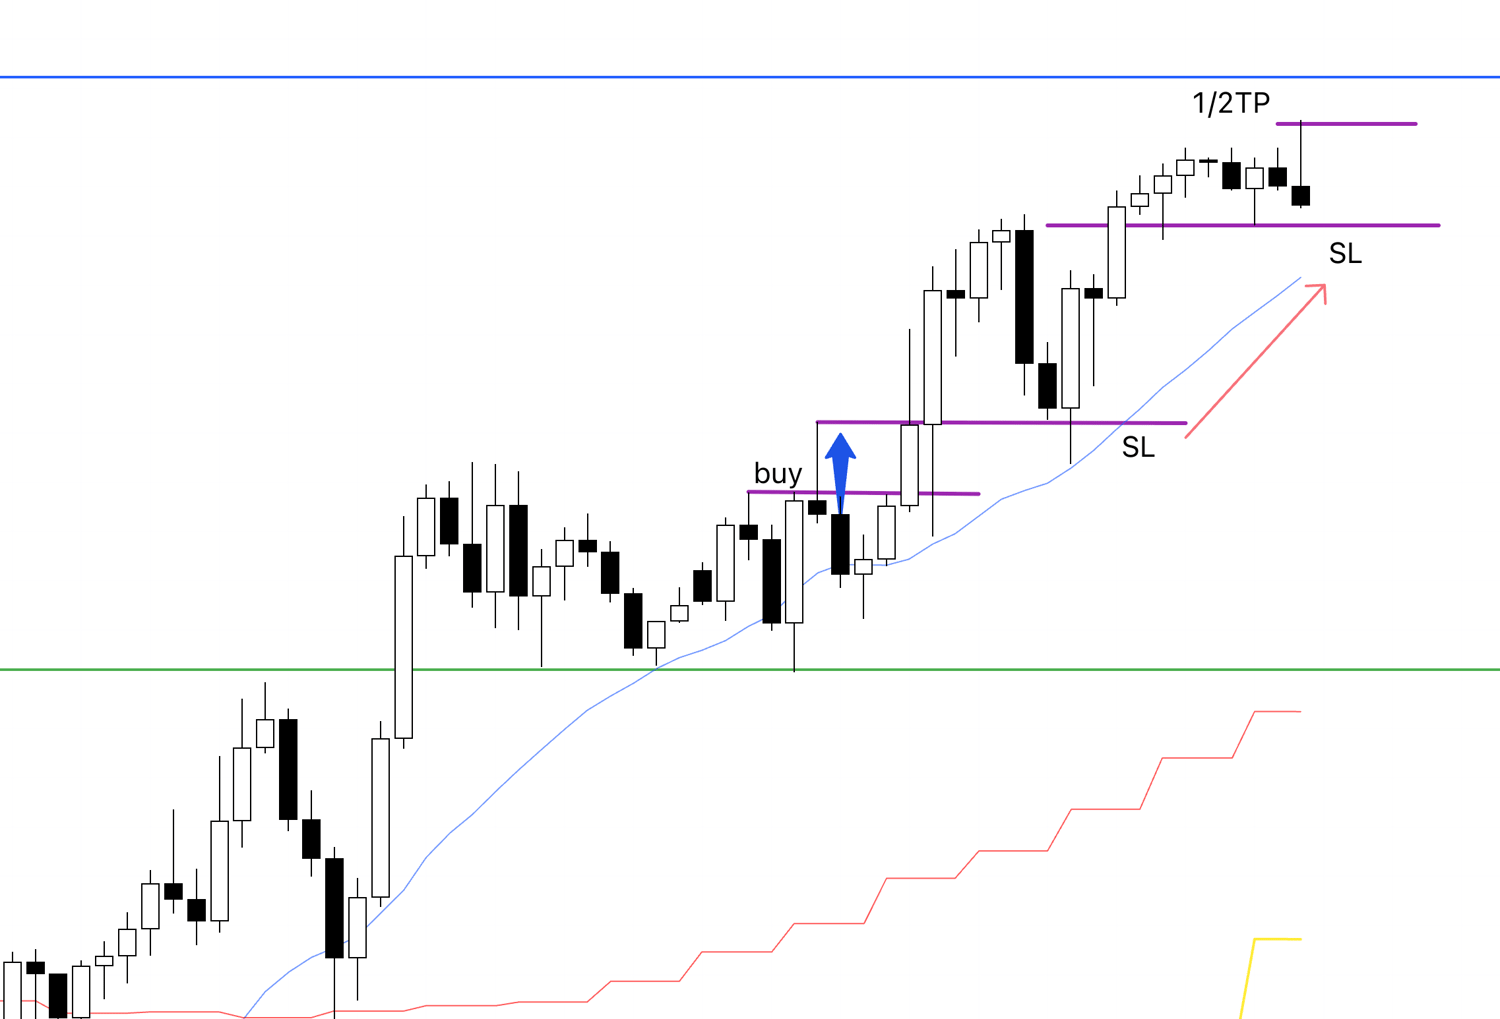
This is the chart for the buy scenario I wrote about in Sunday's blog post, and since this scenario appeared, I placed a buy order.
This is a rise as a buy on a 4h dip, but just above, there is a line that many traders are aware of, drawn as a blue line, and I plan to secure half the profit there for the time being.
This is a 4h buy on a dip that is part of a daily chart buy on a dip, and furthermore, a 1h buy on a dip within that, so it is a point with a very high edge where the direction of orders from traders on many timeframes aligns.
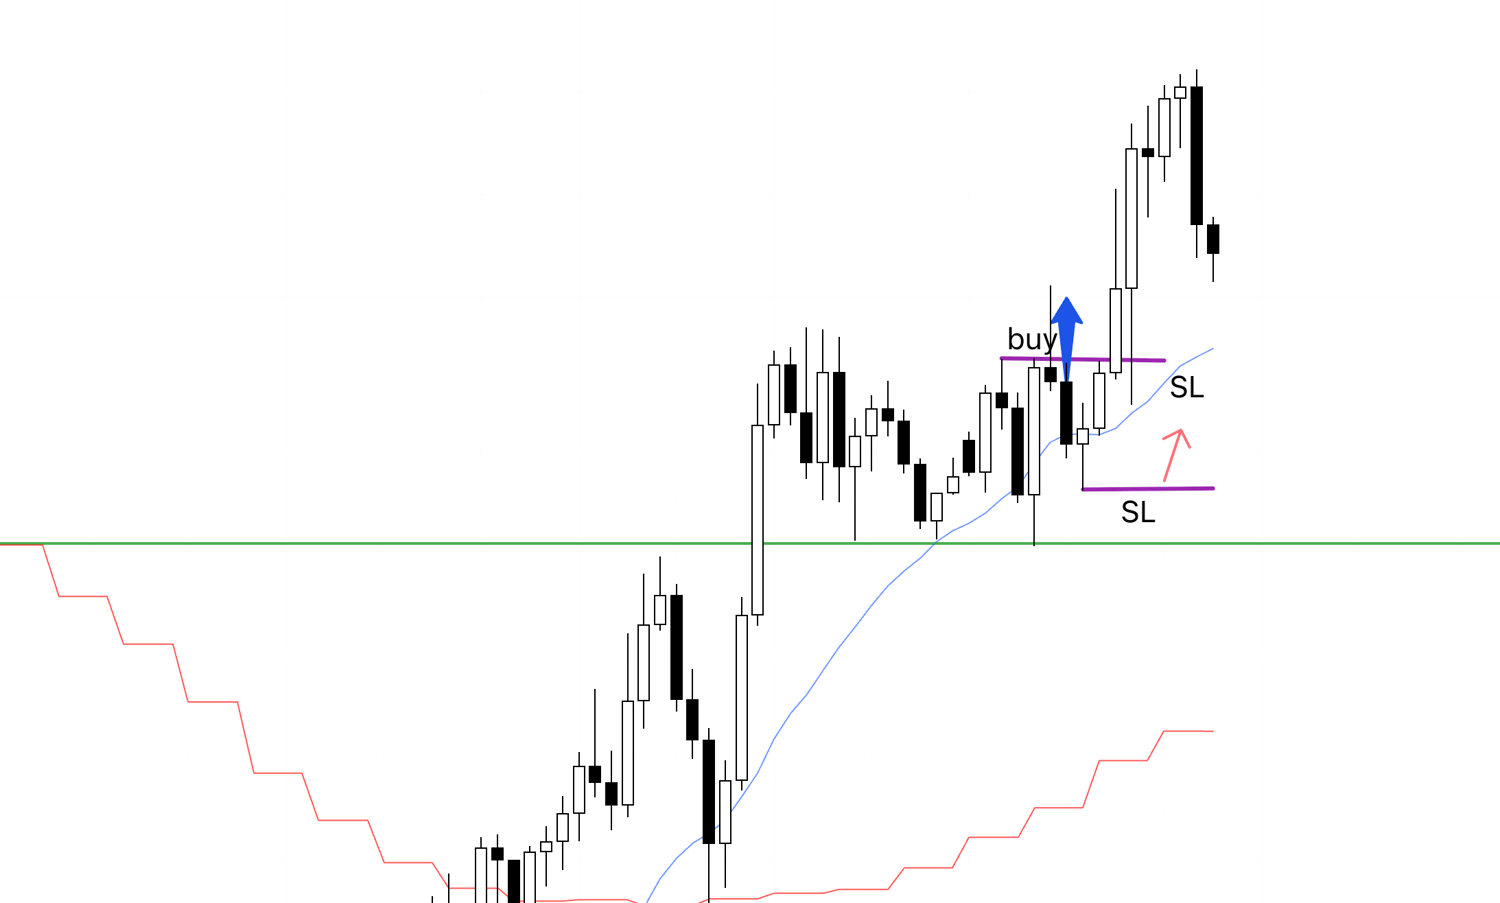
1h
Looking at the 1h chart, it looks like this.
This time, it will be a trade on the 1h chart.
1h
This is the actual 1h chart on cTrader right after entry.
The development will be to see if it can break through the blue line first, but after that, I plan to hold until the trend breaks.
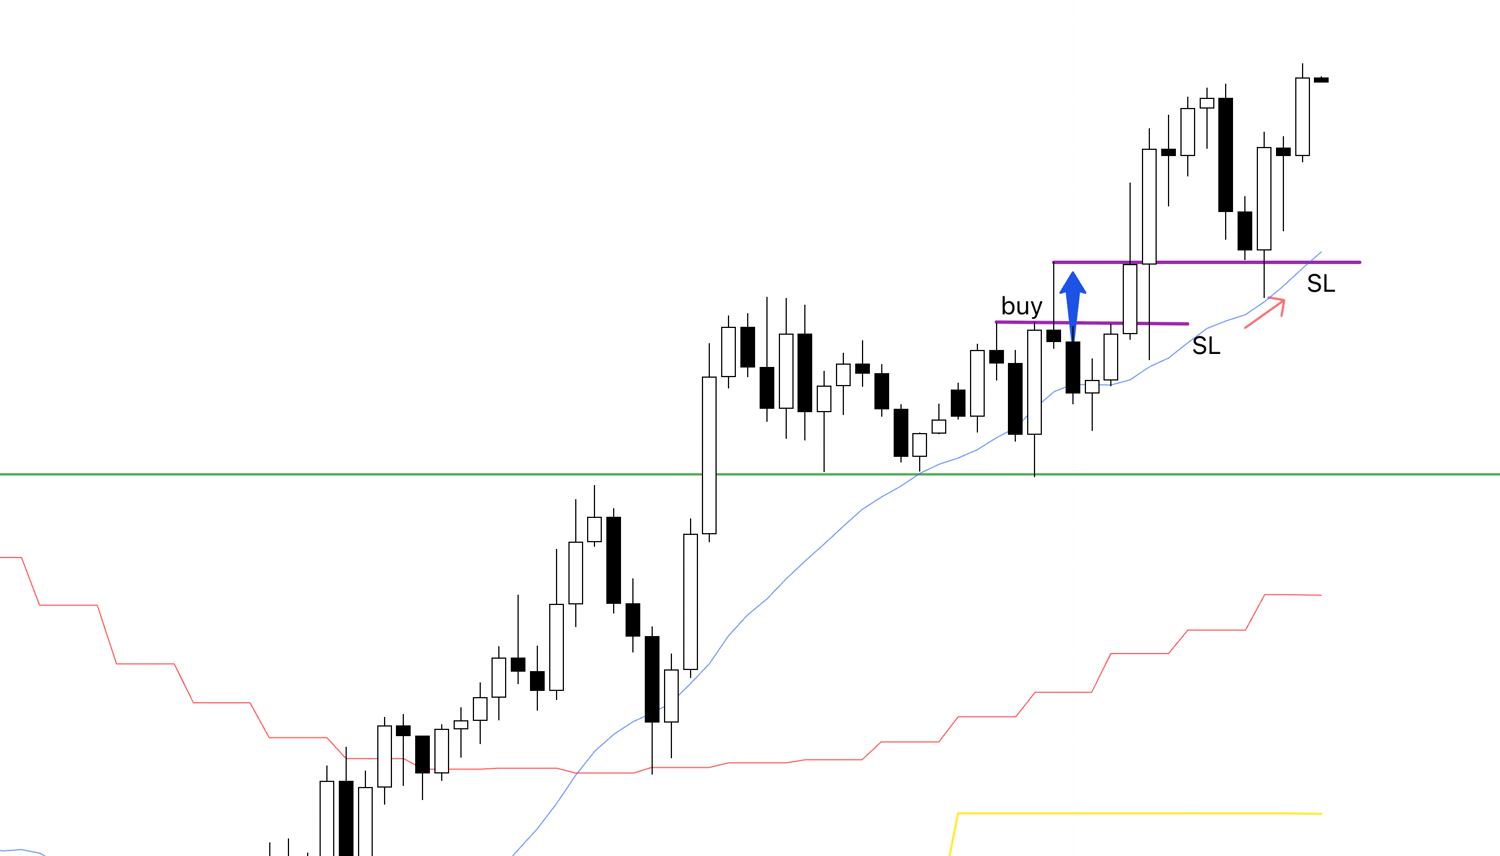
1h
It made a new high and a higher low, so I raised the SL to the newly formed low.
If it breaks this low, the trend on the 1h chart will break, so the position will be closed.
1h
I moved the SL to a point where it would break the high at the time of entry and the moving average simultaneously.
1h
I raised the SL.
After this, I plan to secure half the profit upon reaching the blue line I was watching in the scenario, and then hold until the trend breaks.
I am going to sleep now, so I will leave it as is until morning.
1h
I secured half the profit.
From here, I will watch to see if it can break through the blue line, or if it will reverse and break the trend.
That being said, there is nothing more for me to do but to continue holding while raising the SL until the trend breaks.
1h
I raised the SL.
If it breaks this low, the trend will break, so the trade is over.
1h
The trade just ended.
This is the 1h chart on cTrader where I was actually trading.
It is a trade similar to usual, but I will summarize this trade.
Please see below.
1h
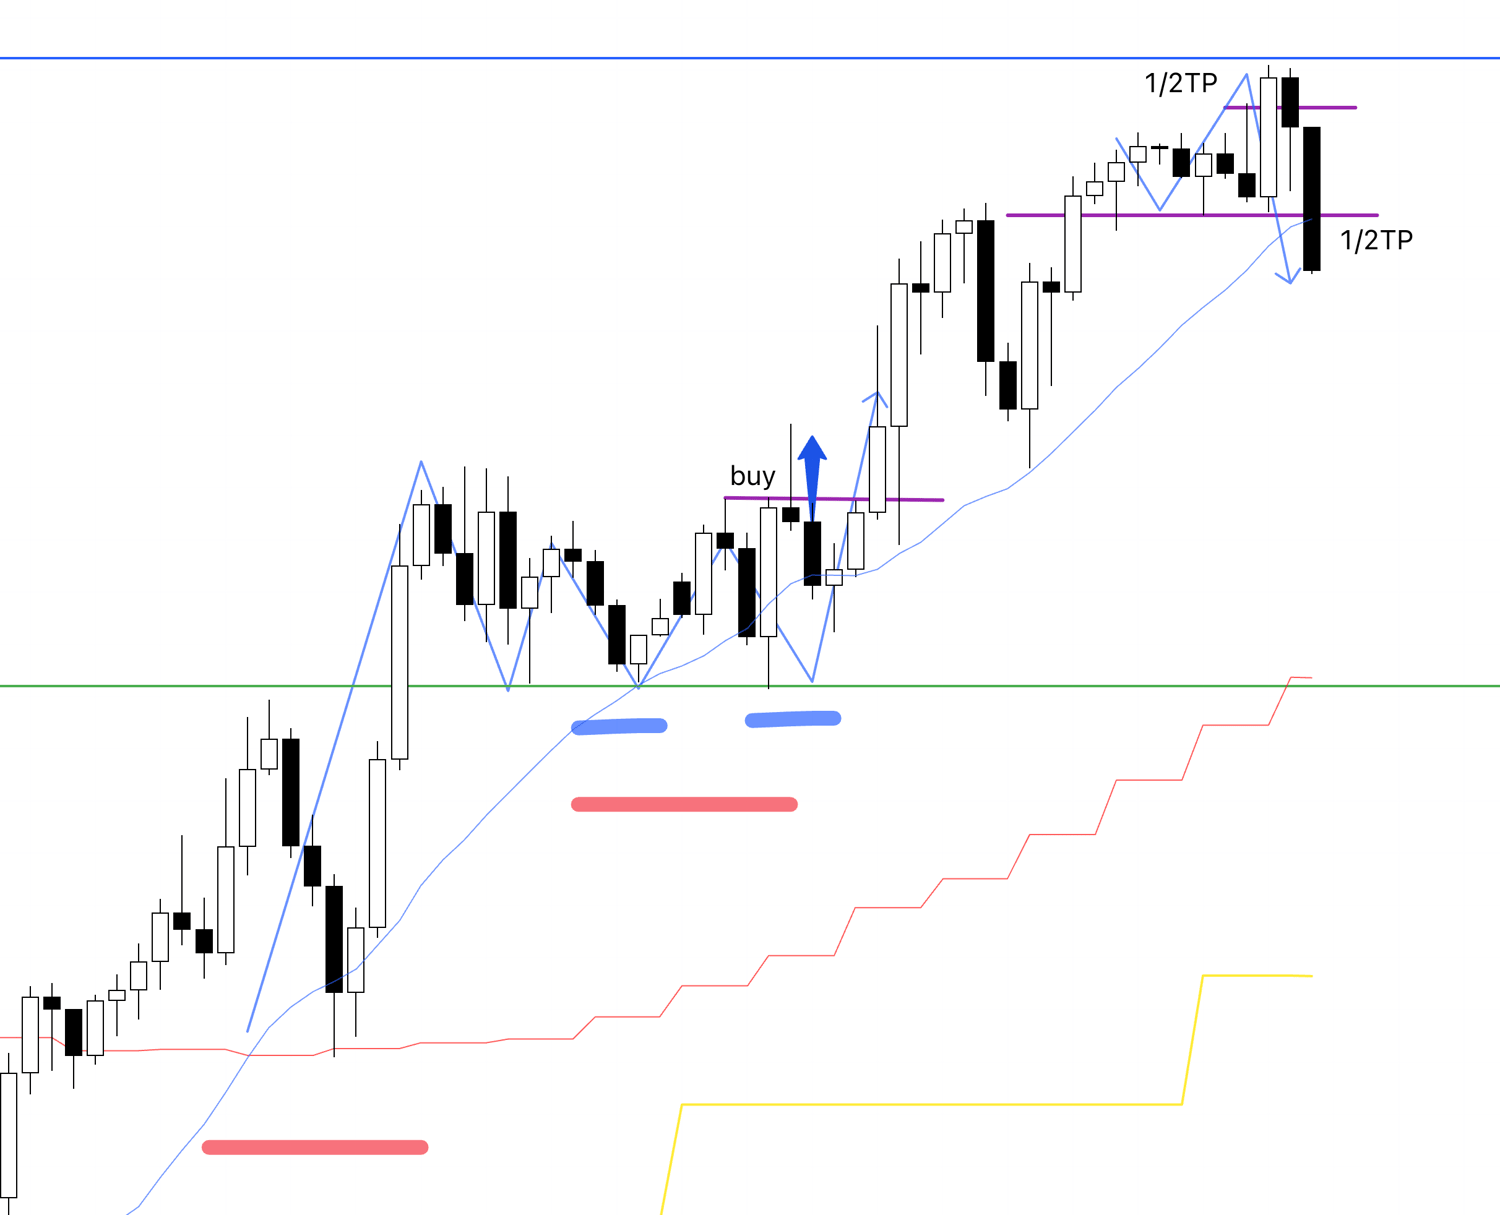
In this way, I followed the trend by buying on a 1h dip, which was inside a 4h buy on a dip, which was part of the daily chart's buy-on-dip scenario I outlined in Sunday's scenario.
Just above, there was a price level that is watched as a weekly chart's sell-on-rally point, which I had drawn on the chart with a blue line, so this time I traded with the style of securing half the profit there for the time being and continuing to hold the rest.
In the end, this time it could not break through the blue line and the trend on the 1h chart broke, so the remaining half was profit-secured where it broke the low, and the trade was finished.
Because I understand what kind of risks exist where in advance like this, I can create a scenario that maximizes profit accordingly and execute it as planned.
I hope this serves as a helpful reference for you.
〜・〜・〜・〜・〜・〜・〜・〜・〜・〜・〜・〜・〜・〜・
August 1st (Friday) EURUSD
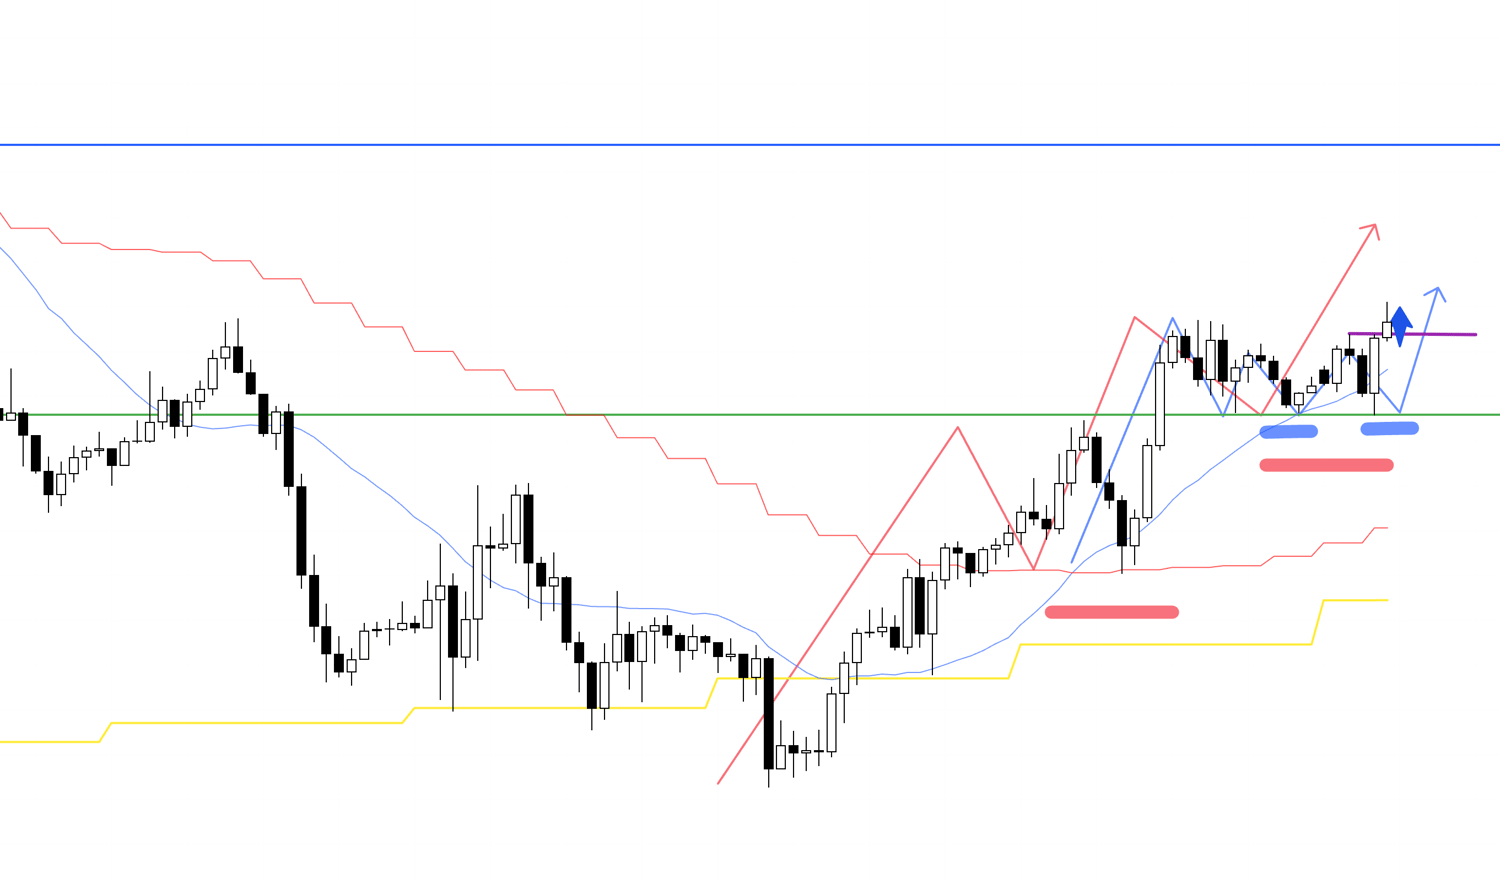
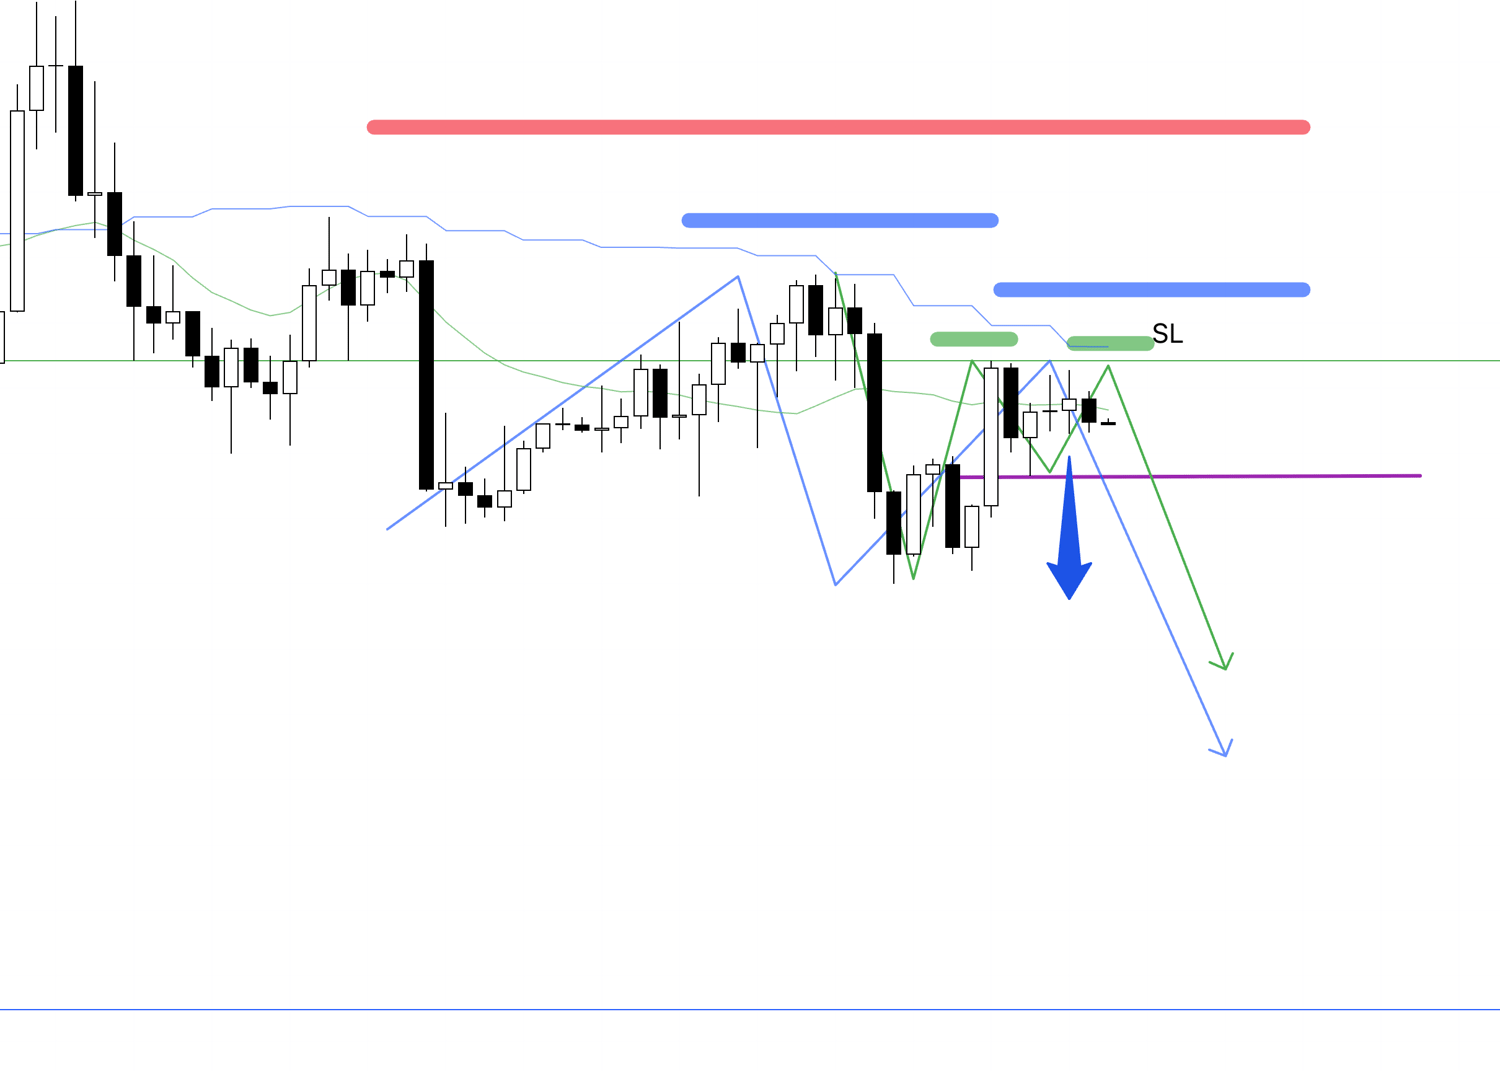
4h
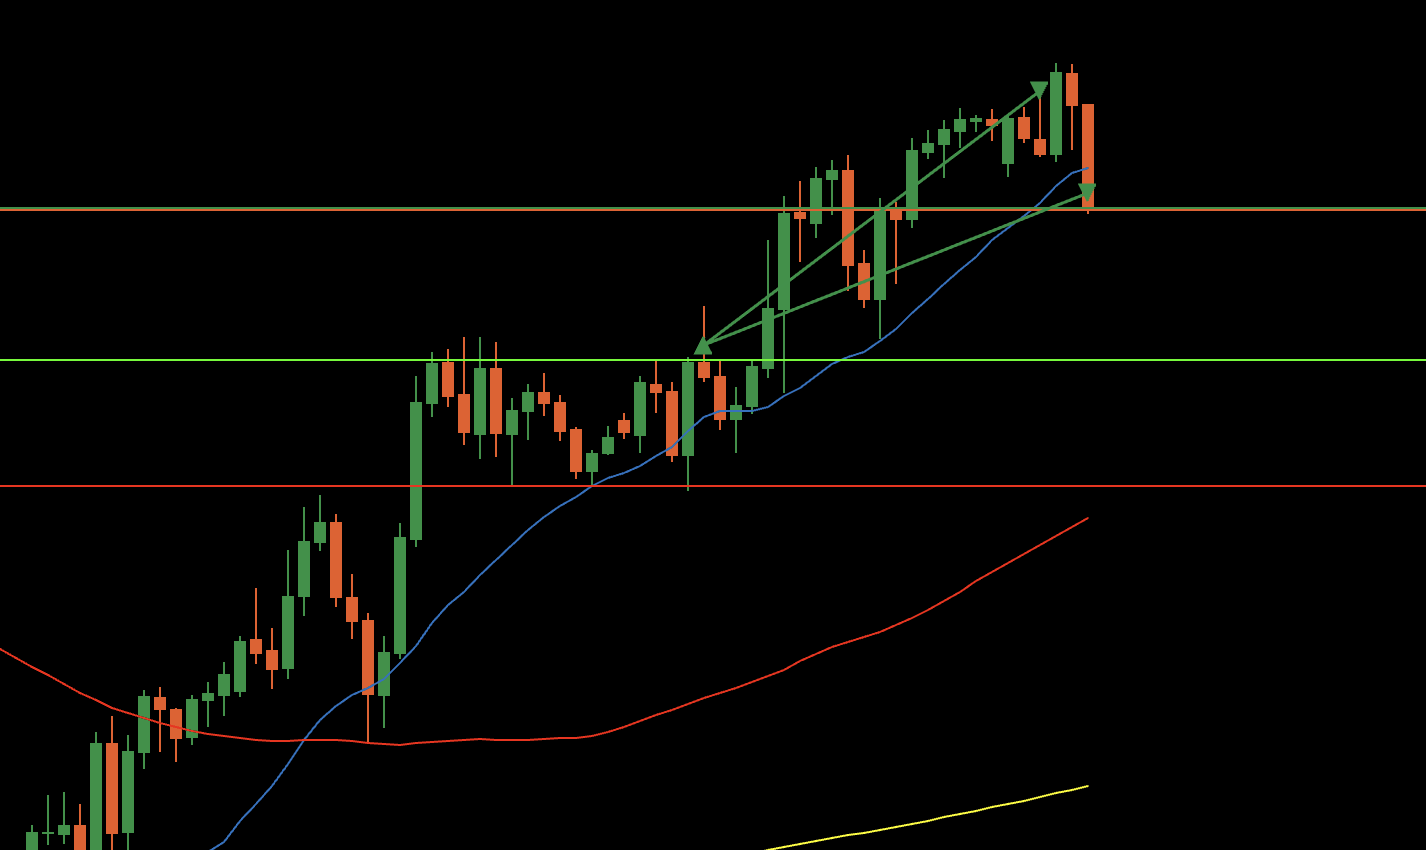
A sell-on-rally scenario appeared on the 4h chart, so I placed a sell stop order.
However, this time it is after a large drop on the 4h chart has already occurred without the trend having broken even once, and there is a point just below, at the blue line you can see, where buying pressure as a weekly chart's buy on a dip will increase, so this will be a trade that considers those risks.
The scale of the 4h chart is small and may be hard to see, but I am intentionally showing it at this scale so you can see where this blue line was drawn from.
1h
Looking at the 1h chart, I would want to enter even a step earlier when it breaks the low drawn in purple, but in this case, it would be an entry trading on the 1h chart, and the risk-reward to the blue line just below is not good, and an economic data release was scheduled right after this, so I did not enter.
The point this time is an entry point even later than this, but a situation to enter on the 15m chart appeared, and the risk-reward didn't seem bad, so if it breaks the low from here, I will enter.
15m
On the 15m chart, considering the distance to the blue line just below, the risk-reward is not bad, so I will go with the style of entering from this purple low break, securing half the profit at the blue line below, and holding the rest until the trend breaks.
15m
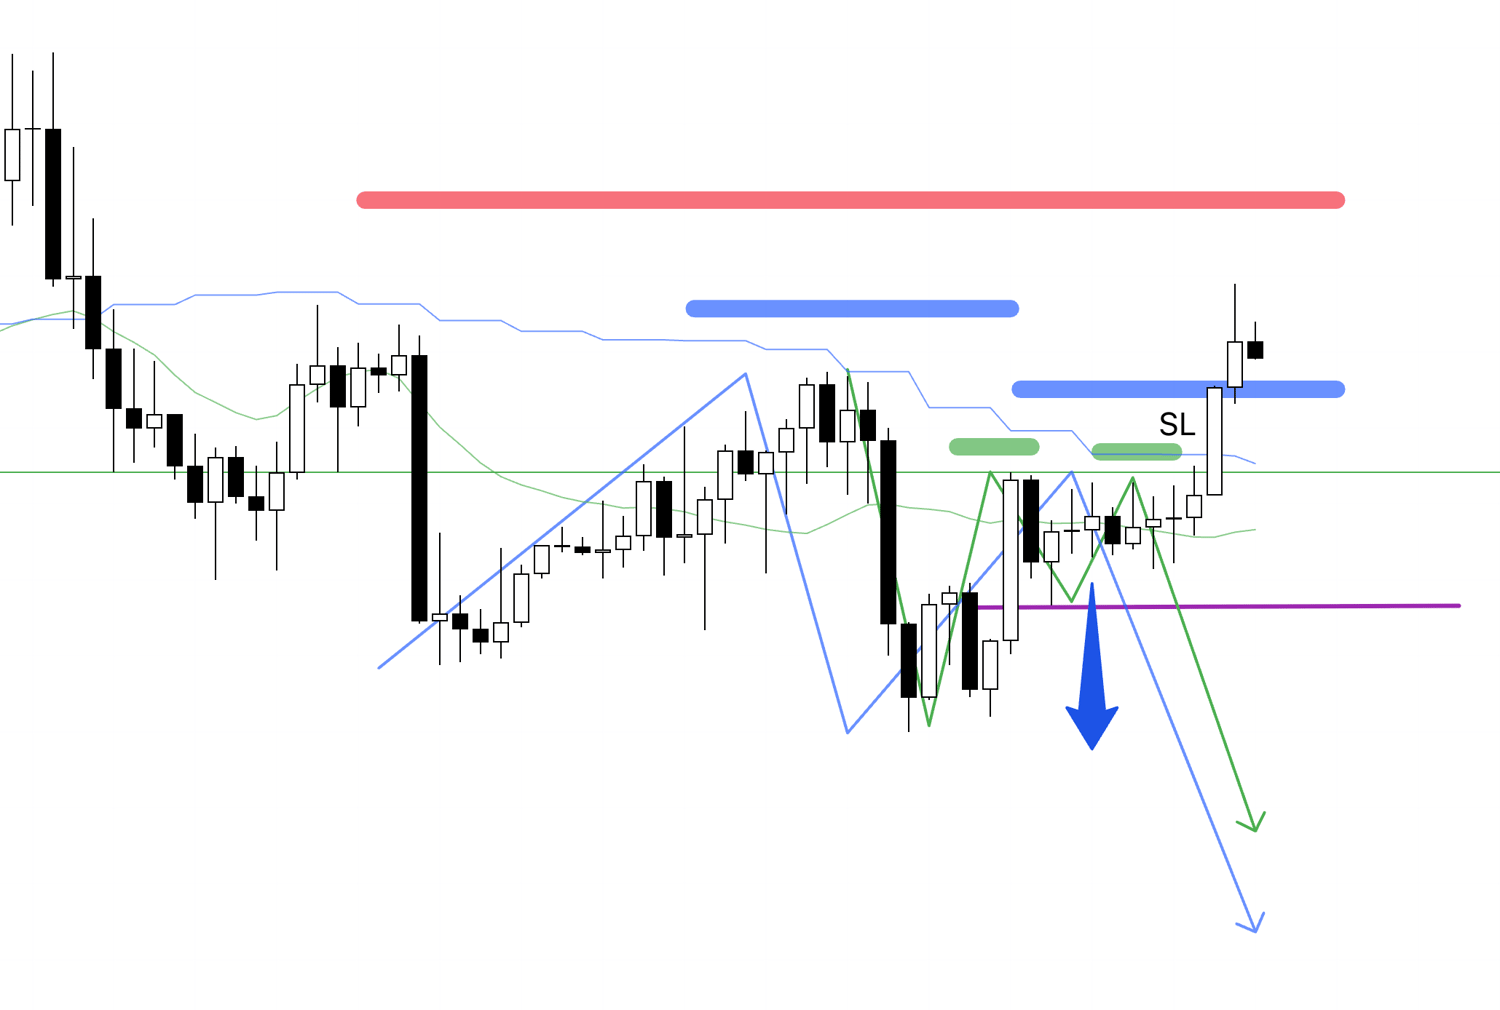
In the end, it made a new high without making a new low, so this order was canceled, and I passed on this trade.
Although it did not lead to an entry this time, I hope the process of how I judge risks in advance, build a scenario, and execute it was a helpful reference.
Not only what was actually traded, but also how trades are passed on is also important, and I repeat those judgments with consistent judgment at all times.
〜・〜・〜・〜・〜・〜・〜・〜・〜・〜・〜・〜・〜・〜・
That is all.
When news events continue every day like this week, if a situation appears where I can enter with good timing, I will trade, but it is not good to force a trade even if it means breaking the rules.
Looking at the results, you might think, "I should have done it," but that is judging by the results alone, and rather than being swayed by single results, it is fine as long as you are properly doing only what needs to be done.
If you buy on 4h dips and sell on rallies like I do, about two or three trade opportunities per currency pair appear in a week.
I trade two currency pairs, so there are about 4 to 6 trade opportunities in a week, and among those, the number of trades is further narrowed down by various conditions.
However, even if the number of trades is small, if you repeat trades only at points with a high edge, you can repeat trades with very advantageous win rates and risk-rewards, so I repeat trades only at those points, and I am building a large sample size made only at those points over a long period.
Without rushing, it is very important to continue executing a consistent process over the long term based on a scenario of "If this happens, then I'll do that."
This "Weekly Trade Report" was scheduled to become paid content starting this month, but due to its popularity, it will be published for free for a while longer.
In this report, published every Saturday, I compile the thought processes (judgments for entry, stop loss, profit taking, etc.) that I recorded in real-time for the trades I actually made that week.
This "Weekly Trade Report" is planned to become paid content in the future, so please take this opportunity to experience my real-time thinking.
Please note that these are provided for educational purposes only, they do not constitute instructions for you to buy or sell, nor do they guarantee future profits.
You yourself are responsible for any and all trades you make, so please spend adequate time on strategy building and testing, and engage in trading at your own risk.
I hope that through the explanation of my trend-following strategy, it can serve as a reference for your strategy building.