


Hello.
I will lay out my trade scenarios for the upcoming week.
I post this "Trade Scenarios" blog "every" Sunday.
And every Saturday, I post a "Weekly Trade Report" detailing how I actually thought and traded during that week.
By reading it together with the Trade Scenarios blog, I believe you can reference a consistent, practical process of how to think in advance, what to wait for, and how to execute.
For strategy, please see the blogs on Dow Theory and Multi-Timeframe Analysis.
A scenario is not a forecast.
It is not a forecast, but rather my personal plan of, "if this happens, then I will do this".
I do not forecast the market, and this is not that kind of thing, so please understand this in advance.
And this is not intended to give you trading instructions or provide signals.
It does not guarantee future profits; it is provided for educational purposes, using the consistent process I execute as a subject.
I cannot take responsibility for any outcome of the trades you make, so please trade at your own risk.
Now, let's look at USDJPY.
〜・〜・〜・〜・〜・〜・〜・〜・〜・〜・〜・〜・〜・〜・
USDJPY
First, please take a look at the daily chart below.
Daily Chart
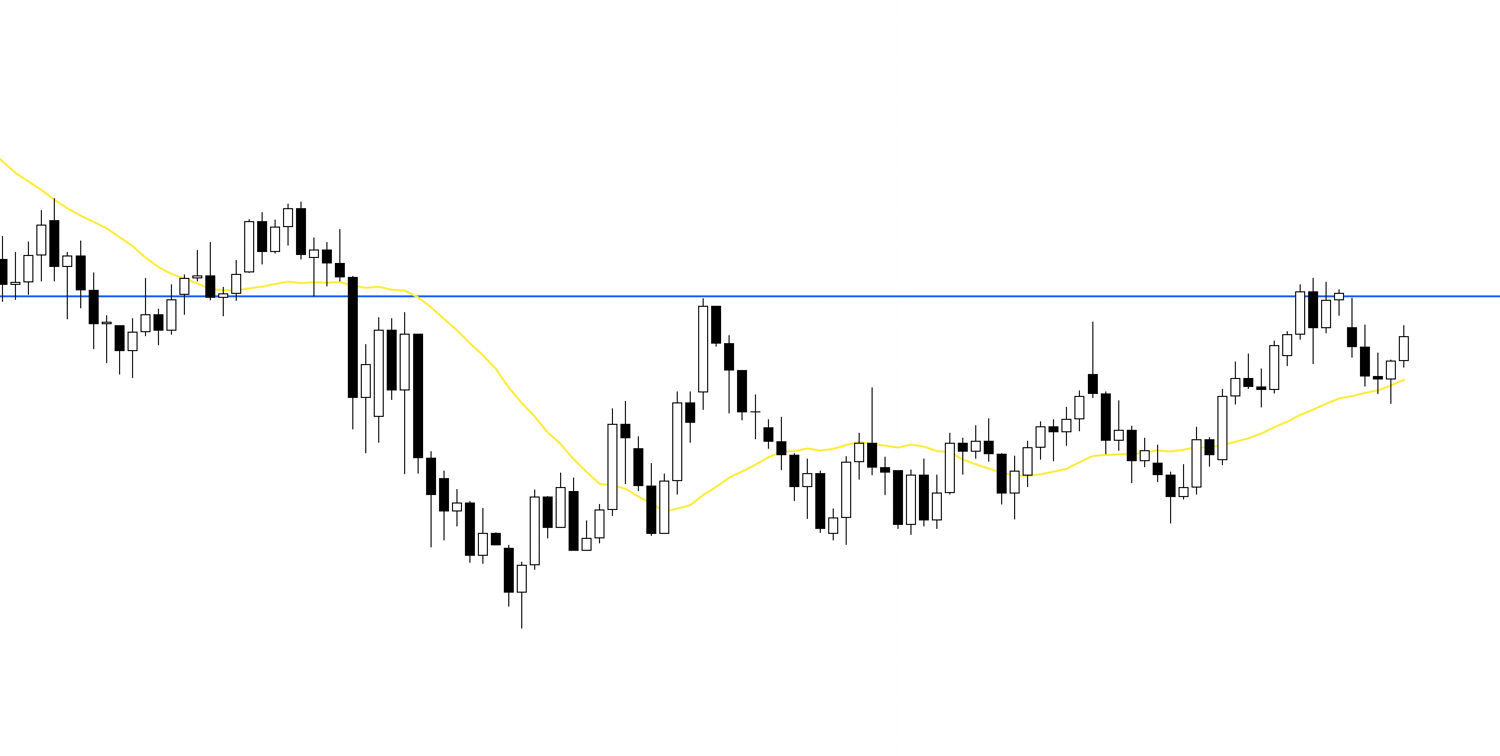
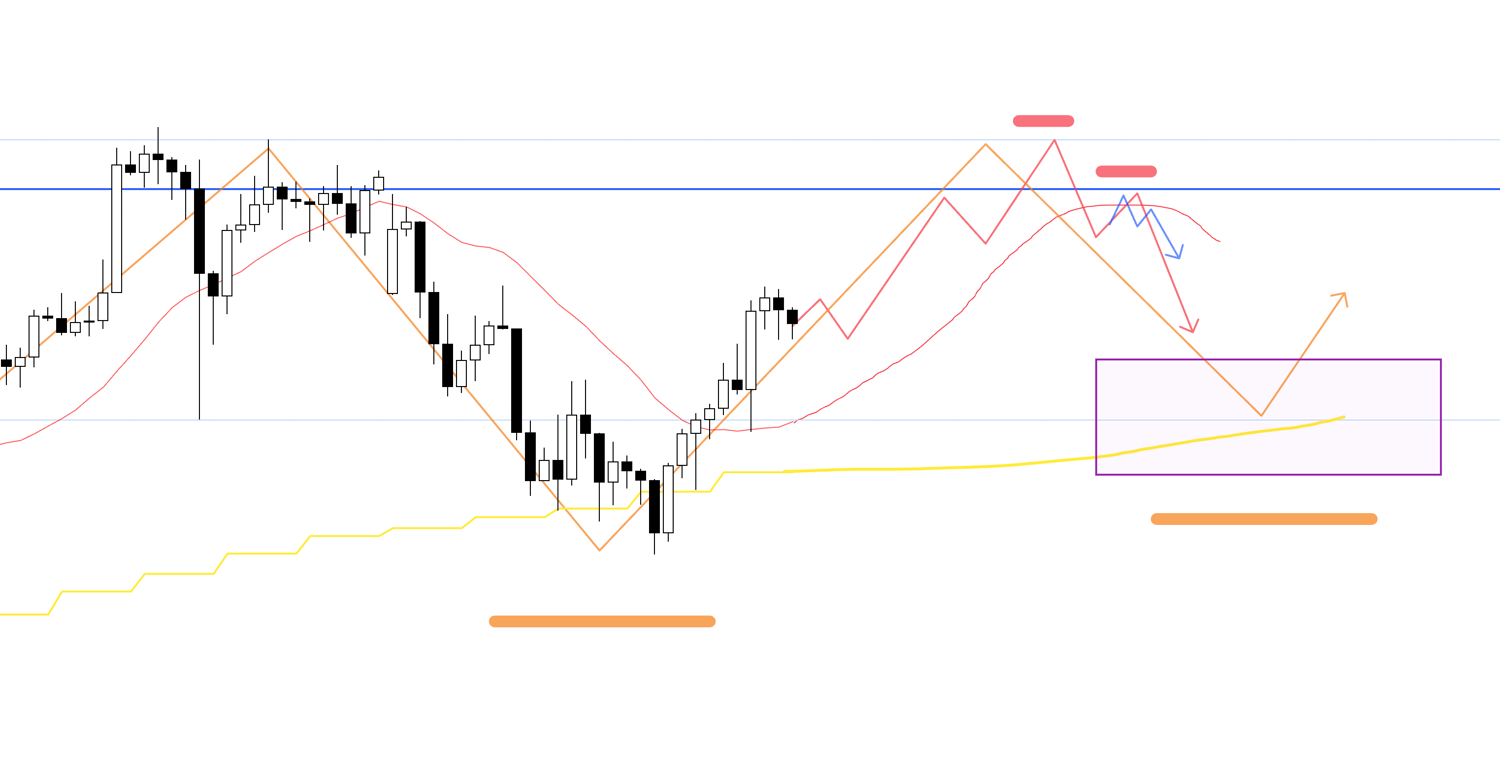
Currently, the highs are being suppressed by the blue line, which is also recognizable on the weekly chart, and we are at a point where we are watching to see which scenario unfolds: whether the uptrend can continue as a pullback buy on the daily chart, or if it will be suppressed and function as a pullback sell on the weekly chart.
Daily Chart
The most recent low on the daily chart has not yet been broken, and the moving average is providing support from below, so we are currently at a point of seeing if we can update the high and continue the uptrend as a pullback buy on the daily chart, but since the nearby blue line is being watched by many traders, for those like me who trade on even lower timeframes, the key point will be whether the risk/reward to that line is favorable.
Daily Chart
On the other hand, in the case of a decline without being able to break above the blue line directly above, the area just below the purple low line is a point where stop-loss orders from traders who had been profitable on long positions and new sell orders are likely to be concentrated, so if the price breaks through here and forms a lower high, sell orders will have a significant edge.
In this case, it would also take the form of a pullback sell on the weekly chart.
Daily Chart
I have overlaid the weekly chart's movement on the daily chart with a purple line.
In this way, if a bearish scenario unfolds in the future, we will aim for a trade where the weekly, daily, and lower timeframes are all pointing in the same direction, which leads to a trade with a very high edge.
Conversely, in a bullish scenario, it is necessary to construct a plan bearing in mind that selling pressure still exists as a risk up to this blue line.
Now, based on that, let's look at the 4h chart.
4h
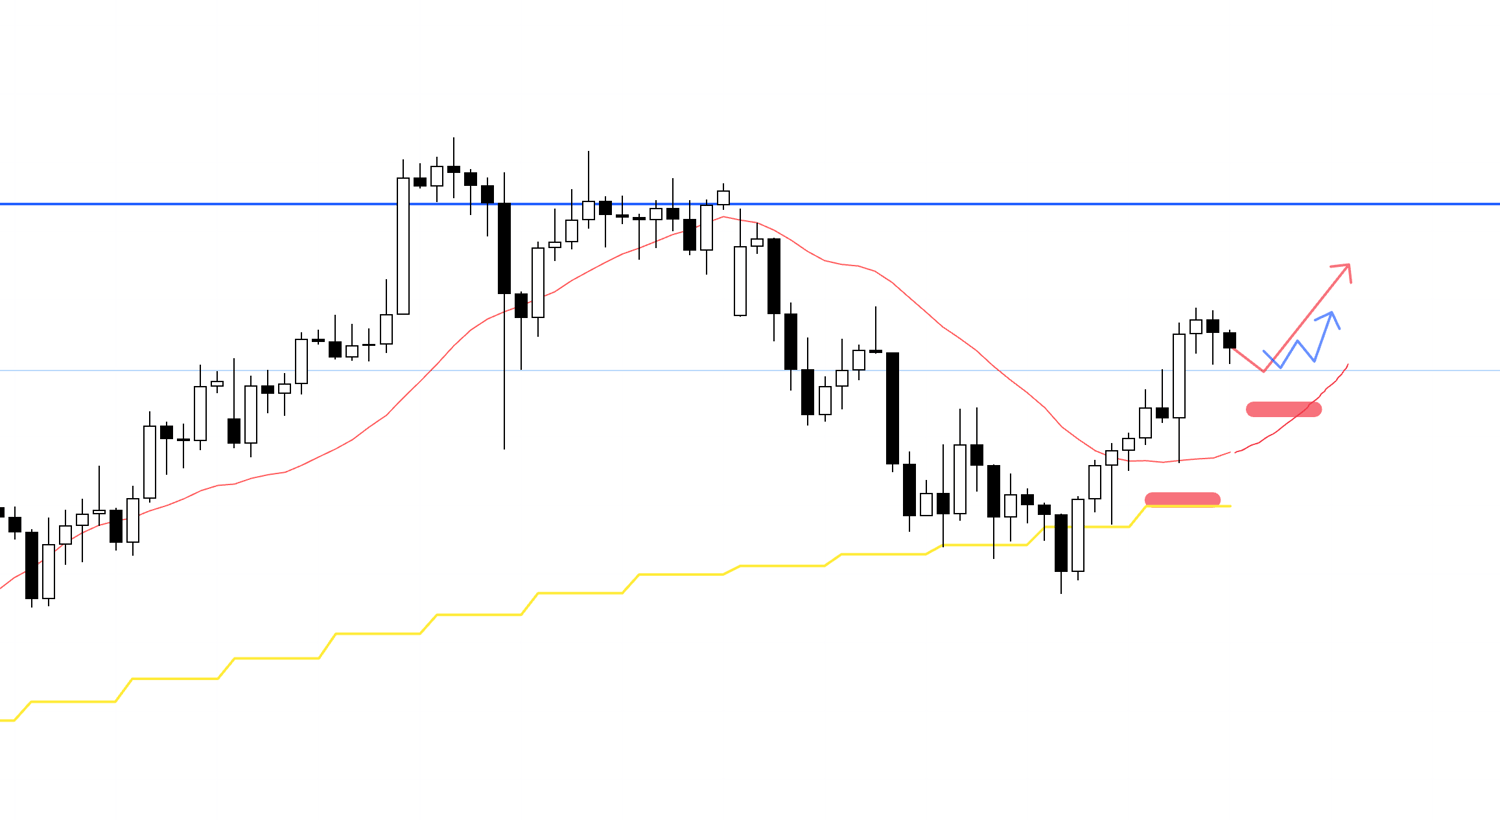
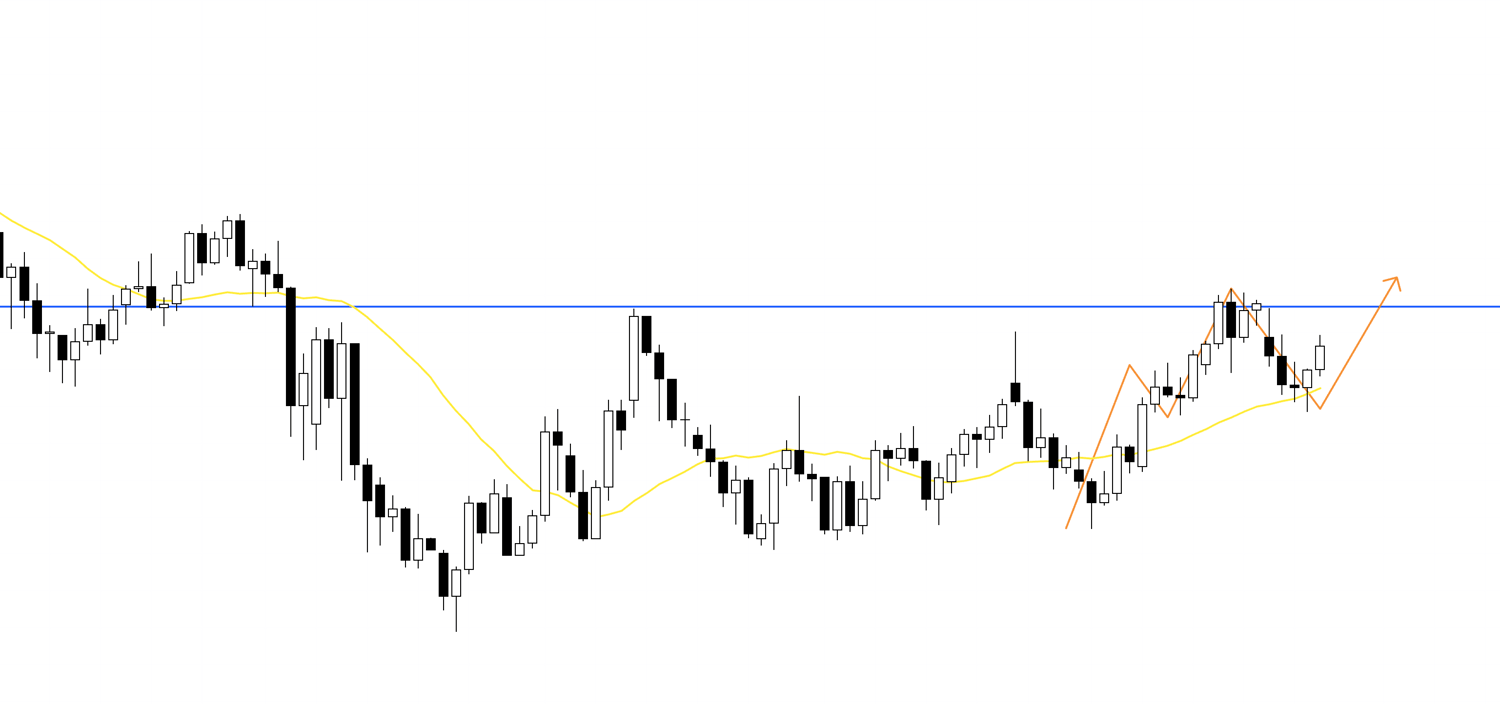
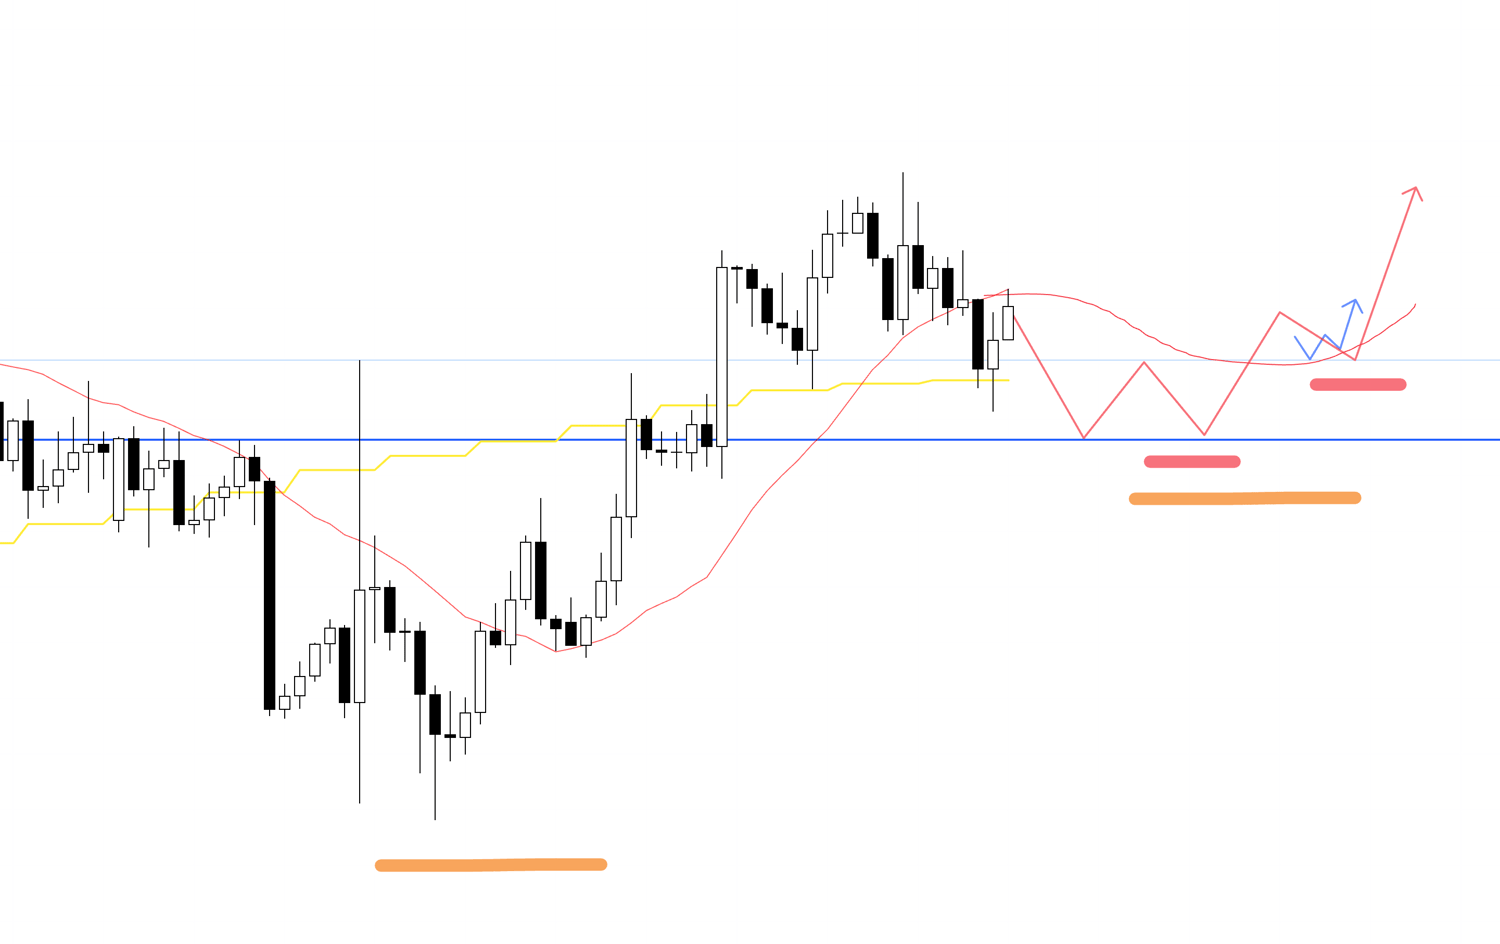
First, regarding the buy scenario, on the 4h chart, the recent downtrend has ended, and it has shifted to an uptrend.
This aligns its direction with the daily chart as a pullback buy within the daily uptrend, so I want to actively look for pullback buys on the 4h chart.
(The red arrow depicts the 4h movement, and the blue arrow depicts the 1h movement.)
However, as we've been seeing, the blue line directly above is a very significant line, so the key point is whether a trade can be made with a favorable risk/reward up to that point.
4h
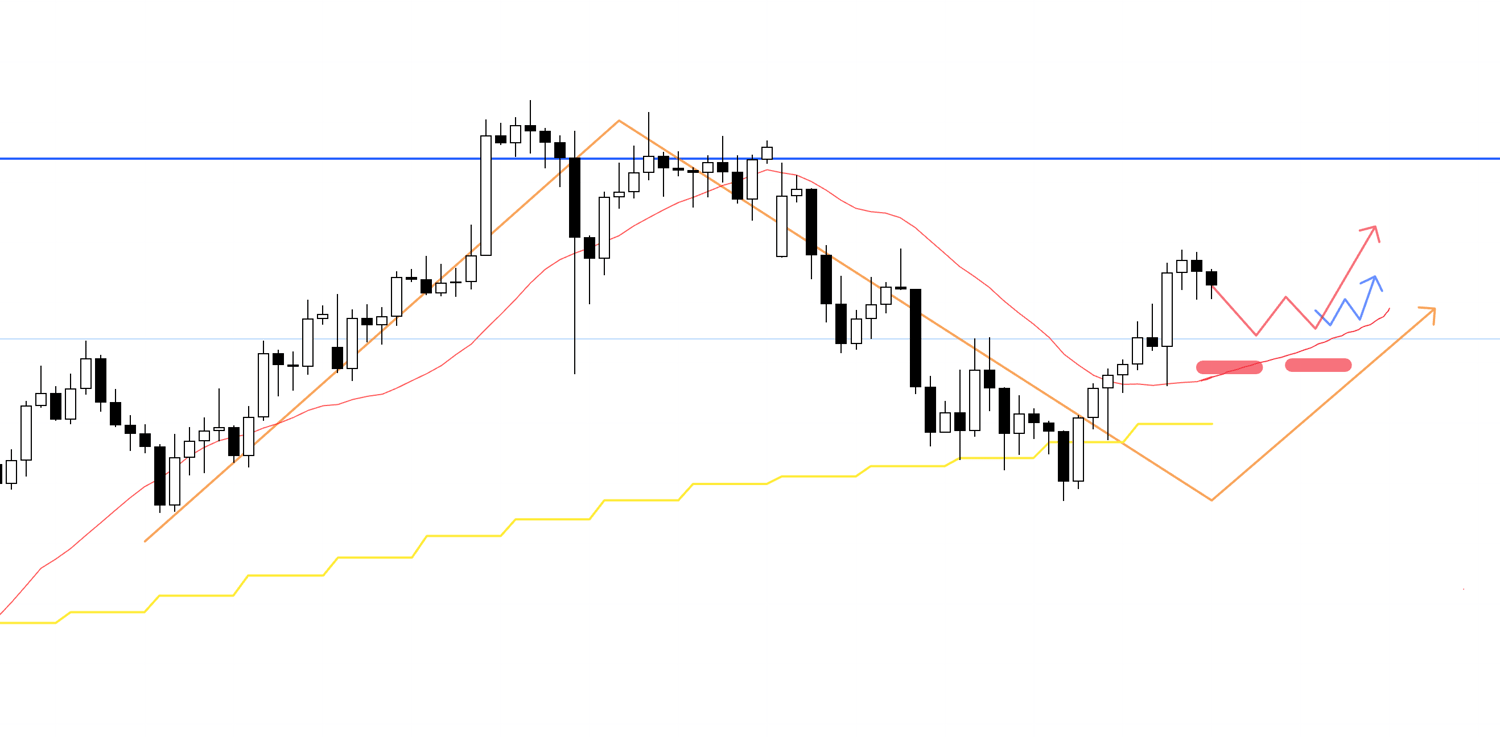
As for another buy scenario where it forms a more solid pullback, I plan to update the scenario while watching the actual price action, as it's uncertain what kind of movement will occur around here.
In any case, it means looking for a 4h pullback buy within the daily pullback buy, and considering the risk near the blue line.
On the other hand, after a solid break above the blue line, I will consider buying if it then forms a pullback that is supported by this blue line.
4h
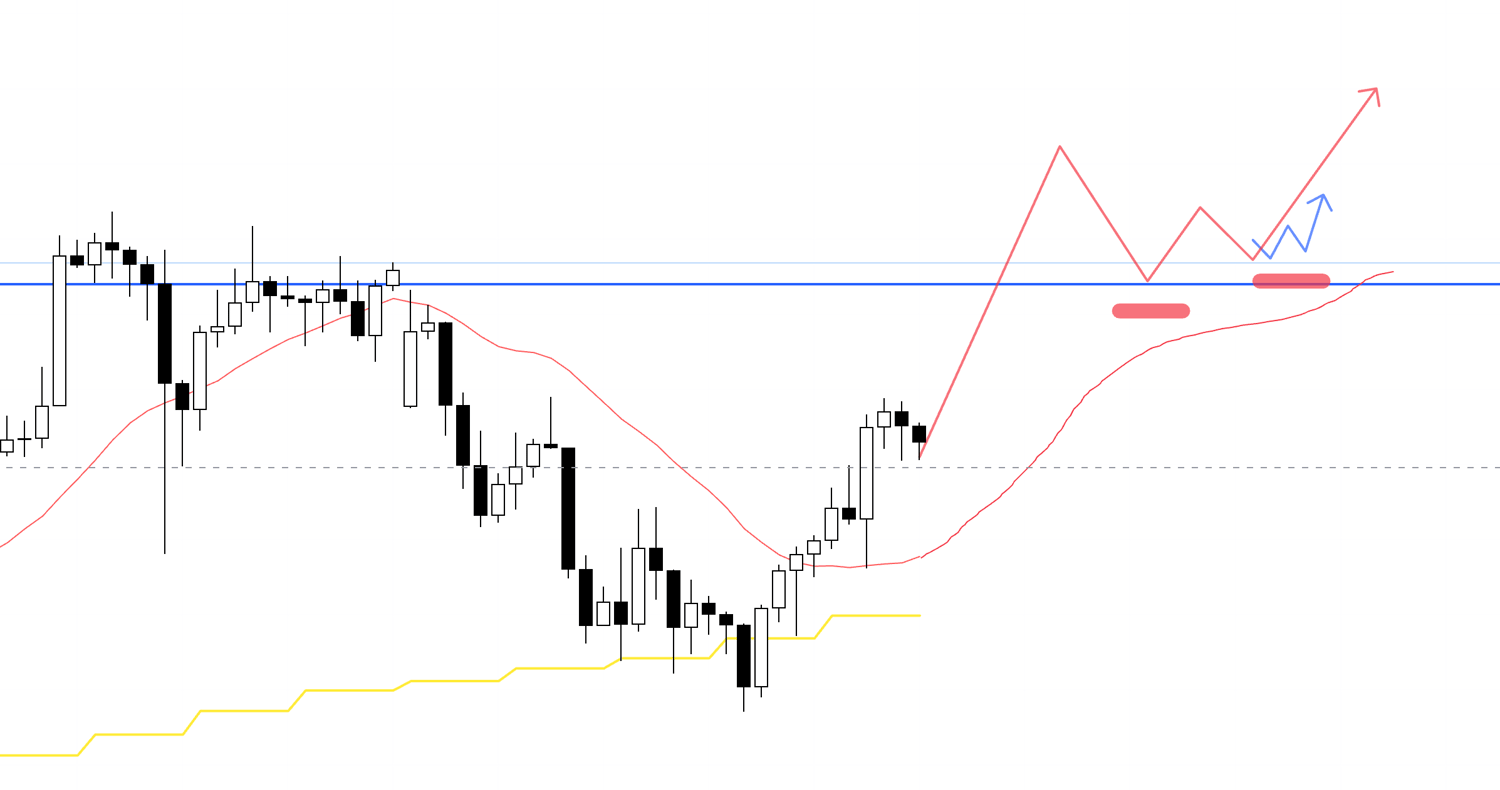
If the price breaks above the blue line once like this, and then forms a higher low point as a 4h pullback, supported by the blue line or similar structures, I will then consider buying on a lower timeframe.
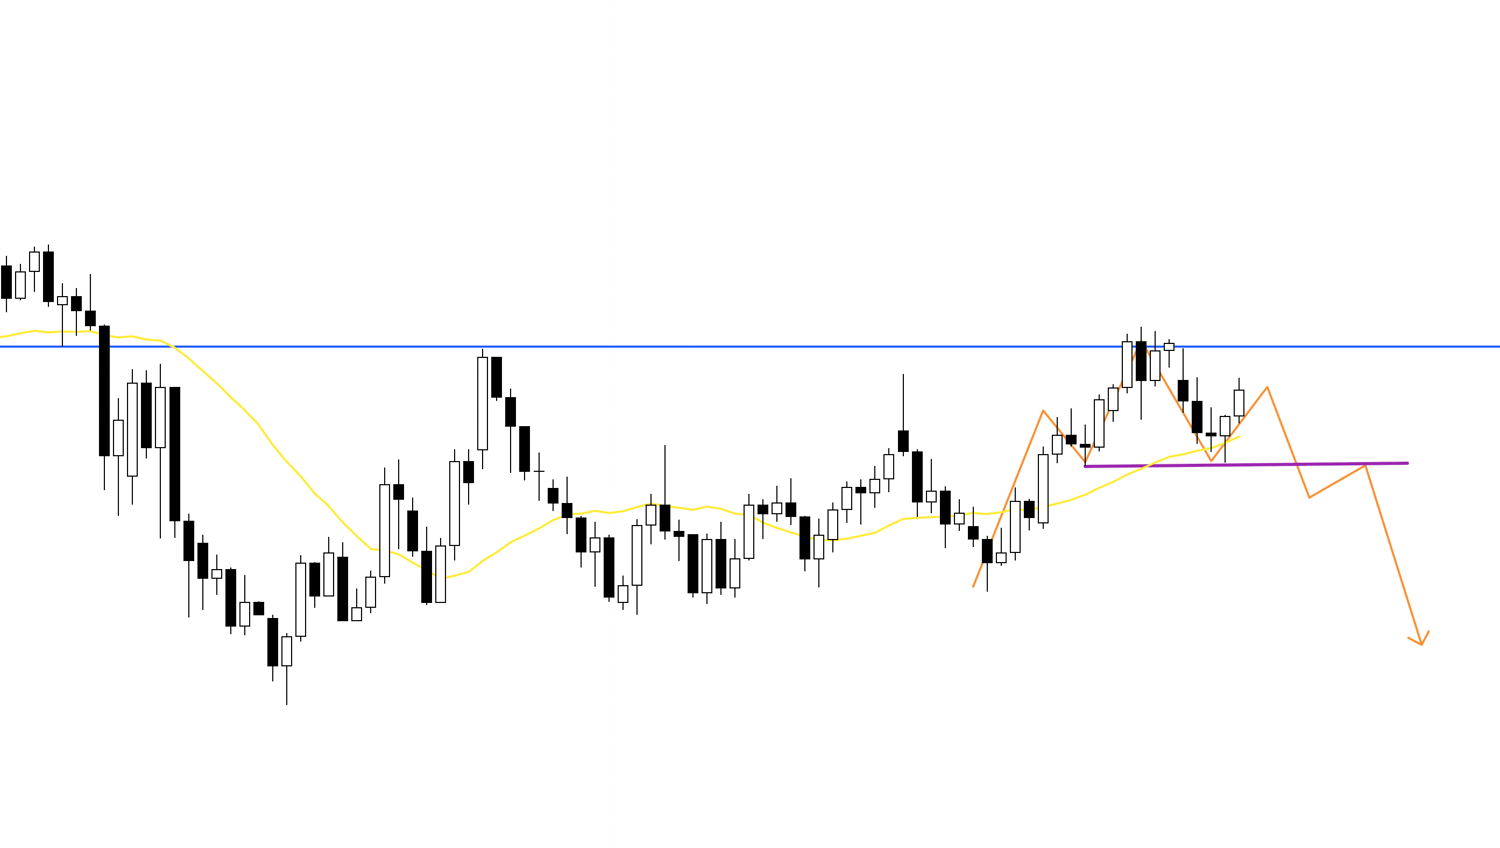
Conversely, if it fails to break above the blue line, or if it breaks above but then shows signs of being rejected again, I will also consider selling.
4h
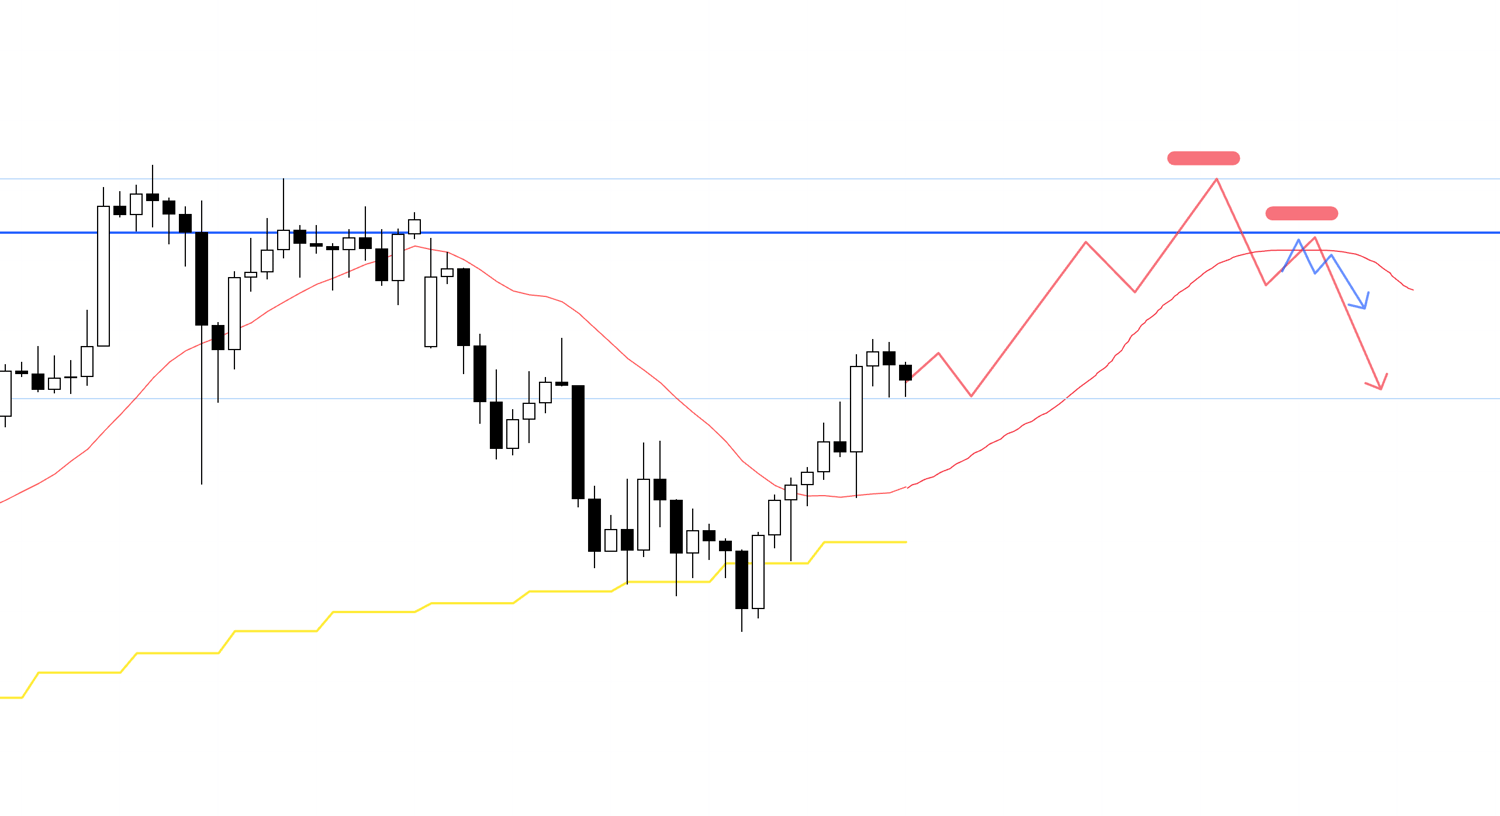
If it gives the appearance of a breakout but is then rejected by this blue line again, I will consider selling.
In this case, the further it falls, the higher the risk of pullback buys from the daily chart coming in, so the key point will be whether a trade with a viable risk/reward can be found.
I have overlaid the daily chart's movement, so please see the chart below.
4h
As you can see, the daily uptrend has not yet broken, and if the price falls, there is pullback buying pressure.
Therefore, it is necessary to construct a plan that considers this risk.
On the other hand, if it fails to break through this blue line again, it would also form a double top on the daily chart.
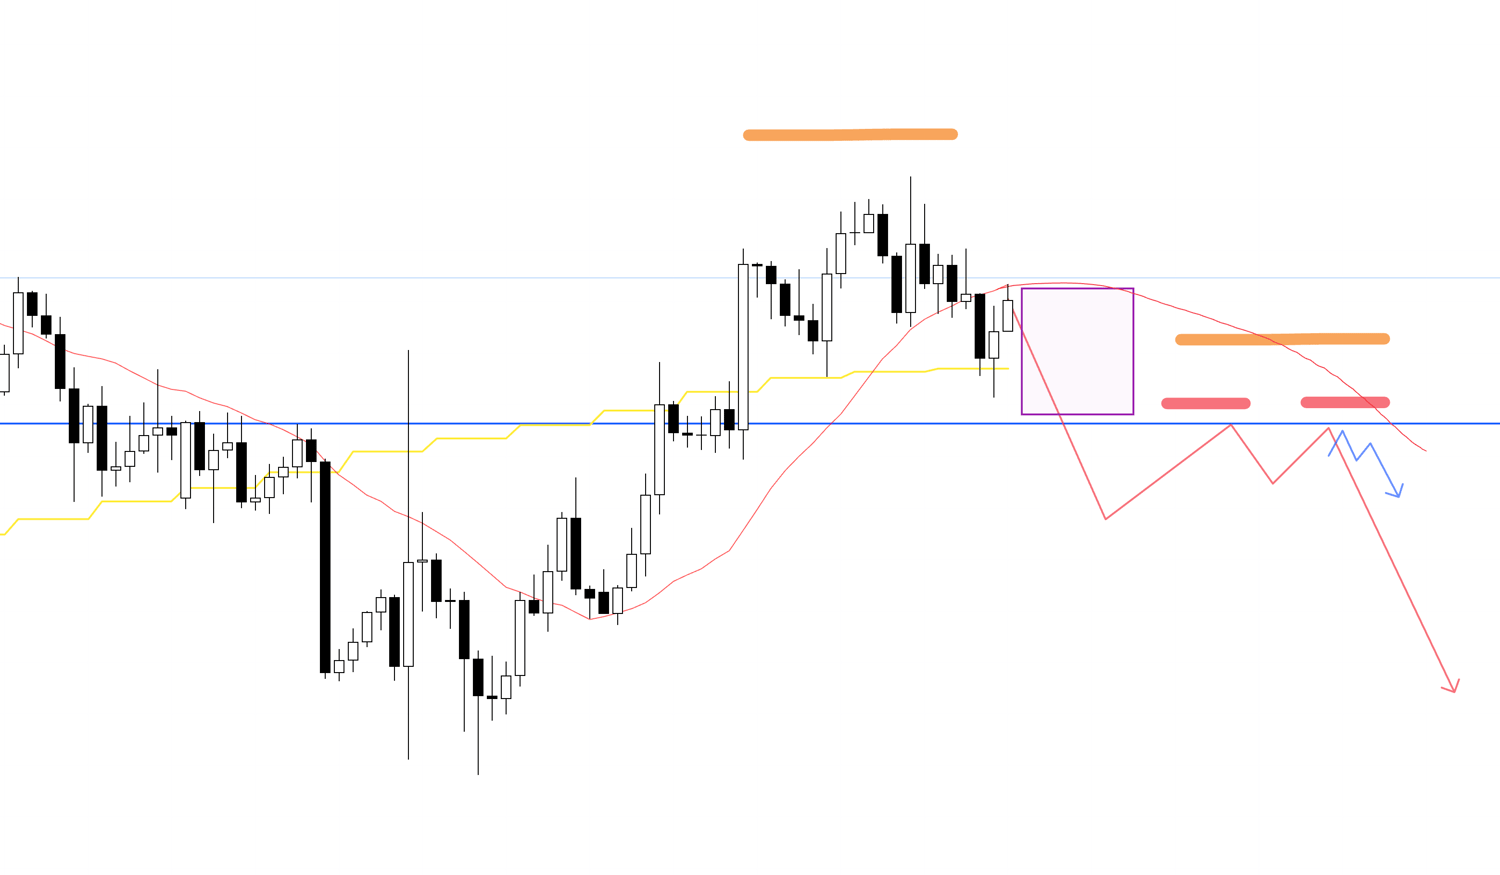
4h
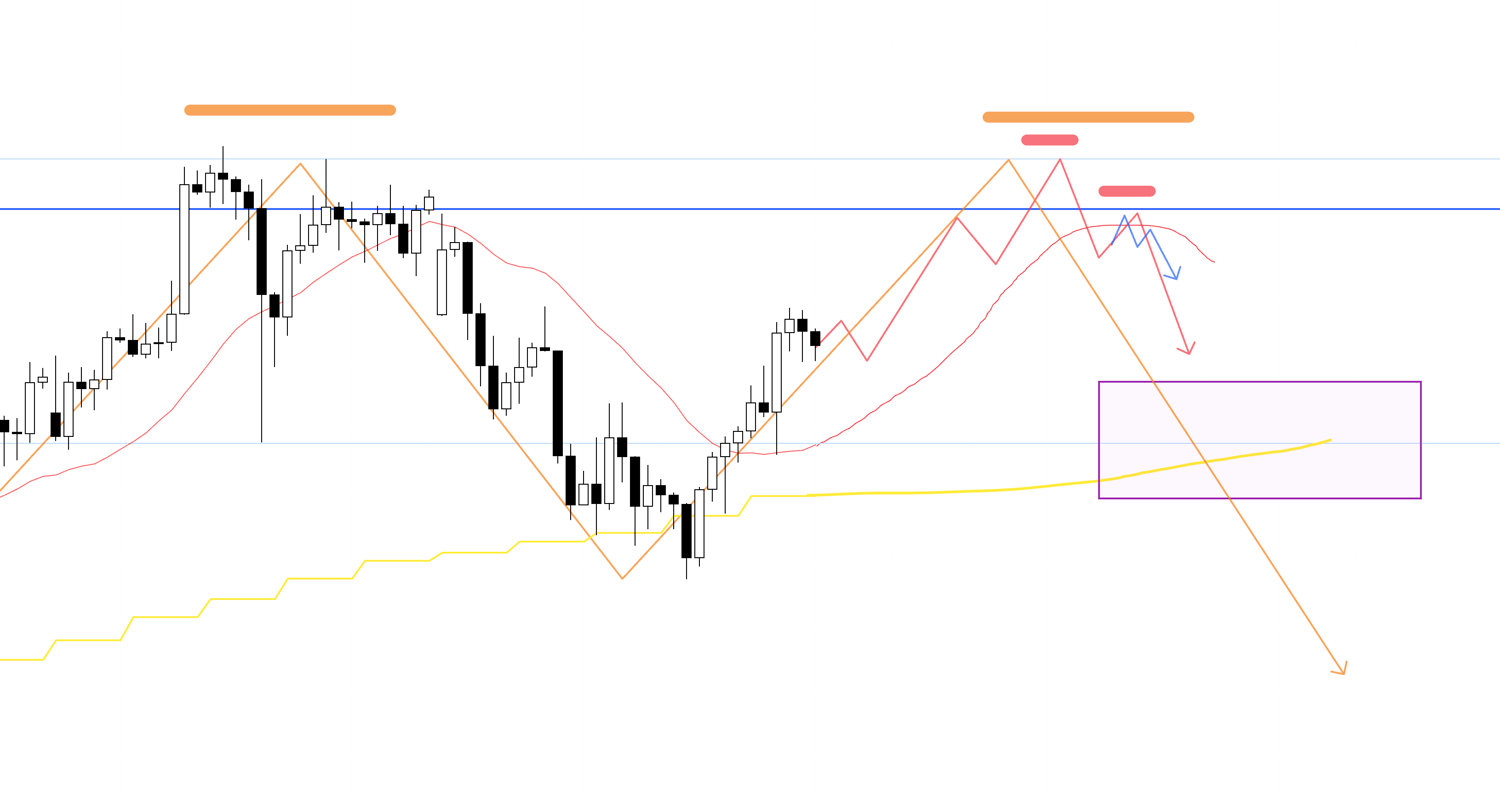
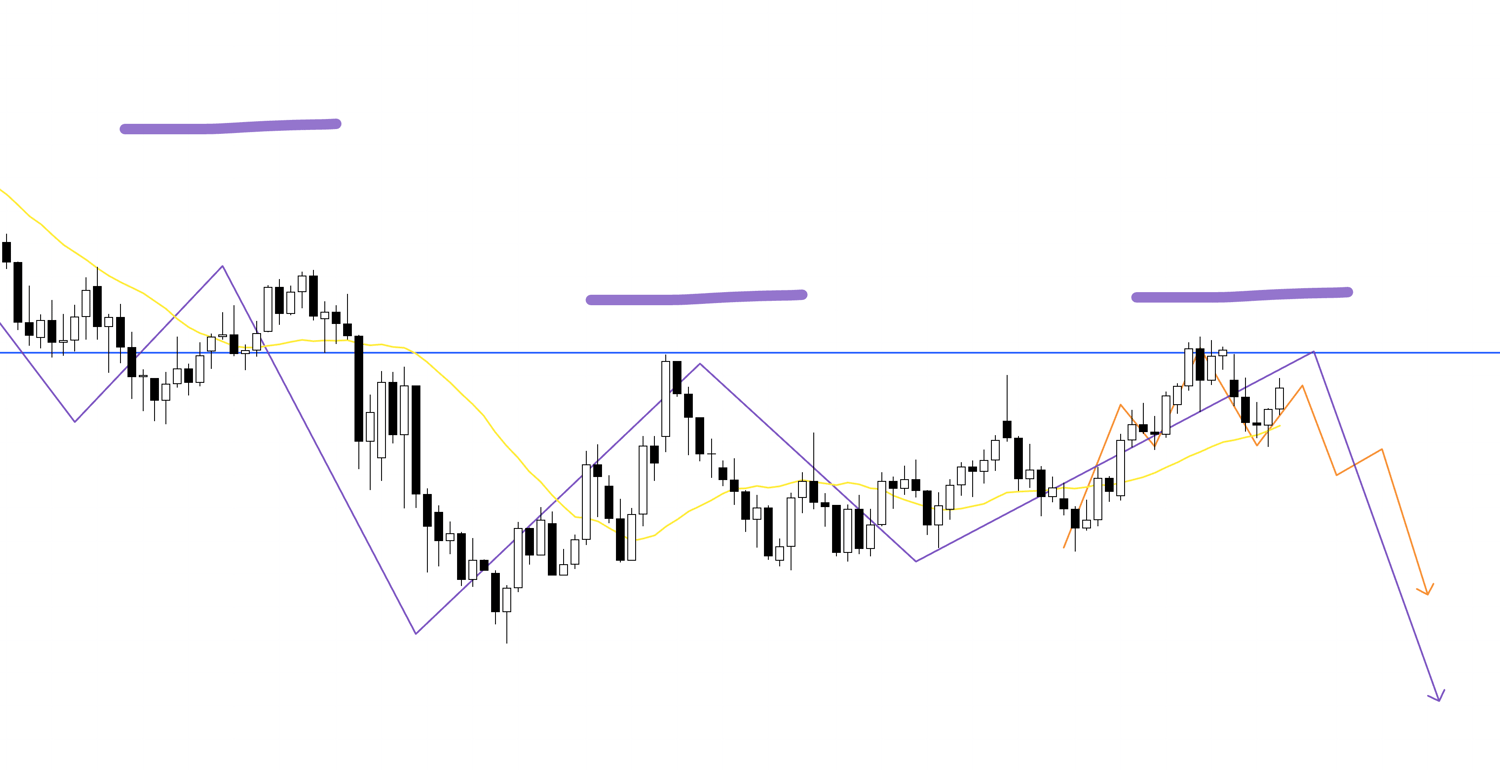
In an area caught between the forces seeing a daily double top for a weekly pullback sell and the forces seeing a daily pullback buy, orders will be conflicting, and the risk of choppy price action or getting caught in a range on lower timeframes increases, so when selling, it is important to see if you can take a position from a high point, such as near the blue line.
If the price is within the boxed area, it will be necessary to take actions such as waiting for a daily pullback sell phase where the price breaks below this area and is then rejected from above.
In areas where risks are anticipated in advance like this, it is crucial to avoid unnecessary losses.
4h
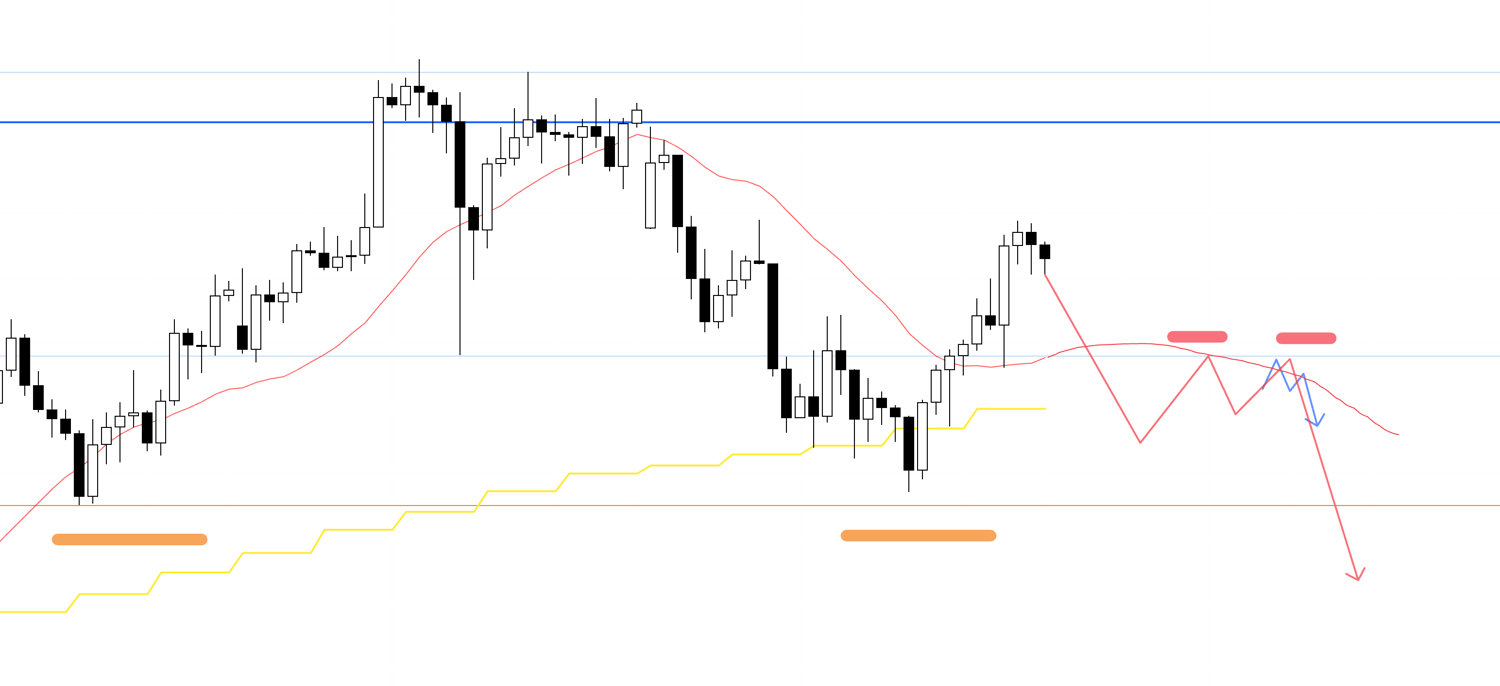
If the price were to dip below the moving average and then show a lower high as if being capped, I would consider selling, and in that case, I might adopt a style of taking half profits at the orange line drawn below, and holding the rest until the trend breaks.
I will make a judgment on that while looking at the risk/reward and other factors.
This orange line is the daily low, and currently, it is thought that the stop-loss orders of daily chart long traders are clustered just below it.
If it breaks through here, new sell orders are likely to enter, and it would also trigger the stop-losses of long traders (=sell orders), increasing the possibility of another leg down, so it would be ideal to be able to follow that decline with limited risk by getting a position at a good time.
That depends on the market, so I will update the scenarios while watching the actual price action.
〜・〜・〜・〜・〜・〜・〜・〜・〜・〜・〜・〜・〜・〜・
EURUSD
Next, let's look at EURUSD.
4h
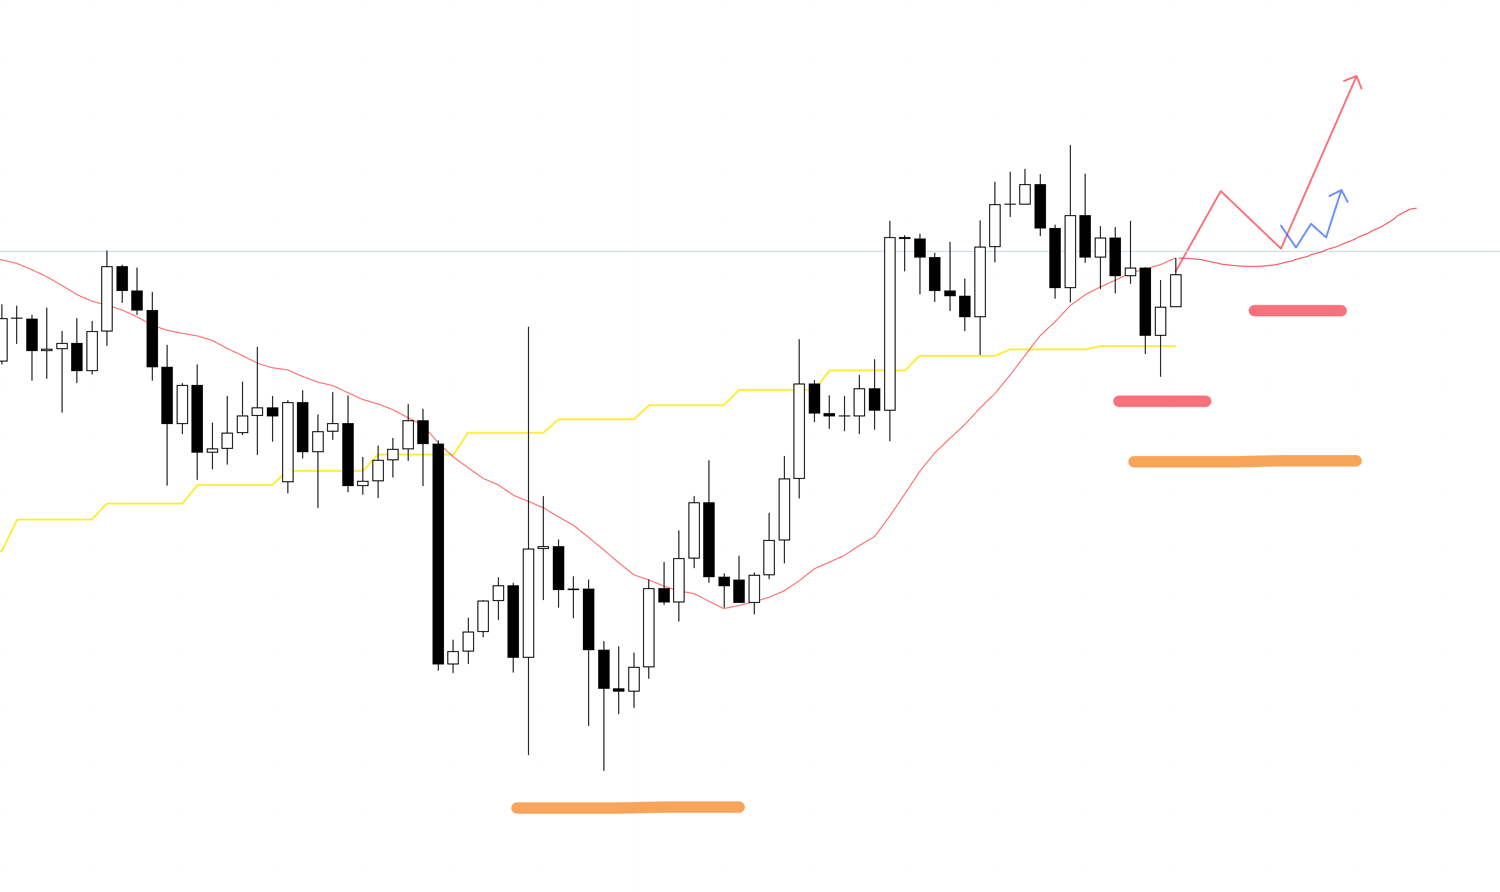
Currently on the 4h chart, the price has broken the low, so I cannot buy immediately.
If it first forms a higher low point like this, I will consider buying on a lower timeframe.
In this case, it would be a 4h pullback buy as part of a daily pullback buy, which would be a point with a high edge.
4h
Alternatively, if it ends the preceding downtrend and shows a form of being supported by the blue line and also by the moving average, I will consider buying on a lower timeframe.
In this case as well, it will be a point with a high edge where the 4h chart aligns with the direction of the daily chart as a pullback buy.
Next, let's consider a sell scenario.
4h
For selling, I recognize that the area enclosed by the square has the risk of pullback buying pressure from the daily chart, and I do not want to place a sell trade within this area.
Therefore, I will consider selling if the price first breaks below the blue line and then shows a form of being capped from above again.
At that time, if it forms a lower high on the daily chart and is also being capped by the moving average or similar structures, I will consider selling.
〜・〜・〜・〜・〜・〜・〜・〜・〜・〜・〜・〜・〜・〜・
That is all.
These are the scenarios as of this moment, and I plan to update and build upon them as needed while watching the price action once the week begins.
By using multi-timeframe analysis to understand in advance whether traders on each timeframe want to buy or sell right now, and which timeframe's traders have not yet closed their positions, and then building scenarios, it becomes possible to trade with anticipated risks.
And it is precisely because we create scenarios in advance that we traders are able to "wait".
If you establish in advance a scenario of what needs to happen for a high-edge situation to appear and what needs to happen to be able to enter, you will not hesitate, get confused, or have regrets.
It is extremely important to simply keep repeating a consistent process.
I hope this serves as a reference.
This is strictly my trade plan, so if you are someone whose trading method is not yet established, I think it would be fine to use this as a reference for building your own strategy, but for those who already have a solid trading style, please do not be swayed by my trade plan and stick thoroughly to your own rules.
Thank you for reading to the end.