


I will review the key points of the trades, focusing on the ones I took this week.
I will be posting this "Weekly Trade Report" every Saturday.
If you read it along with the "Trade Scenario" posted every Sunday, I believe you can see how I think in advance and how I actually execute trades based on that scenario.
This is not advice like "you should trade this way," nor am I suggesting this is the correct answer.
It is merely one of my personal results, intended to show you at a practical level how I repeat a consistent process based on my pre-defined scenarios, to serve as a reference for your own strategy development and process consistency.
Please conduct your own thorough testing and preparation for your own trading, and do so at your own risk.
Now, please look at the following chart.
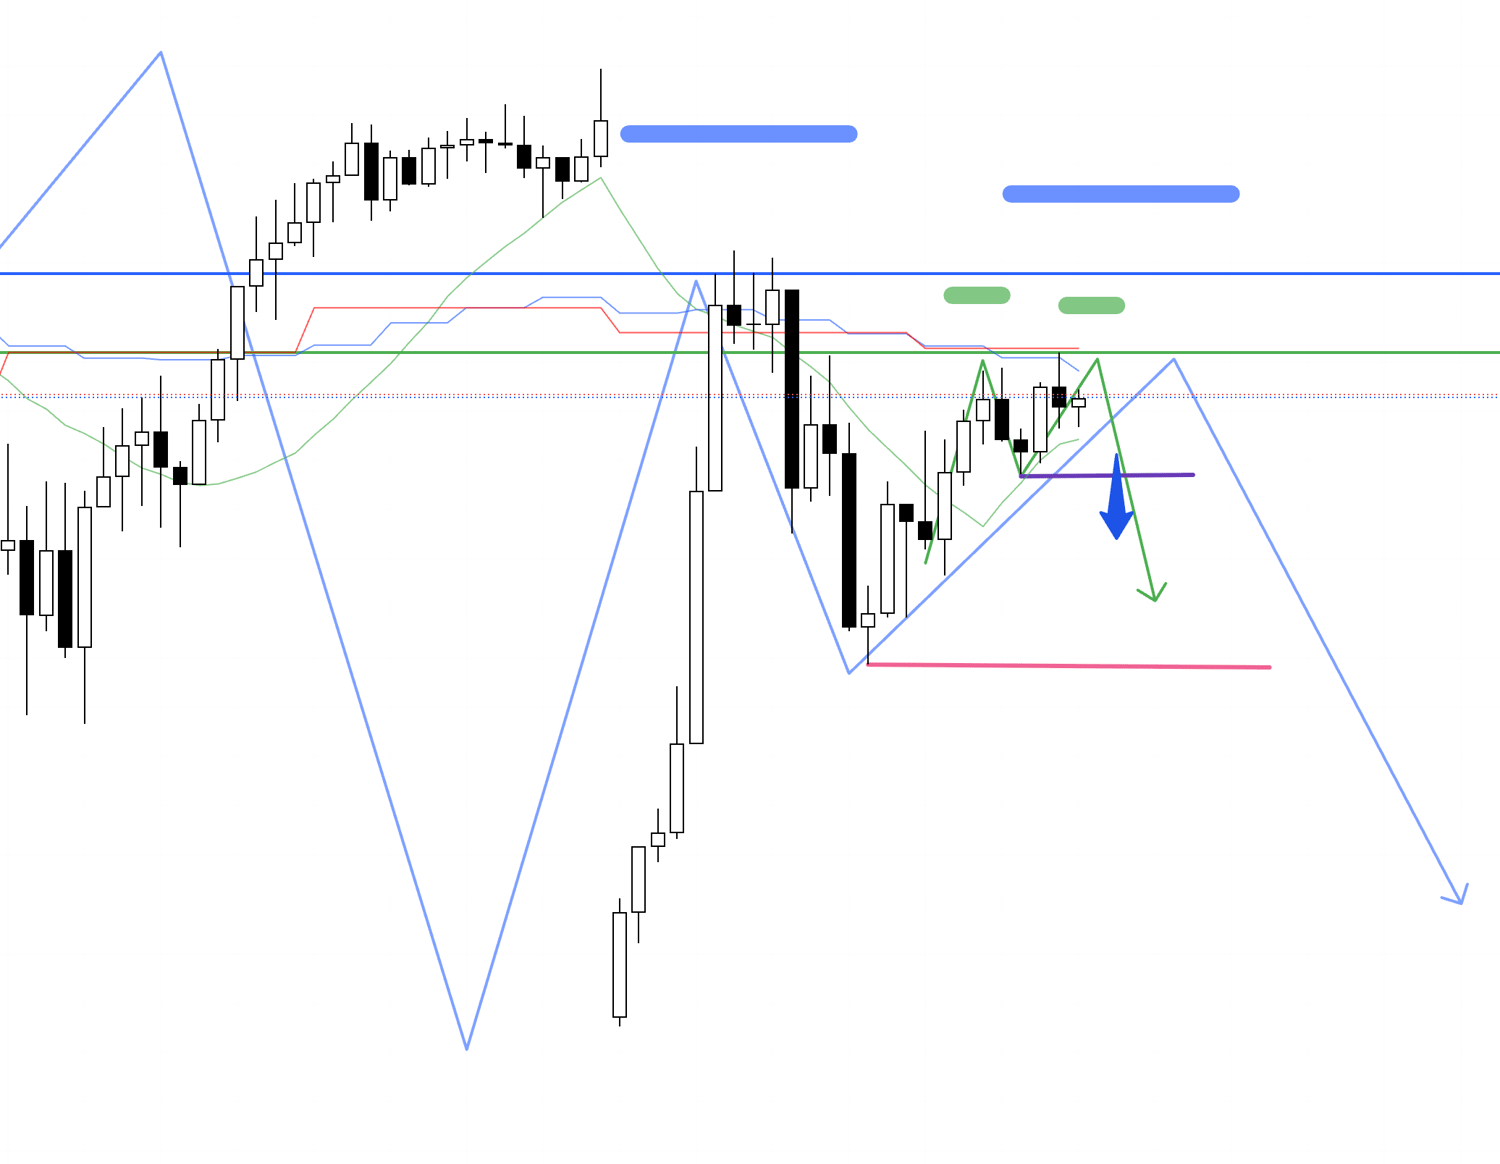
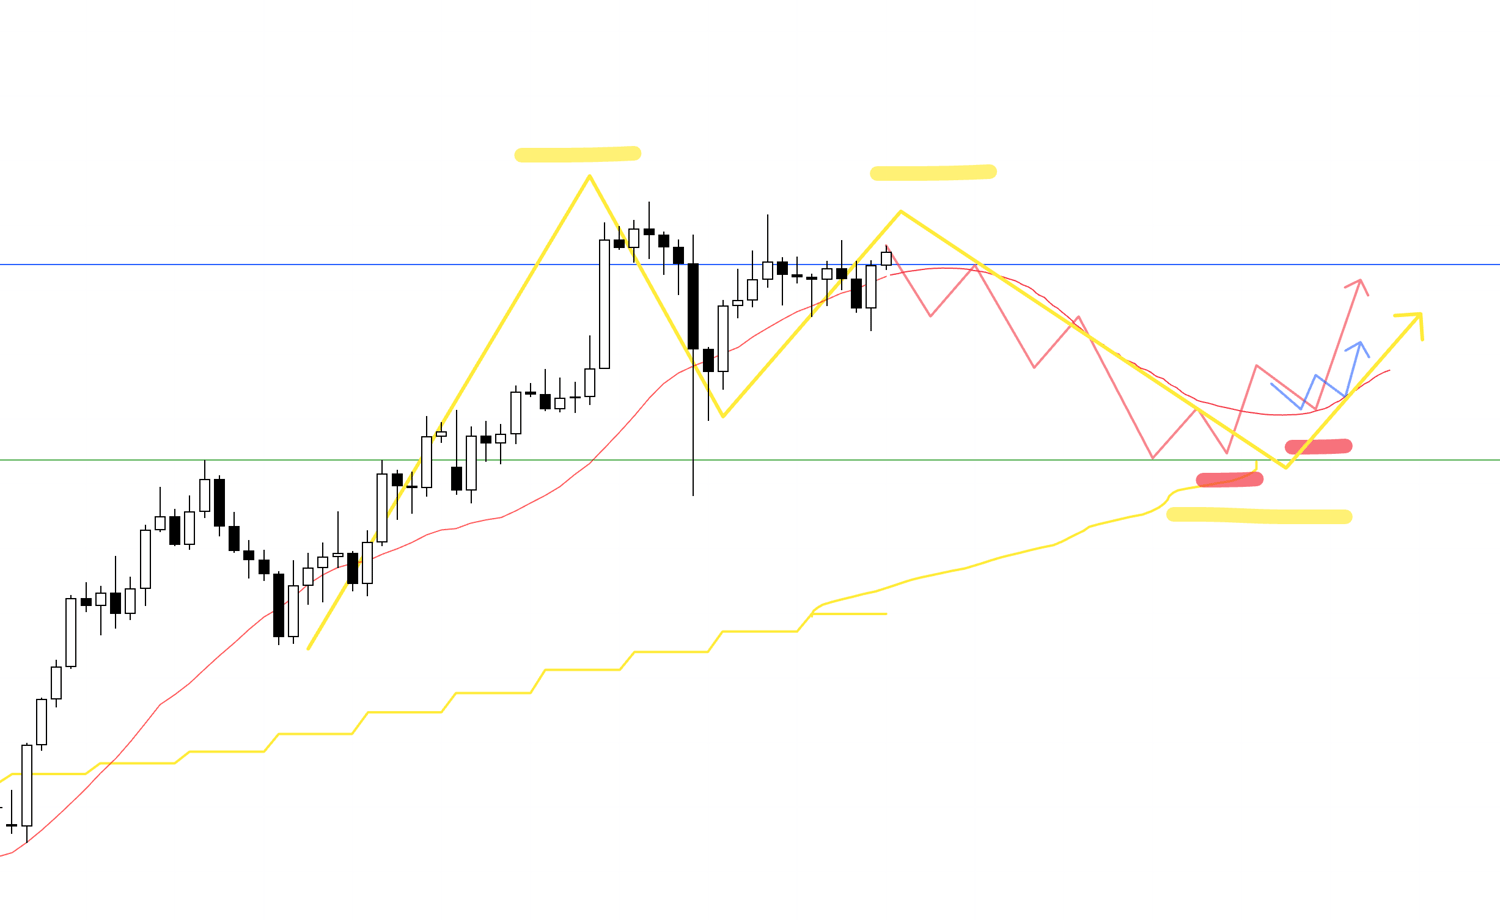
USDJPY 4h Chart

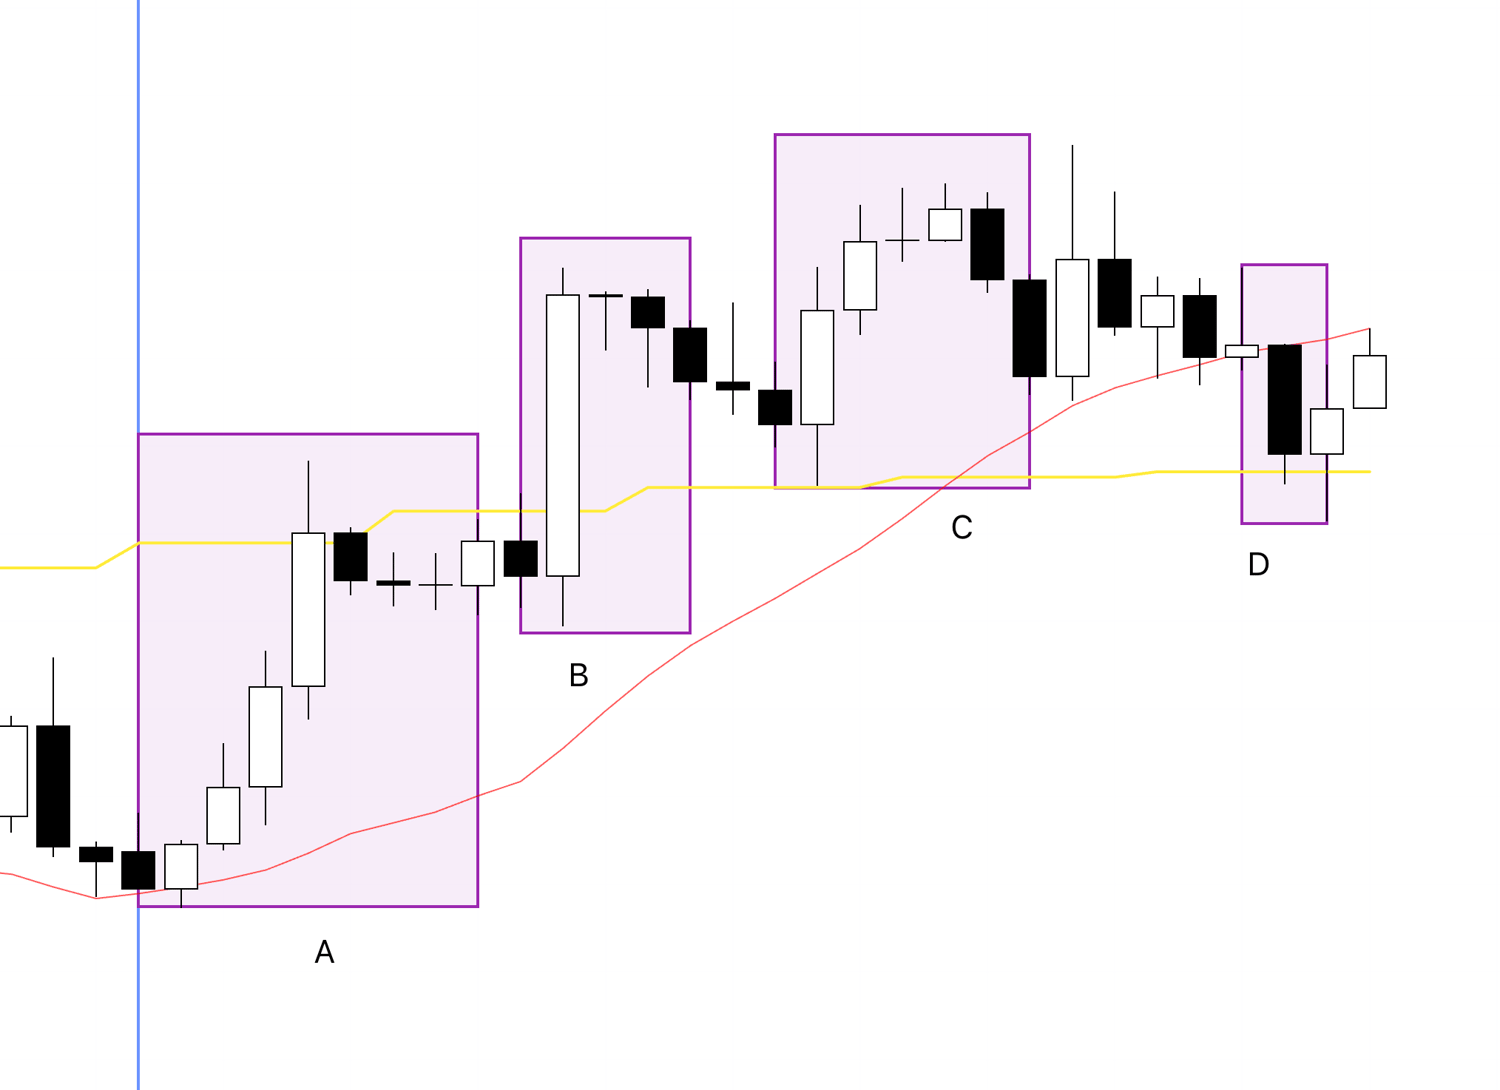
This is the 4h chart for USDJPY.
The week started from the position of the blue vertical line.
My trading strategy is to execute pullback buys and pullback sells on the 4h chart.
I time these 4h pullback buys and sells on lower timeframes (1h/15m) to trade.
For more information on Dow Theory and Multi-Timeframe Analysis, which are the foundations of these strategies, please refer to my previous blog posts.
This week, there were four points for 4h pullback buys or sells, as indicated on the chart.
The trade I actually took was at point A.
Later, I will explain the trade at A and why I did not take trades at the other three points.
Next, please look at the following EURUSD chart.
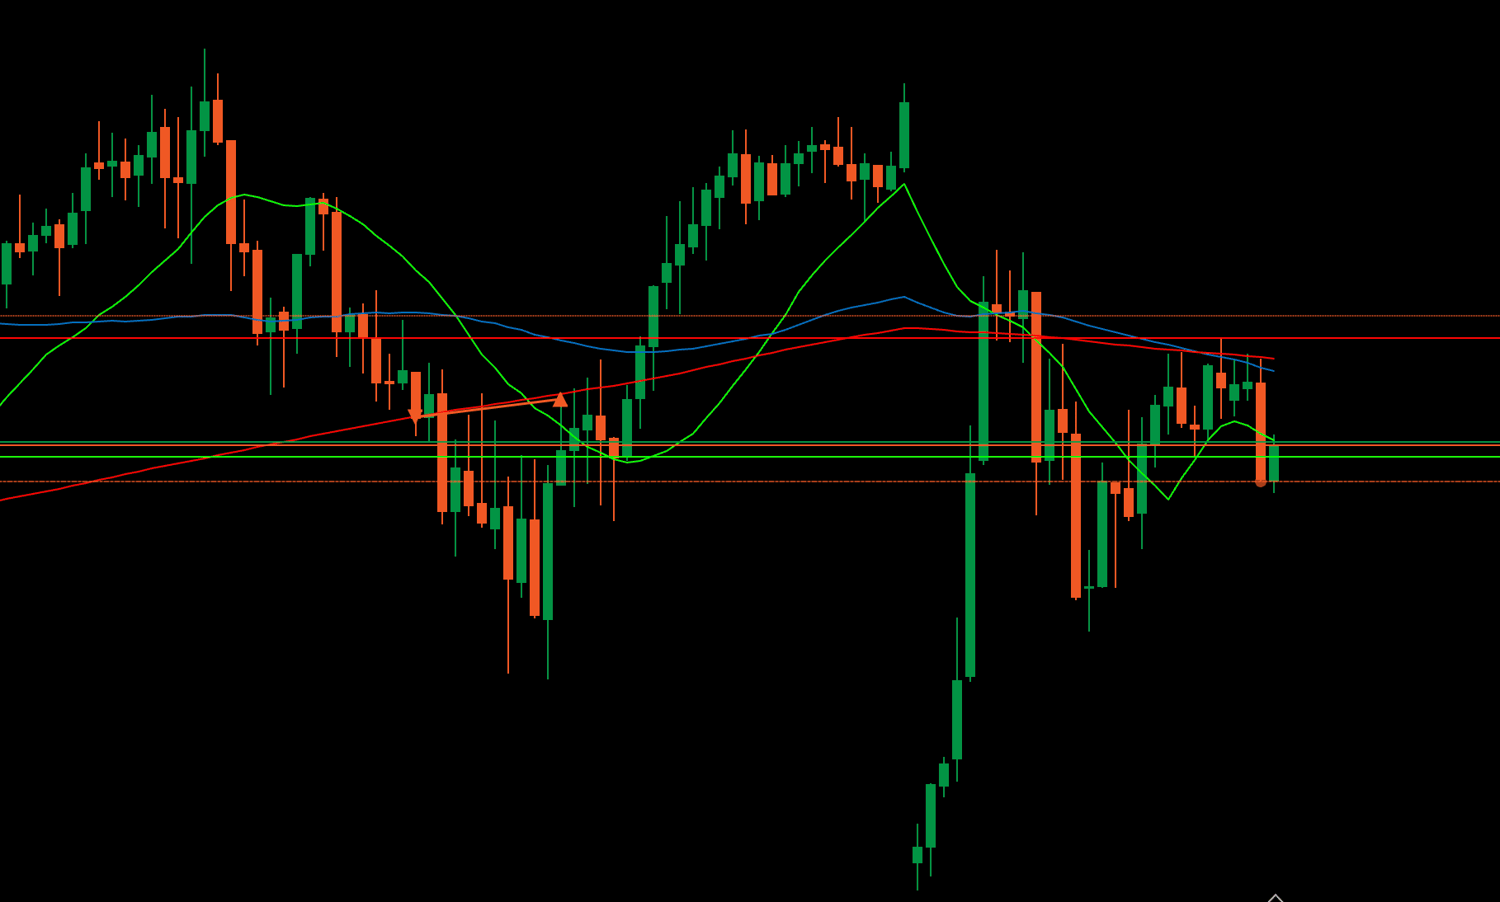
EURUSD 4h Chart
This is the 4h chart for EURUSD.
Here too, there were four points for 4h pullback buys and sells this week.
I did not trade EURUSD at all this week.
However, I think it will be helpful to explain my judgment on these four points, so I will do so later.
First, let's look at point A on the USDJPY chart, where I actually traded.
I recorded my thoughts while taking screenshots in real-time as I watched this chart, so please take a look at that first.
〜・〜・〜・〜・〜・〜・〜・〜・〜・〜・〜・〜・〜・〜・
July 21st (Monday) USDJPY
The sell scenario I was watching for in the Sunday scenario has appeared, so I have just placed a sell stop order.
If I get entered after this, I would like to follow the trend.
4h Chart
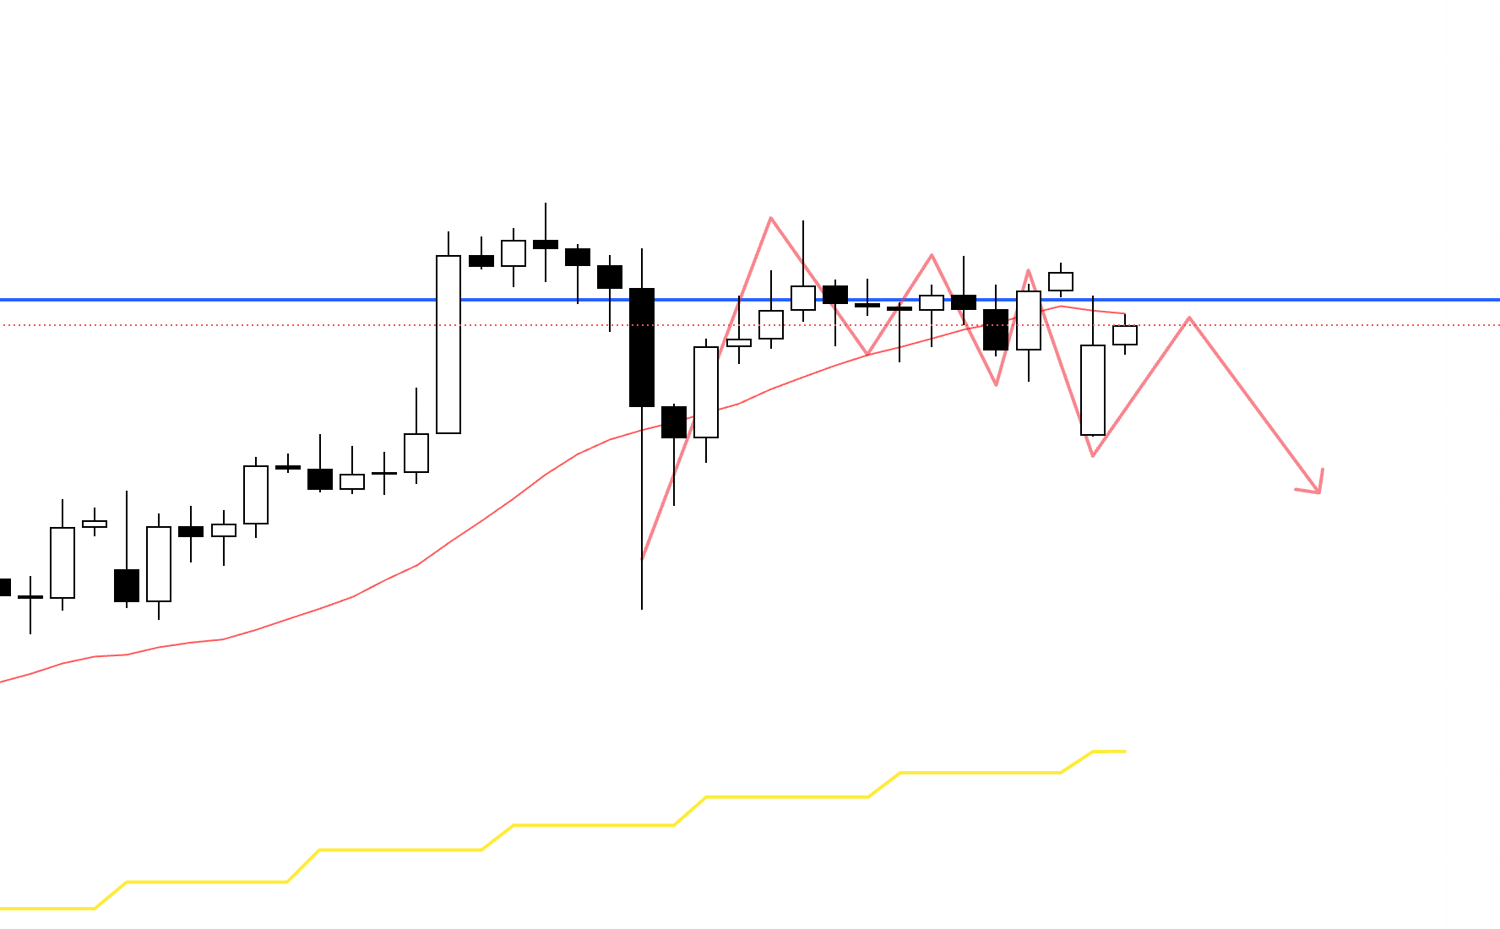
On the 4h chart, the price has broken the most recent low and is attempting to form a lower high at this blue line drawn from the weekly chart.
Now let's look at this on the 1h chart.
1h Chart
Looking at the 1h chart, you can see that within the 4h's lower high formation area, the 1h is also trying to form a point for a lower high.
Let's look at this on the 15m chart.
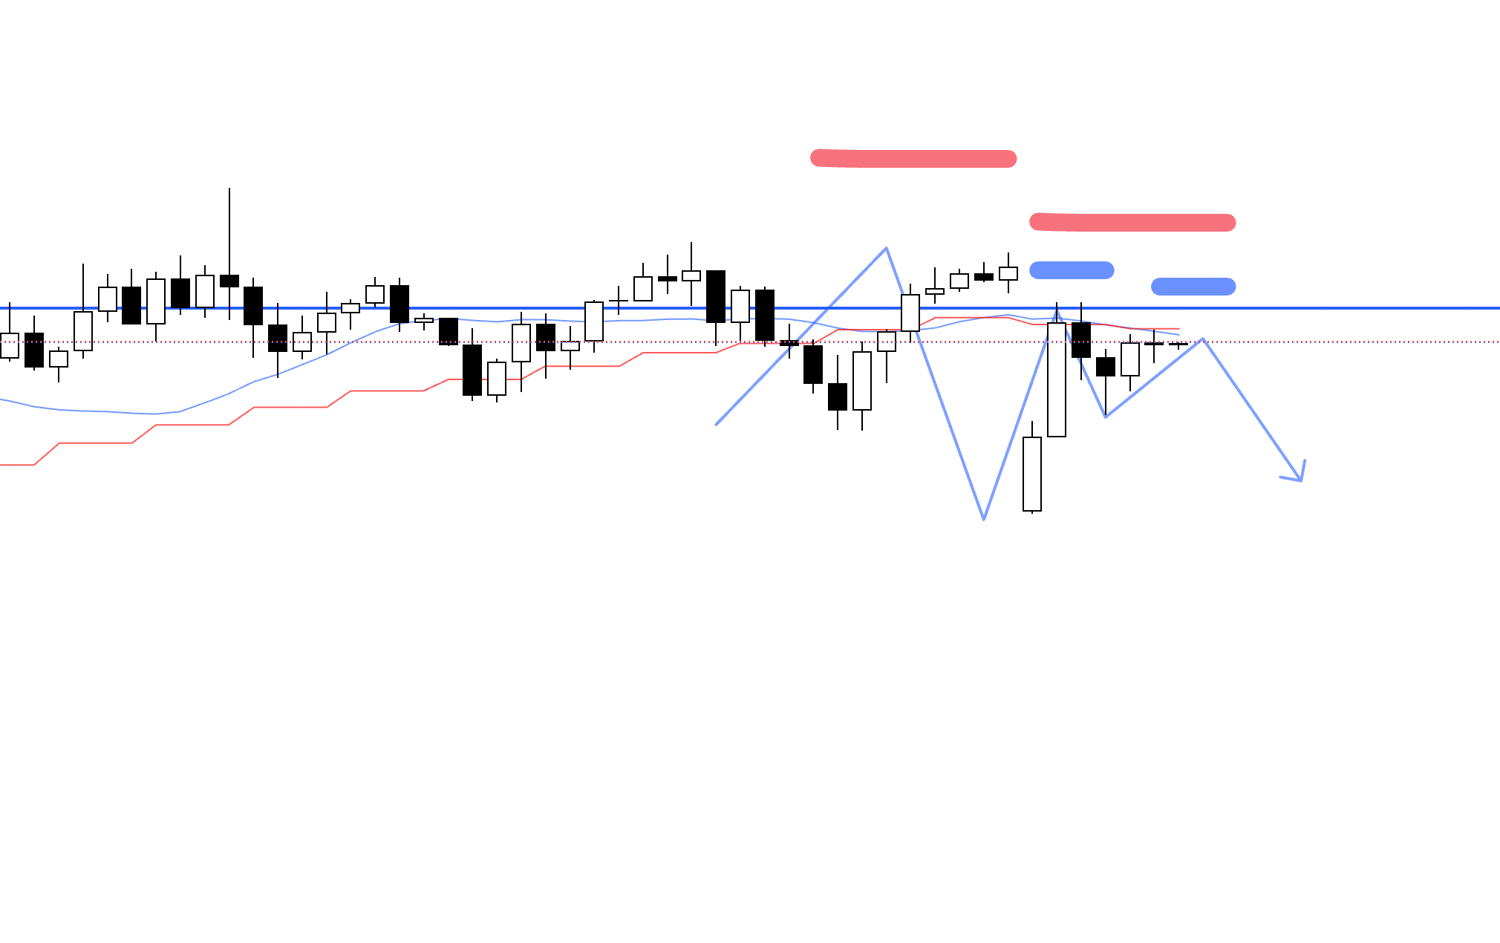
15m Chart
On the 15m chart, it looks like it's forming a double top at the green line that seems to have been effective before, and if it breaks the low, I want to enter from that breakout point.
However, at this point, it has not yet confirmed a new low on the 1h chart.
The key will be whether a downtrend starts on the 15m, confirms a 1h downtrend, and leads to another push down.
15m Chart
The pink line I've drawn is the low that will confirm the 1h downtrend.
Since I can enter a step earlier on the 15m chart, if this leads to a 1h downtrend, it will result in a trade with a good risk/reward.
It is very important to trade at points where orders are concentrated and have a cascading effect like this.
15m Chart
My order was just filled and I've entered the trade.
This is the chart from cTrader where I am actually trading.
From here, as always, I plan to follow the trend until it breaks.
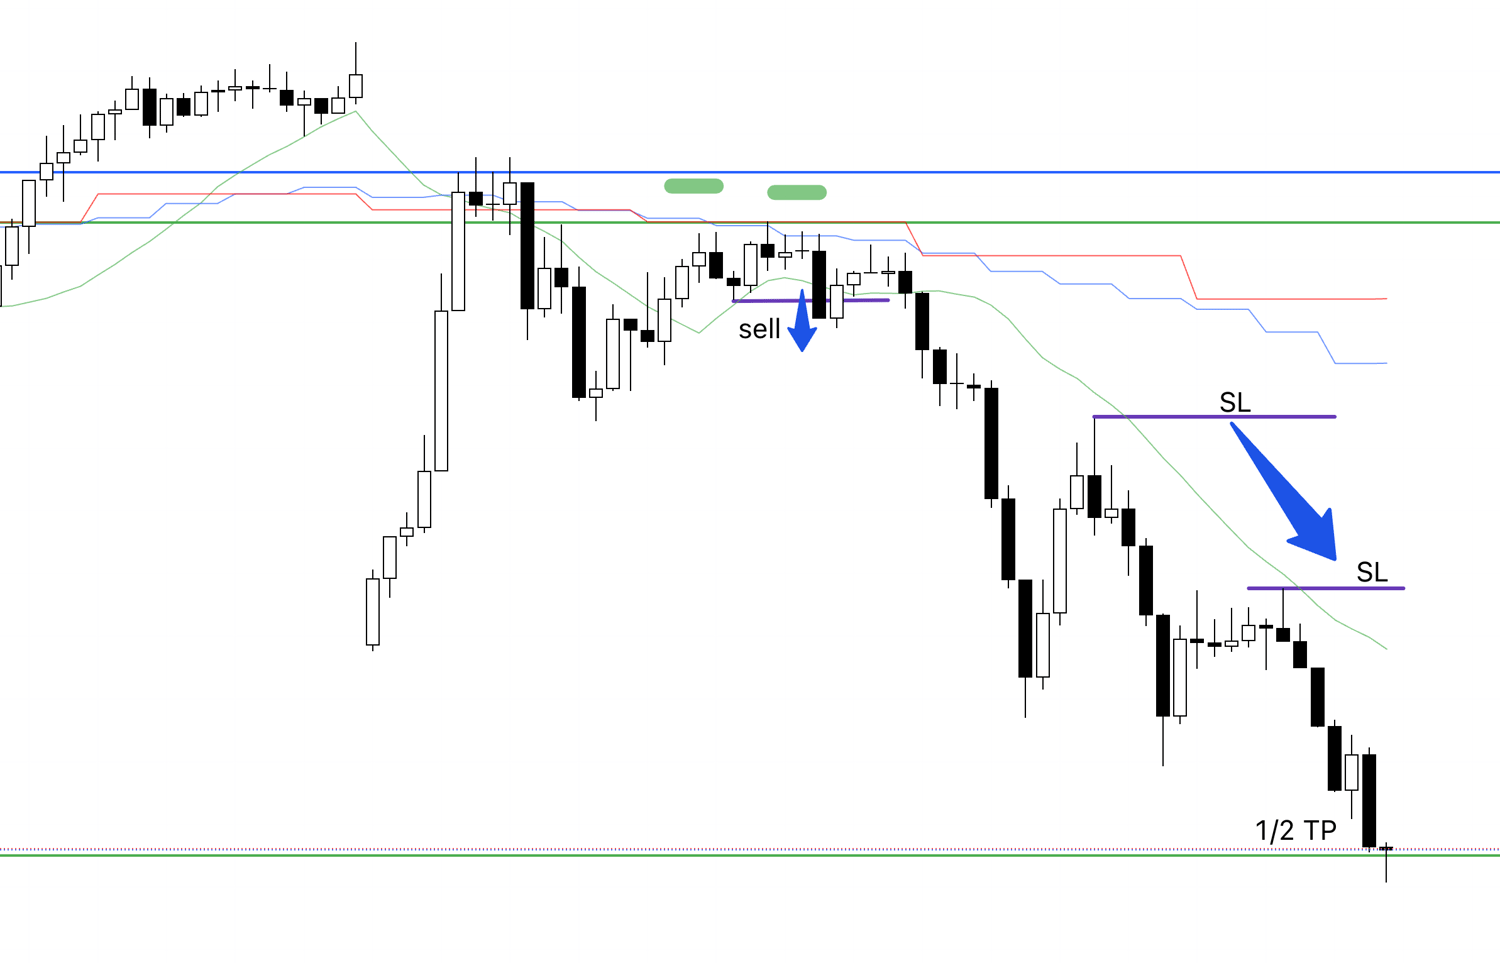
15m Chart
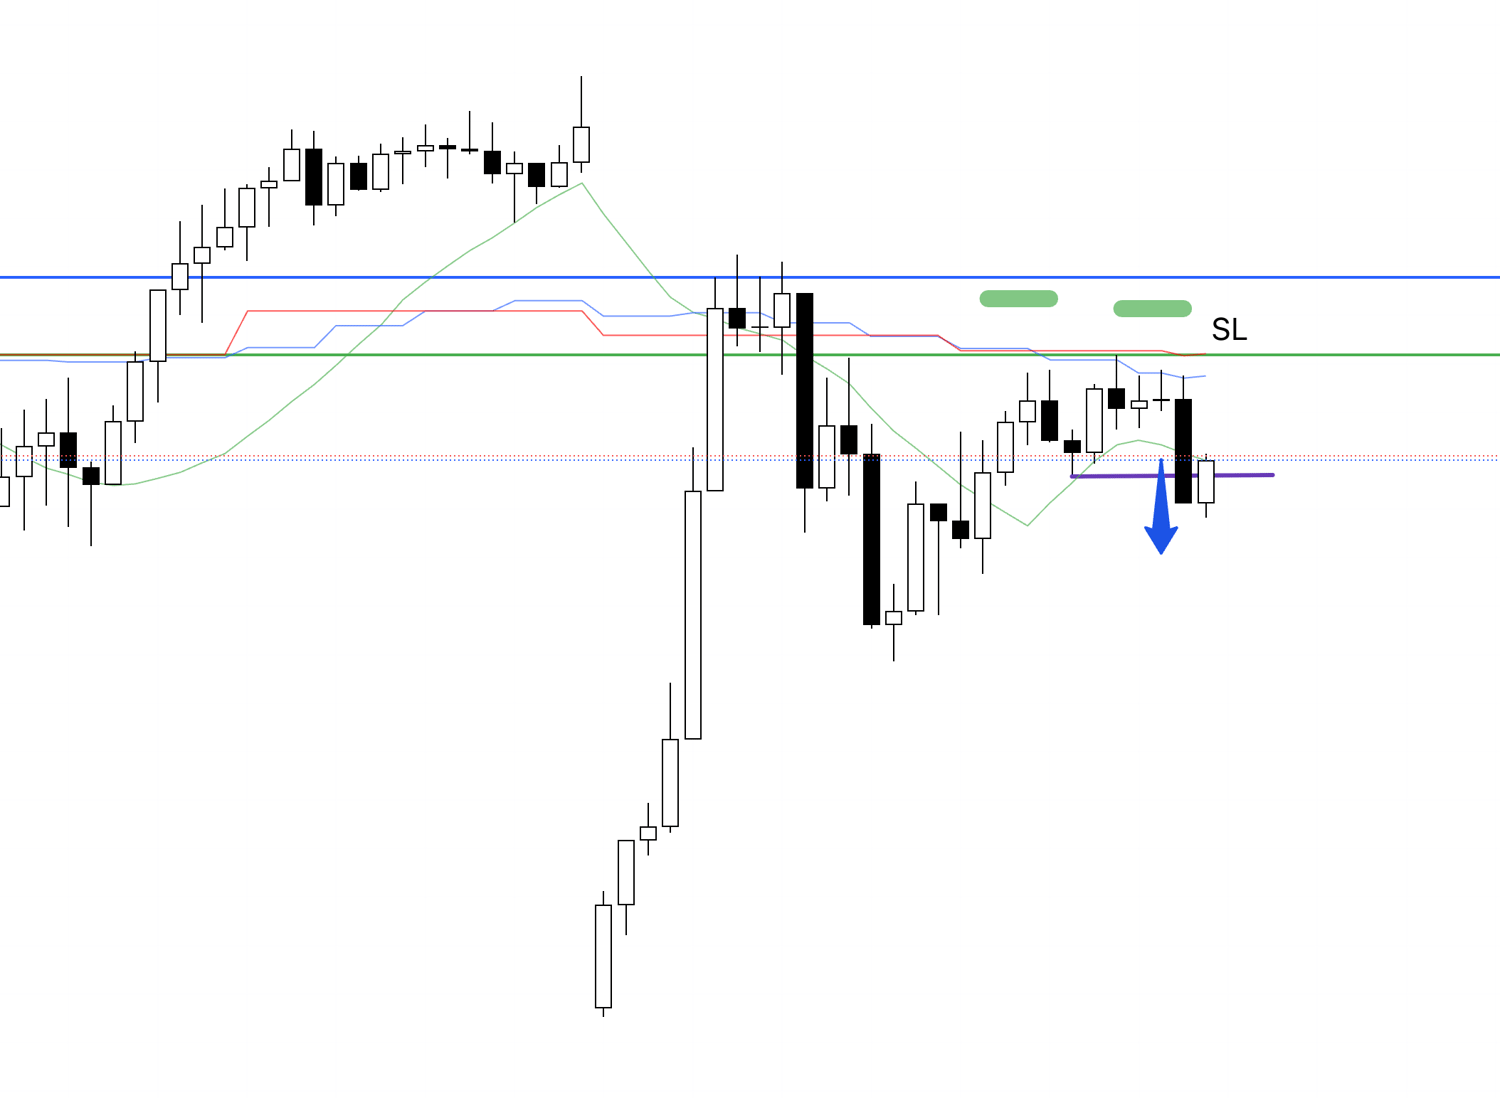
The SL is set slightly above the high that was rejected by the green line.
15m Chart
It made a new low and then a lower high, so I moved my SL down to the newly formed high.
The key point now is whether it can break below the 1h low.
15m Chart
It successfully broke below the 1h low.
I moved the SL down another step.
I will continue to hold this position until the trend breaks.
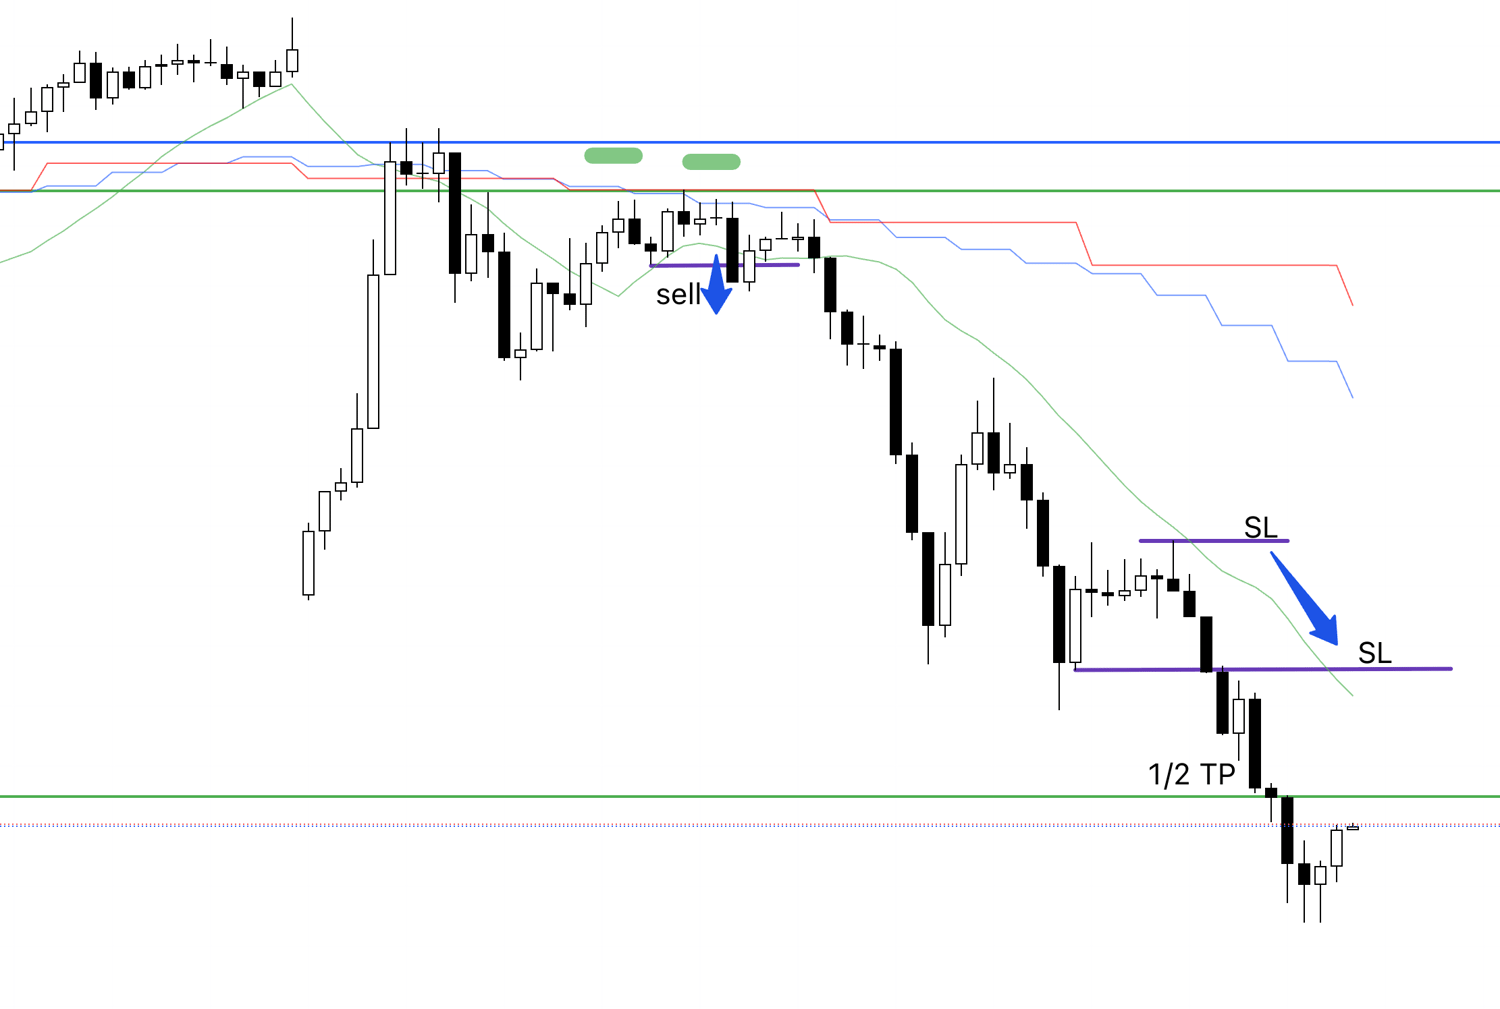
15m Chart
I moved the SL down further.
15m Chart
I moved it down again.
I plan to take half profits at the green line visible below.
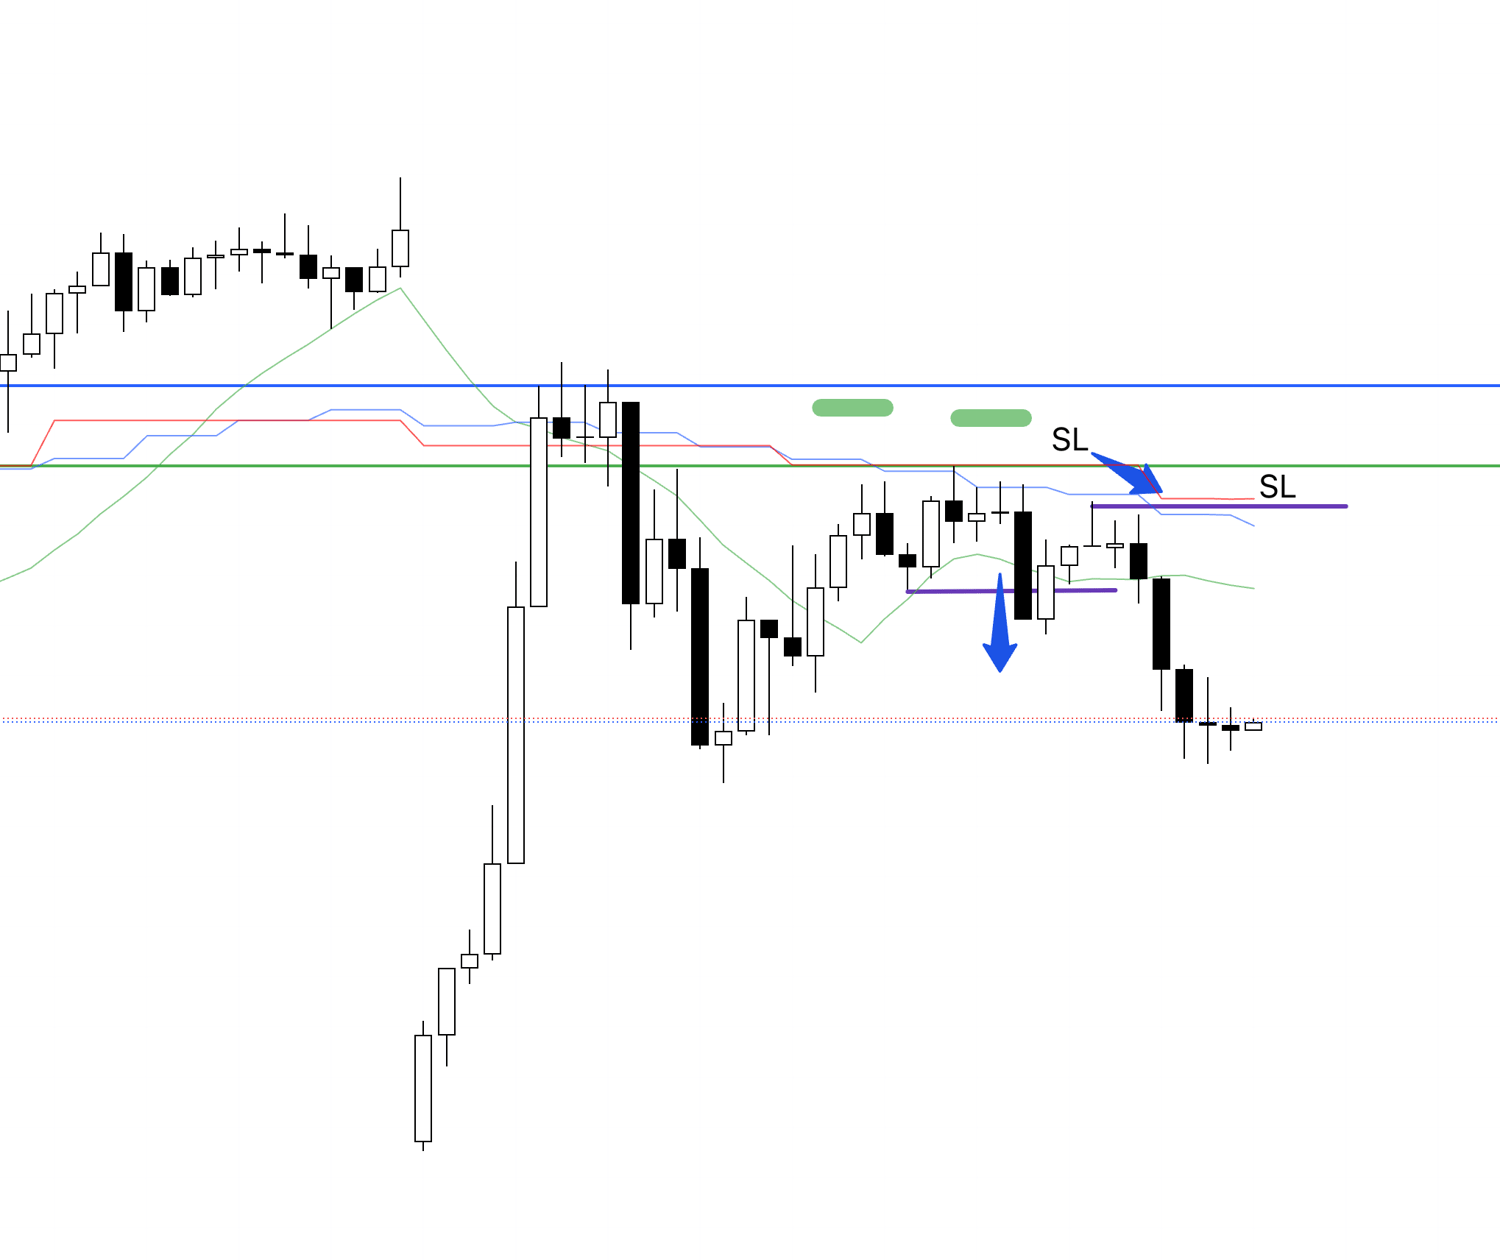
Looking at this point on the 4h chart, it corresponds to the following line.
4h Chart
As I was watching for in my scenario, the current decline is to form a pullback on the daily chart, so the lower it goes, the more buying pressure will increase.
I want to take half profits at a key level and hold the rest until the trend breaks.
15m Chart
I took half profits when the price reached the line.
I will hold the rest until the trend breaks.
15m Chart
I moved the SL down.
15m
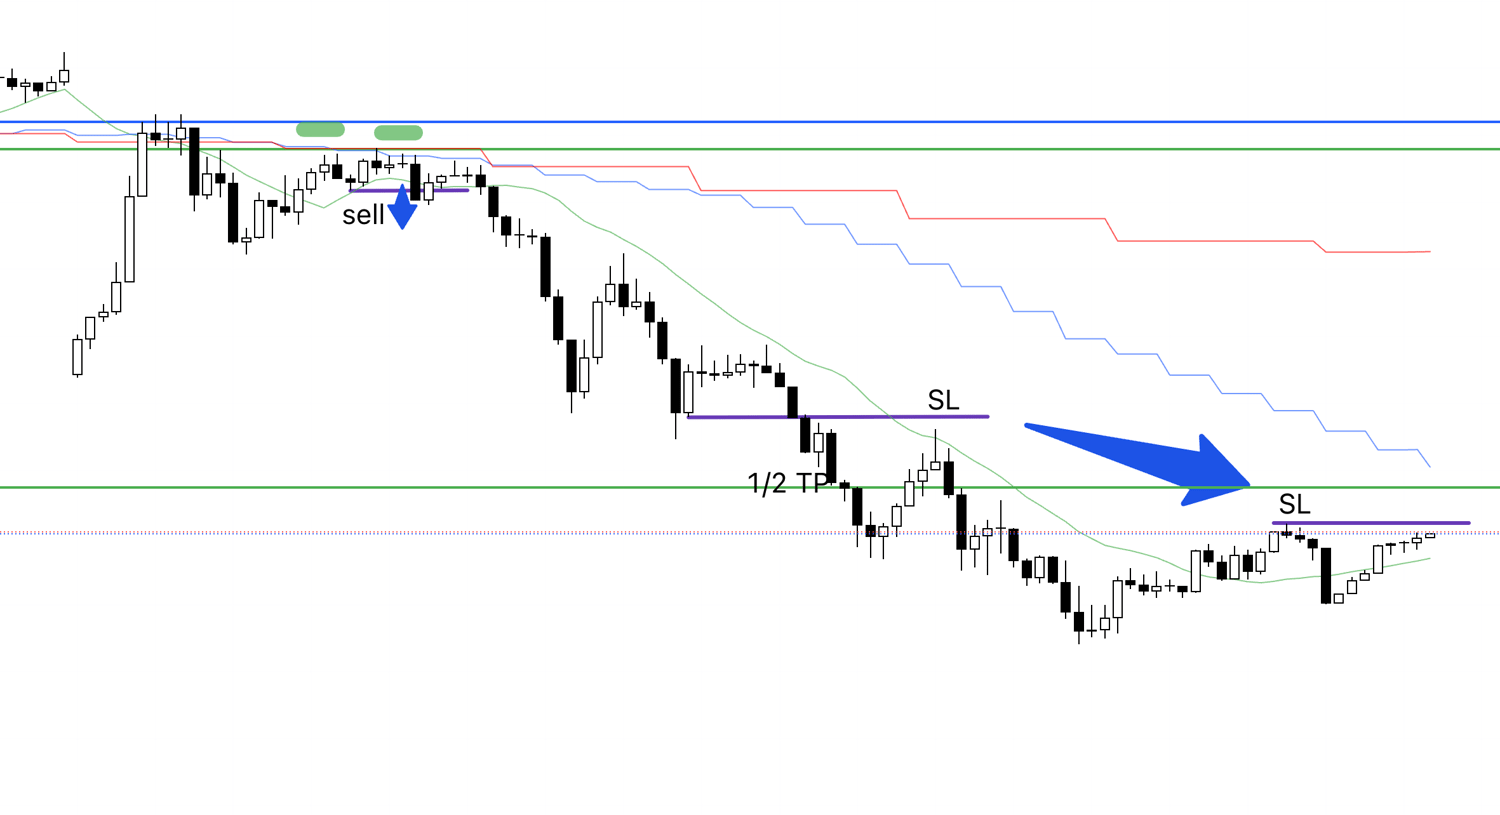
Since I was asleep late at night, I would have normally moved it down one step earlier, but this adjustment was made after I woke up in the morning.
I do not place trailing stops or new orders while I'm sleeping, so I will not be touching the charts at this time in the future either.
15m Chart
The trade just closed.
Now, I will summarize this trade below.
15m Chart
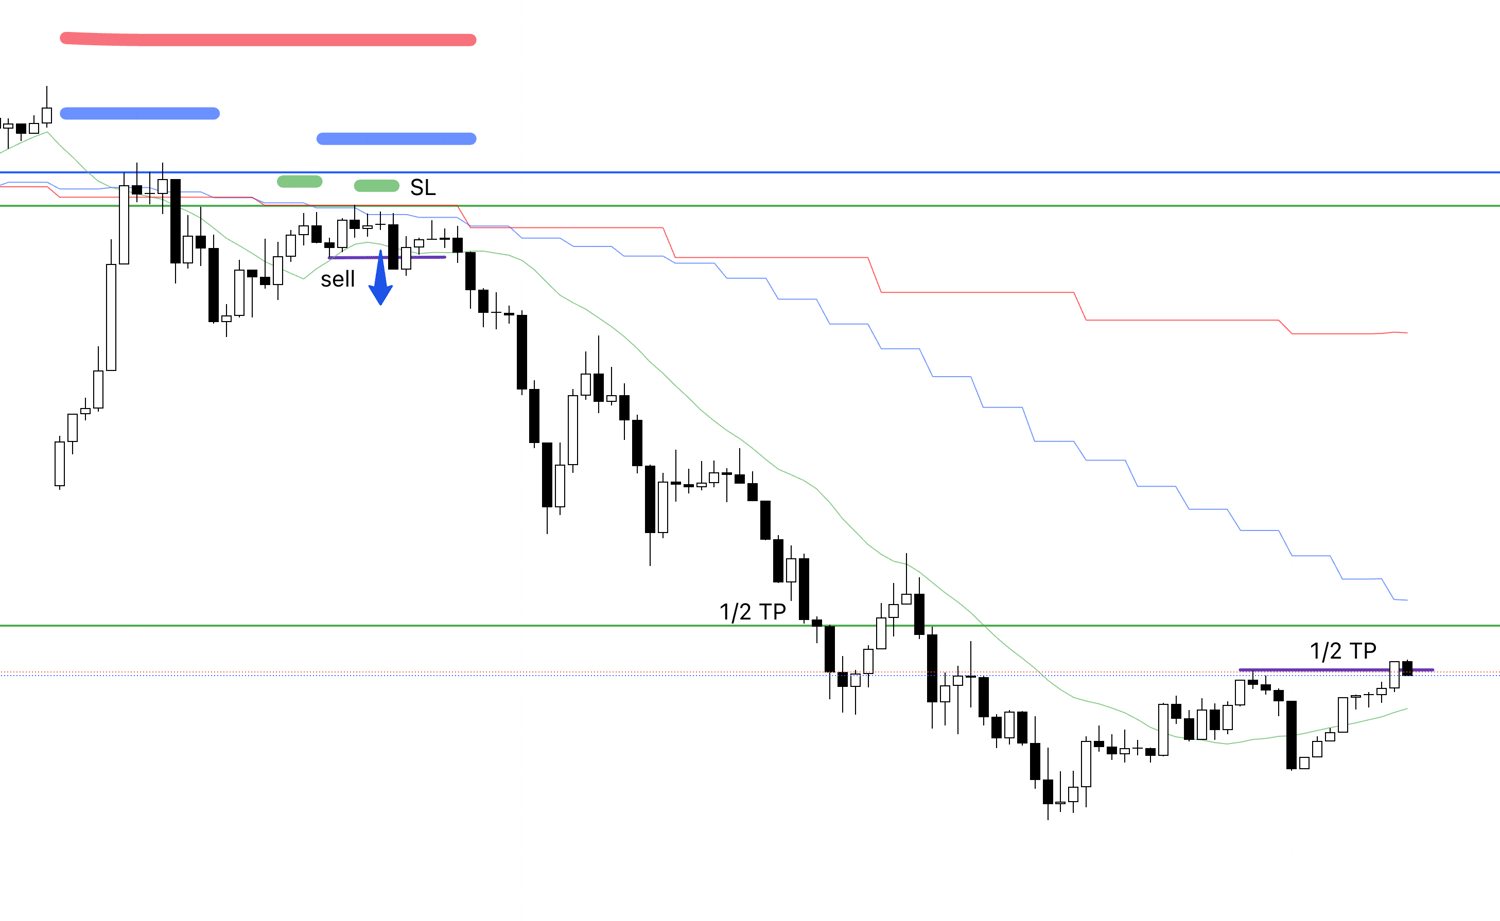
The sell scenario I had outlined on Sunday appeared.
The 4h chart formed a lower high, seemingly rejected by the blue line I drew, and within that, the 1h also formed a lower high, and then the 15m made a lower high while breaking the low, so I entered at that breakout point.
At that moment, the 1h had not yet confirmed a new low, so the key point was whether this would lead to a new low on the 1h chart.
When it broke the 1h low, a rush of orders came in, leading to a significant drop.
Since I was able to enter a step earlier on the 15m, it turned into a trade with a very good risk/reward.
After that, considering the risk of a pullback buy on the daily chart, I took half profits at a line drawn from a previous 4h low and held the rest until the trend broke.
I do not watch the charts at night, so I left it as is, moved the SL down after waking up, and the trend eventually broke, closing the rest for a profit, which concluded this trade.
This was another instance of executing the trade I was supposed to, based on the plan I was supposed to follow.
〜・〜・〜・〜・〜・〜・〜・〜・〜・〜・〜・〜・〜・〜・
That's all for the explanation of the trade I actually took, but this week there were many points for 4h pullback buys and sells.
I will explain these.
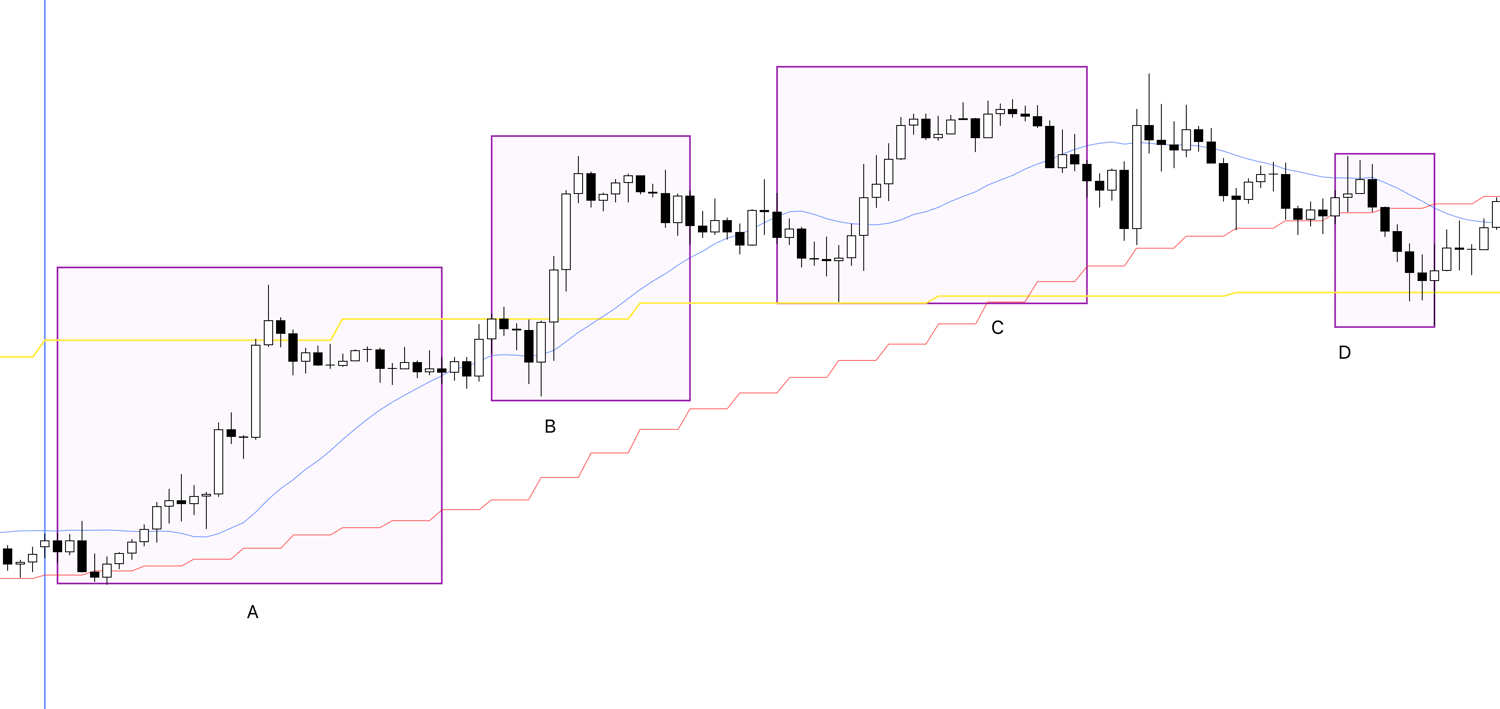
First, let's look at USDJPY.
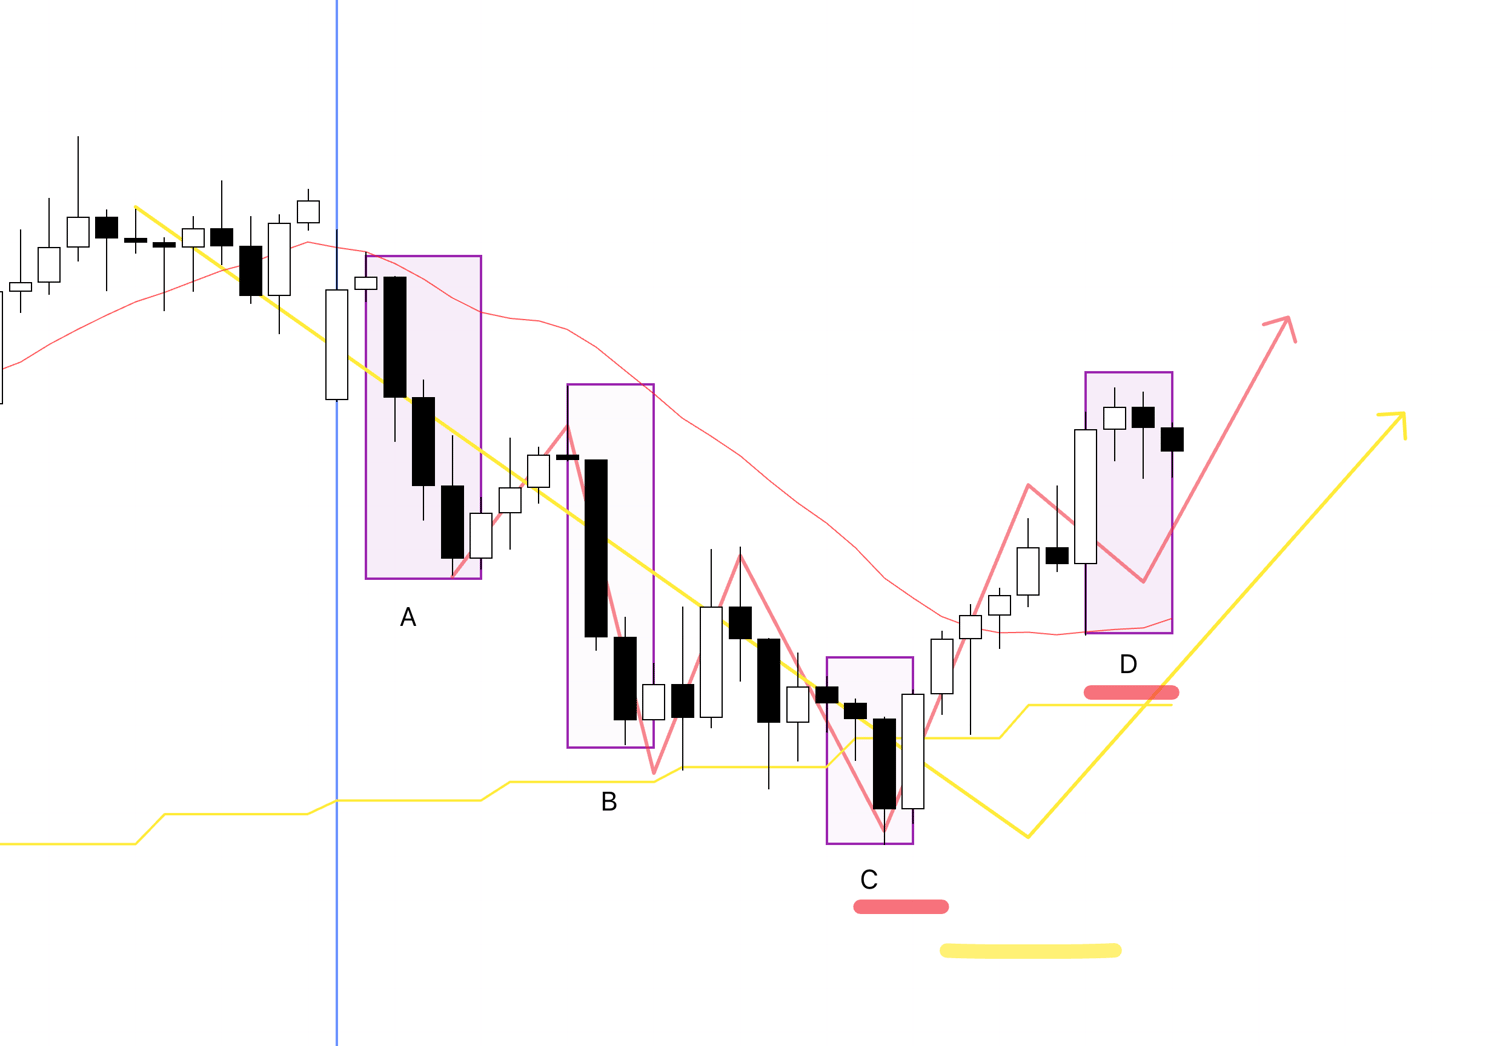
Please see the chart below.
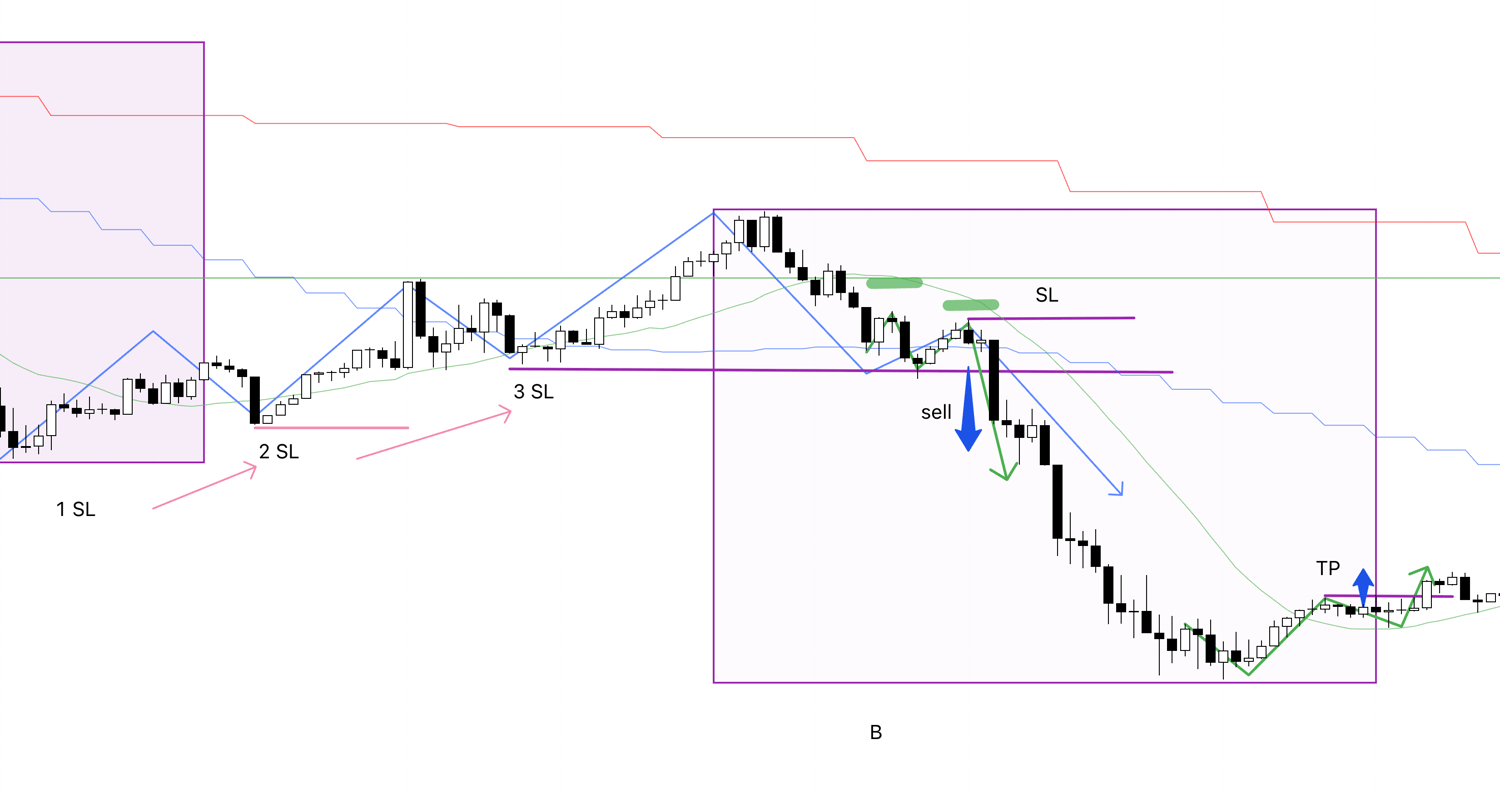
4h Chart
The trade I just explained is at point A.
Now, to explain B, C, and D, let's look at these points on a lower timeframe, the 1h chart.
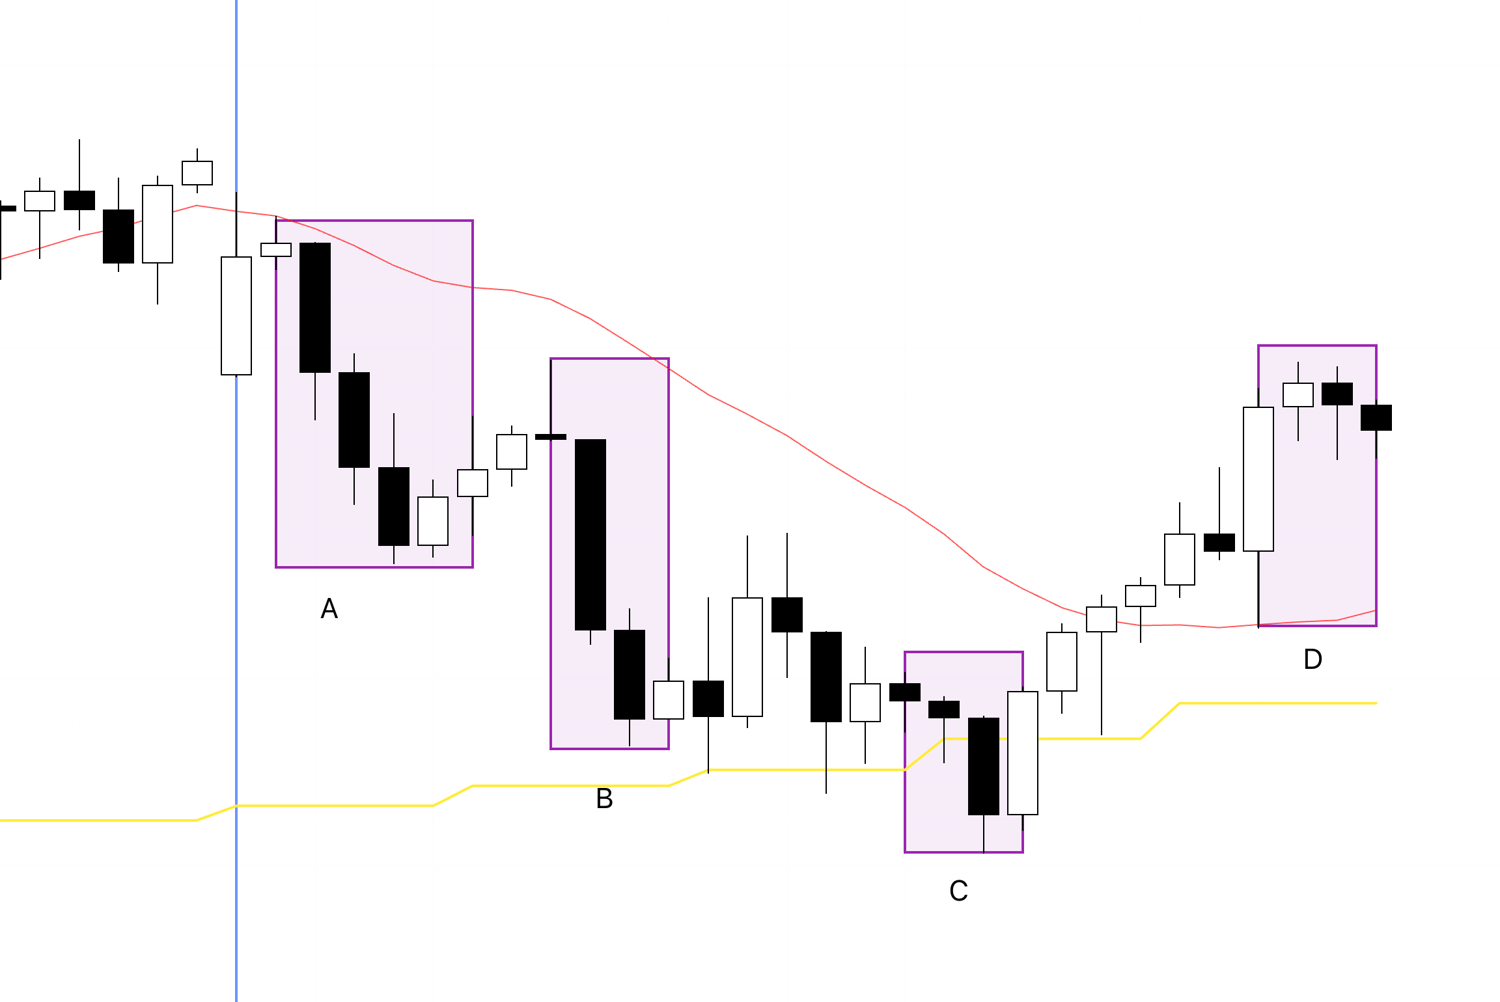
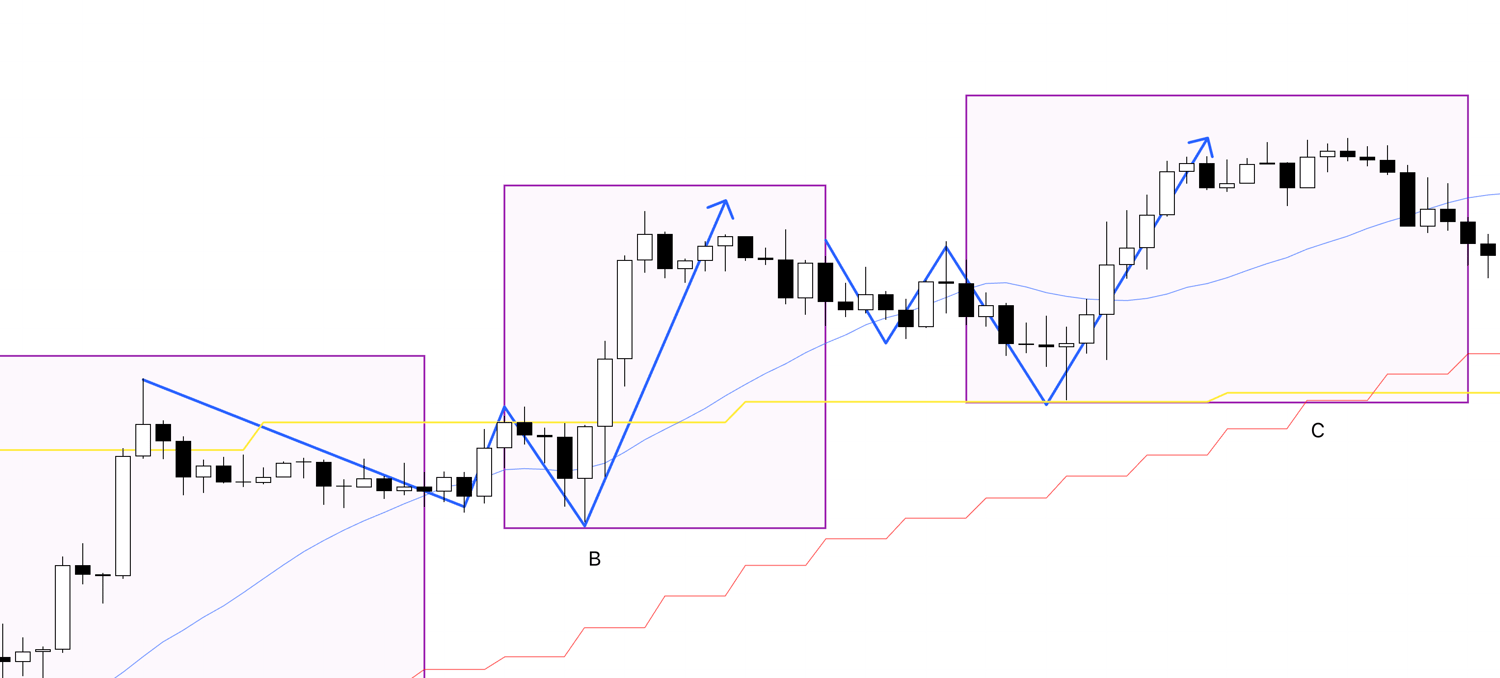
1h Chart
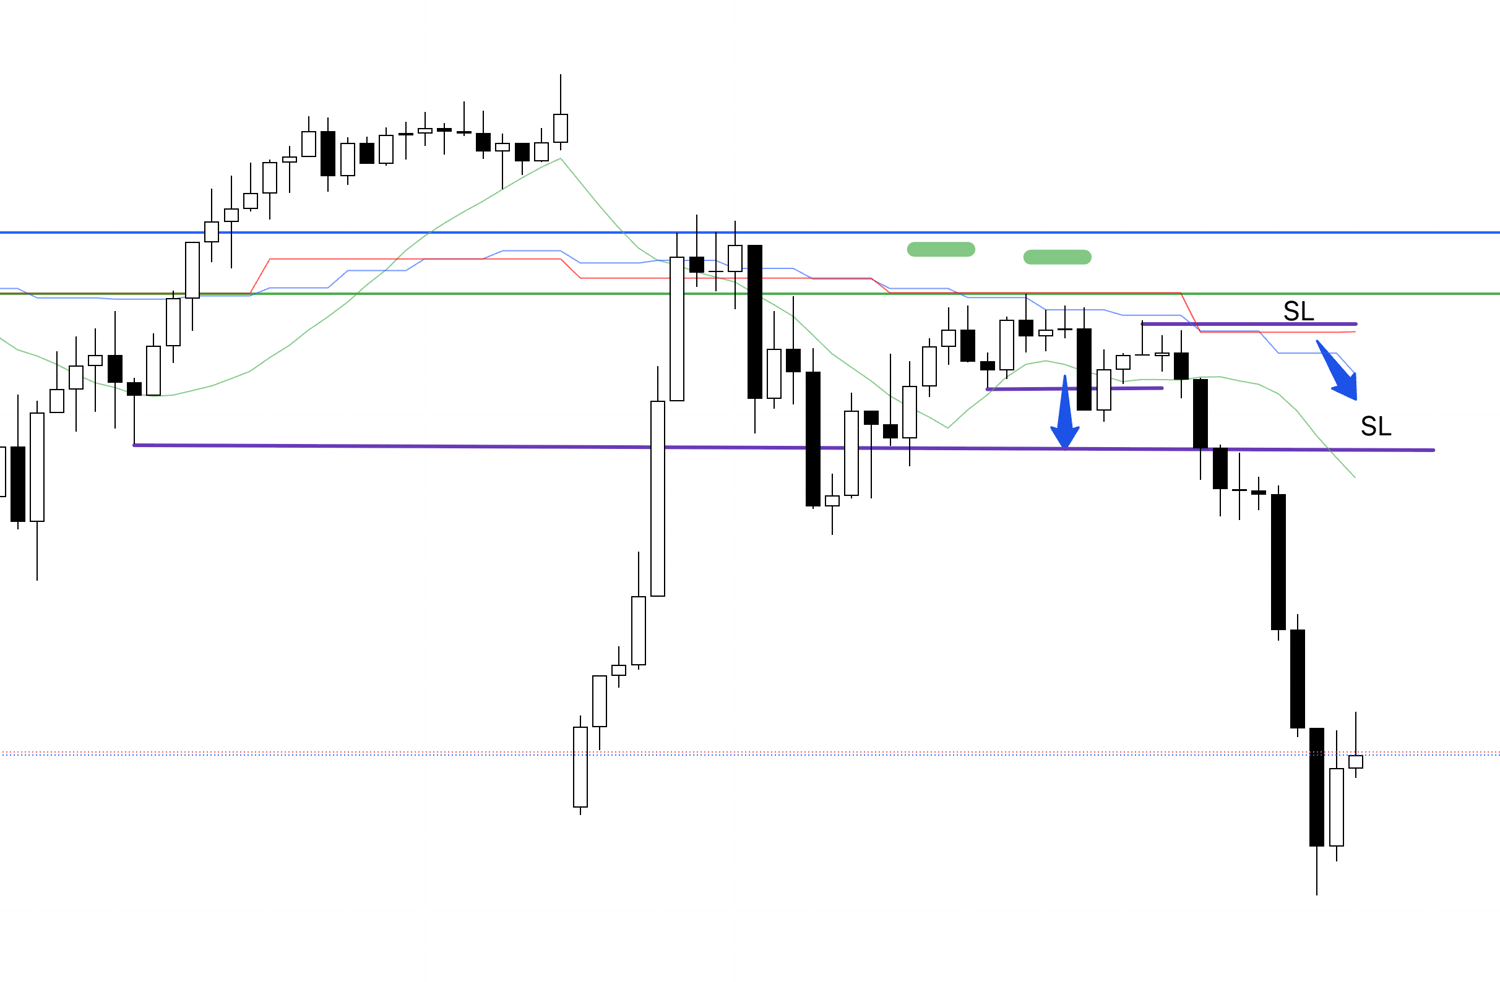
This is how it looks on the 1h chart.
First, regarding point B, I was waiting for this pullback sell, but I thought it would take a little more time to form a solid high on the 1h chart, and by the time I looked at the chart, it had already dropped, so I was not able to trade it.
1h Chart
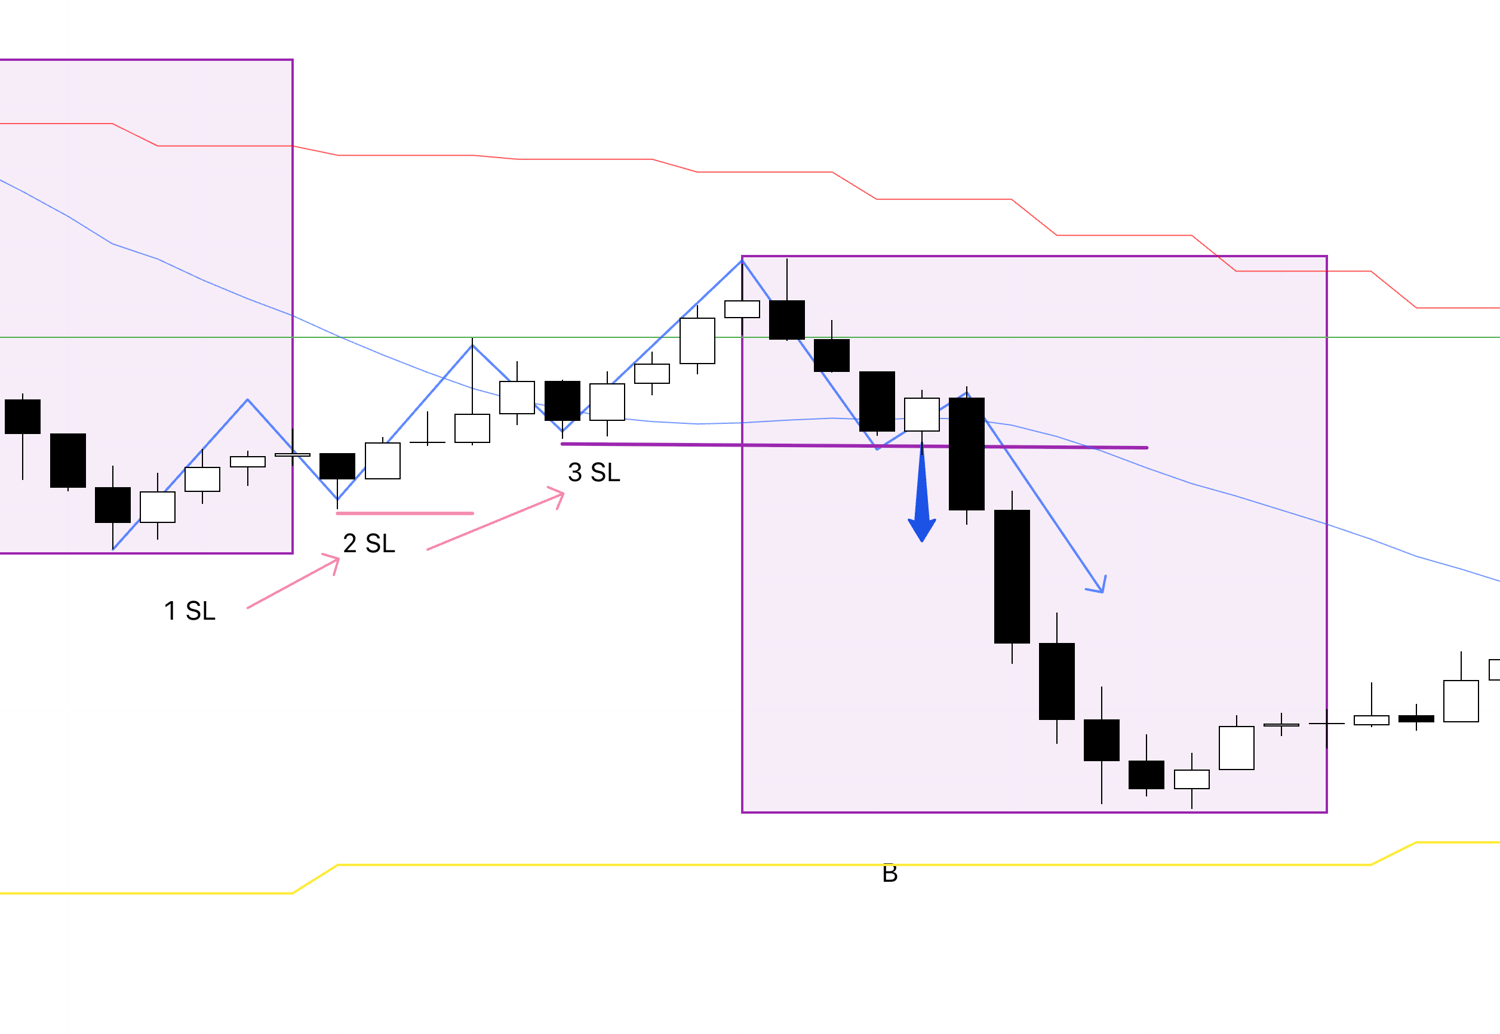
At this point, just before, the 1h was repeatedly making new highs and higher lows, forming a pullback rally against the 4h trend.
This is not a rally I would trade; it is a rally where I wait for the next point to switch to a downtrend.
In this rally, the stop losses for traders who have buy positions from the first rise are at SL 1.
Then, for traders who bought on the pullback at 2, their SL is at 2, but by making a new high and a higher low, the SLs of the traders at 1 are moved up to 2.
Similarly, the SLs for traders who bought at 3 are at point 3, but this new high and higher low causes the stop losses of traders who already have buy positions at 1 and 2 to be moved up to 3, and a lot of stop-loss orders = sell orders are concentrated at 3.
When the price breaks the low at 3, it triggers the concentrated sell orders for the decline, increasing the edge for a drop.
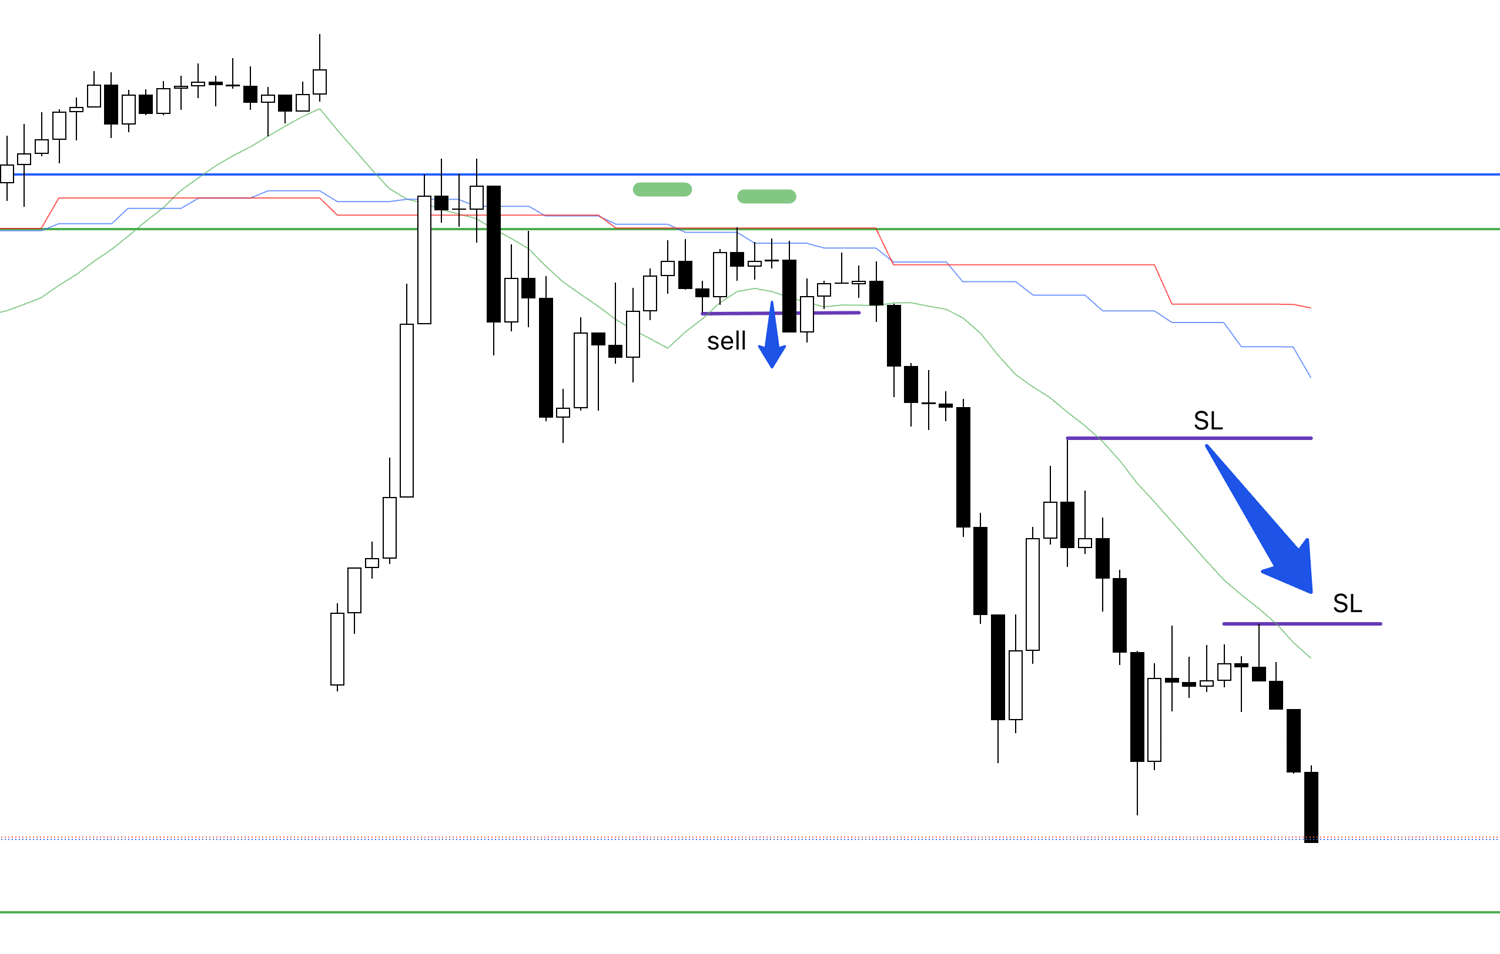
Let's look at this point on the 15m chart.
15m Chart
Although I couldn't trade it, the 15m chart shows a clean new low and lower high, so those who were able to sell from this point might have been able to make a profit by holding until this trend broke.
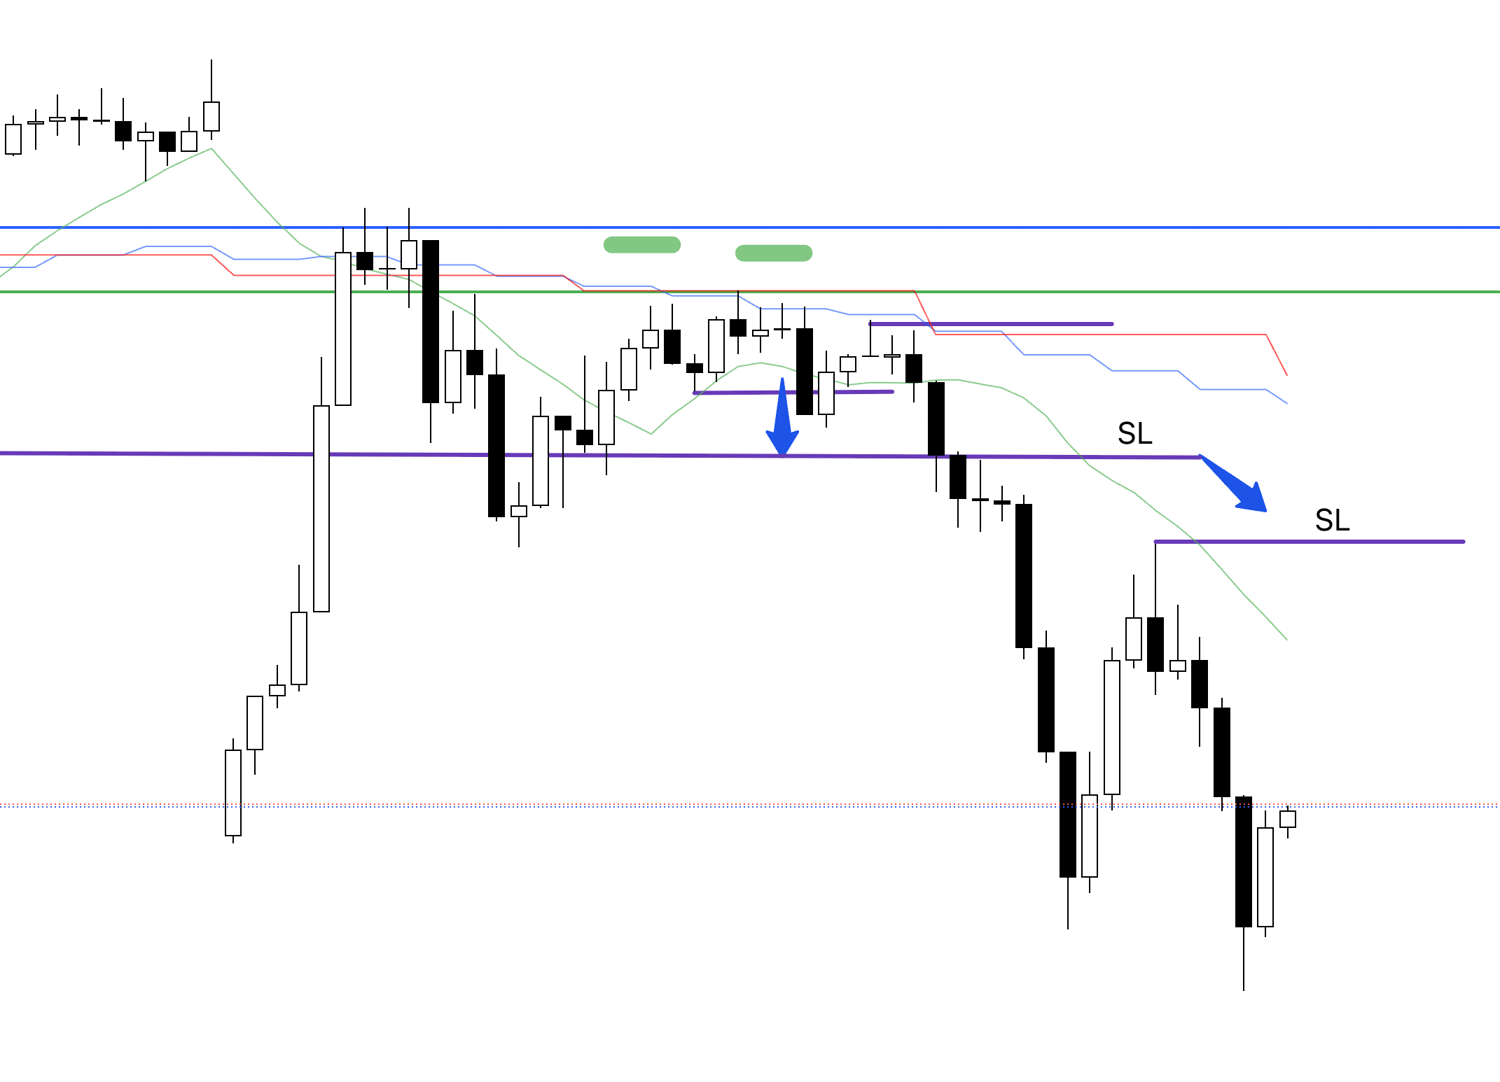
Now let's look at point C.
1h Chart
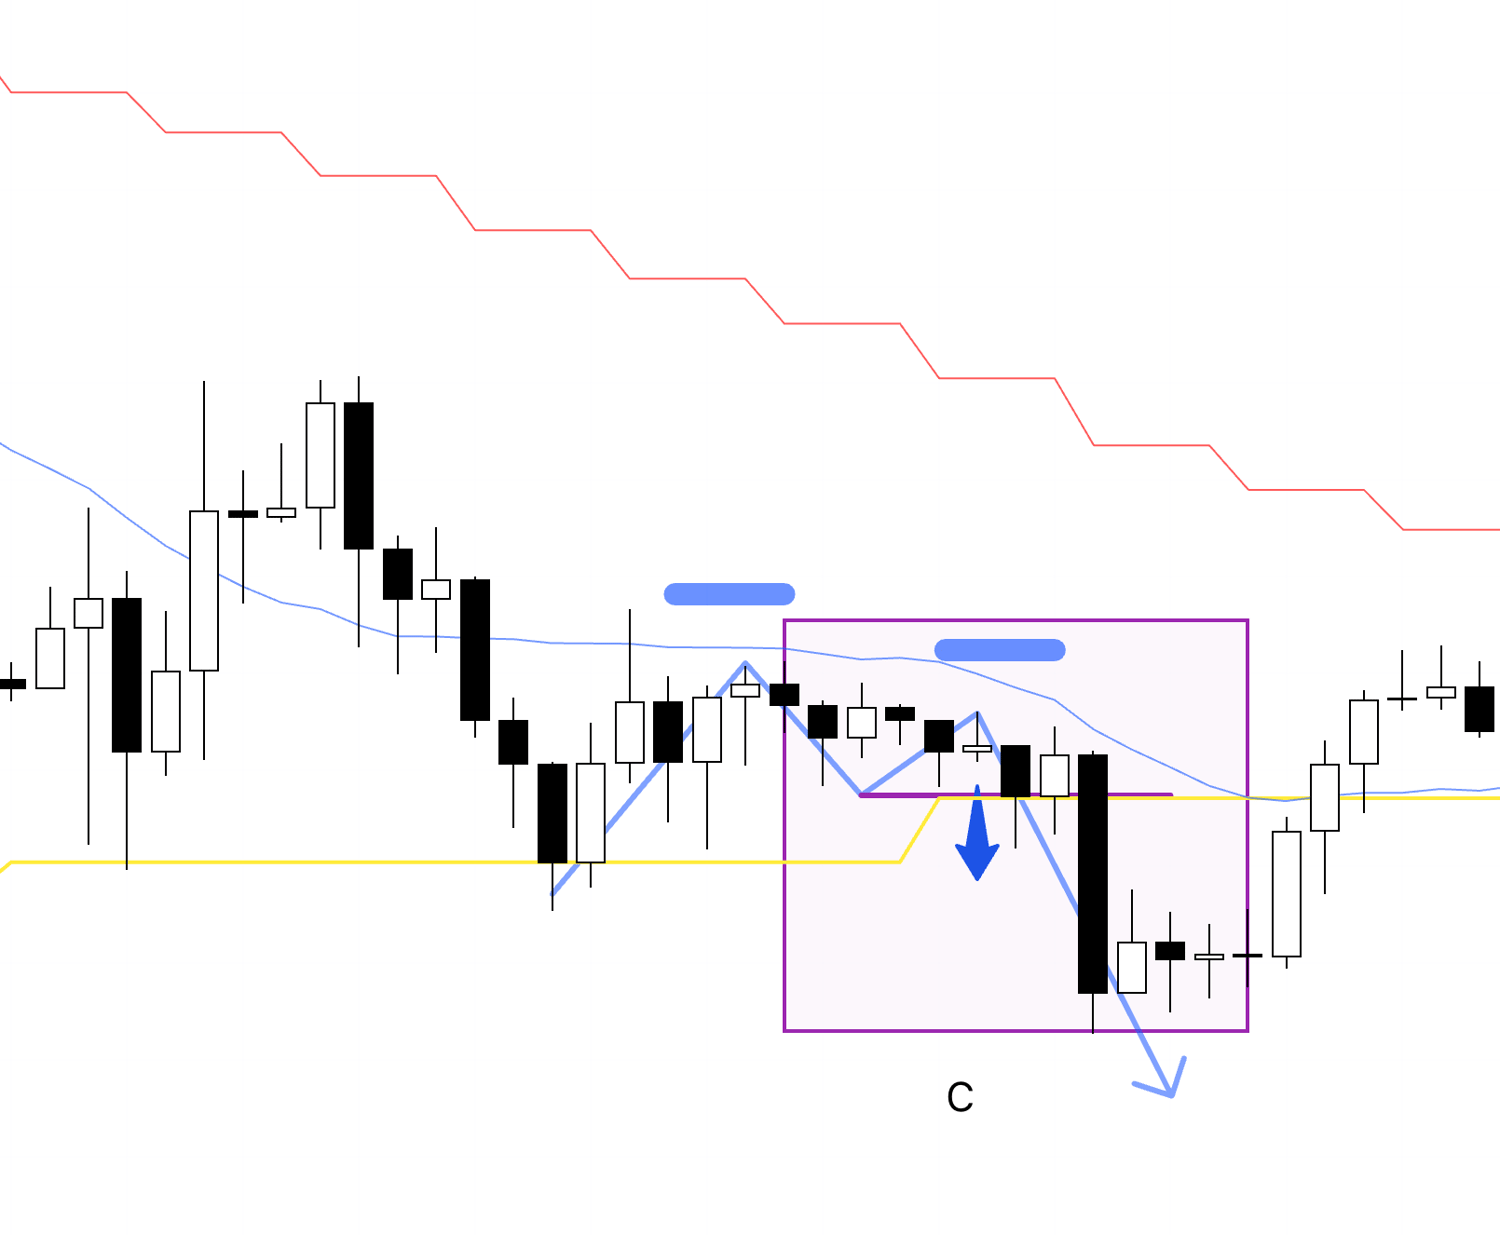
While this point is indeed a place where the 1h makes a new low and a lower high within a 4h pullback sell, I had no intention of trading here from the beginning.
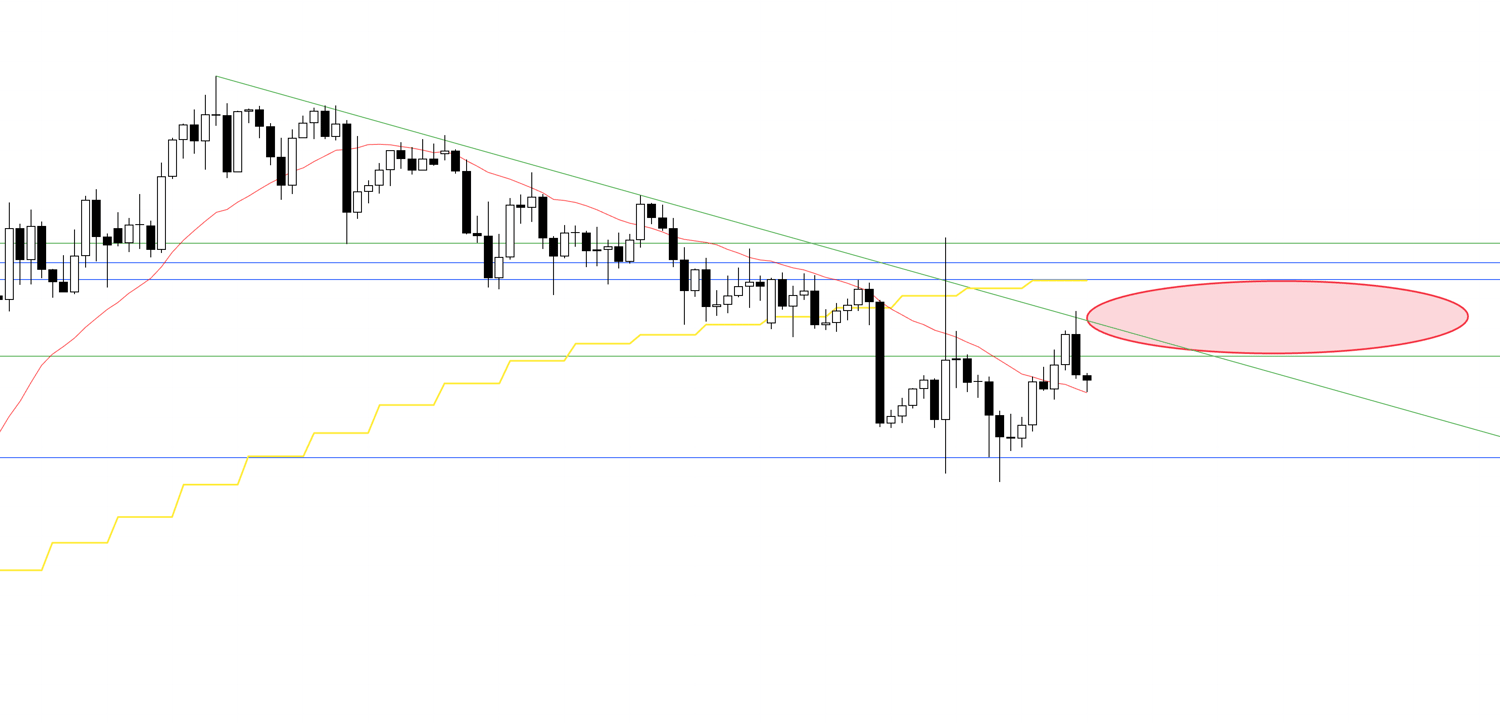
The reason is that I recognized this point as a daily chart pullback buy point, where buy and sell orders are likely to intersect, making it a high-risk point.
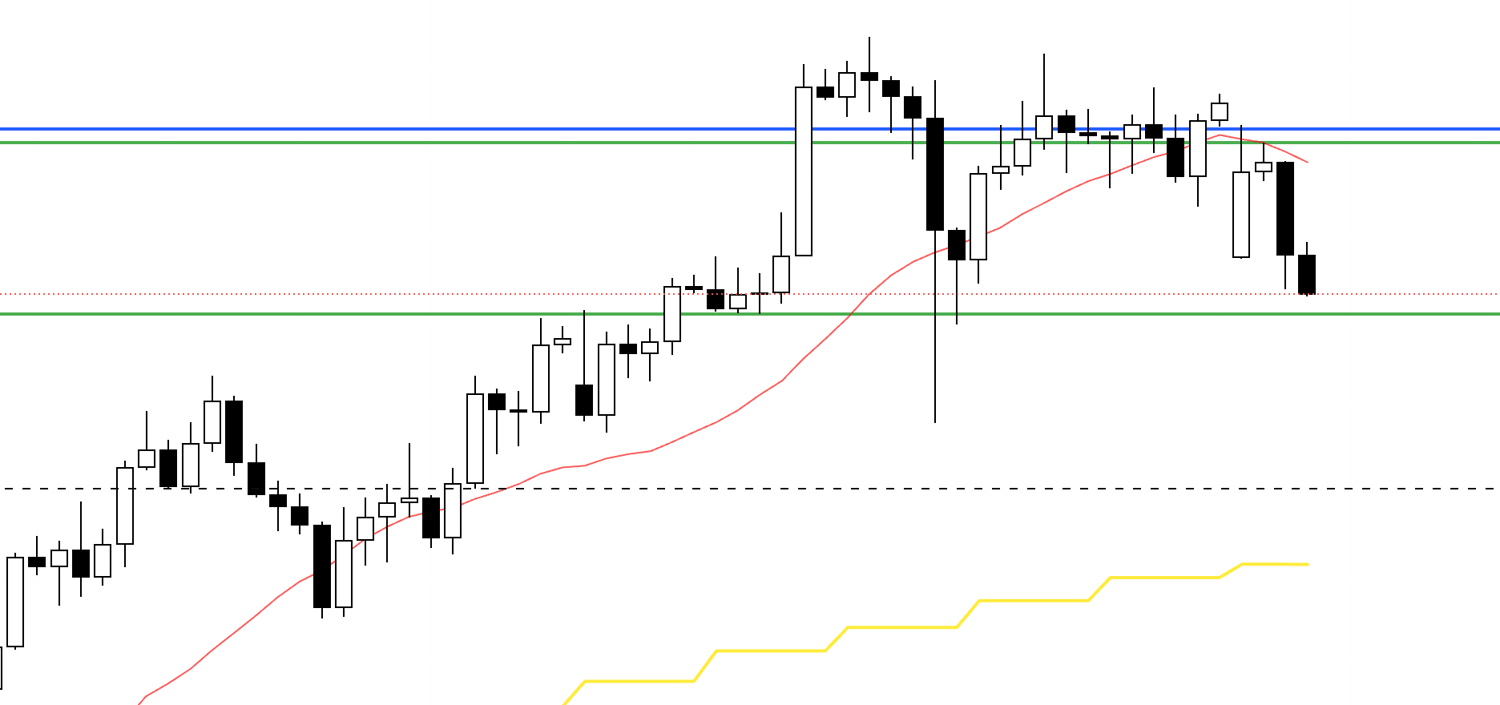
I touched upon this in last week's scenario blog, but please look at the following chart.
Daily Chart from Last Week's Scenario
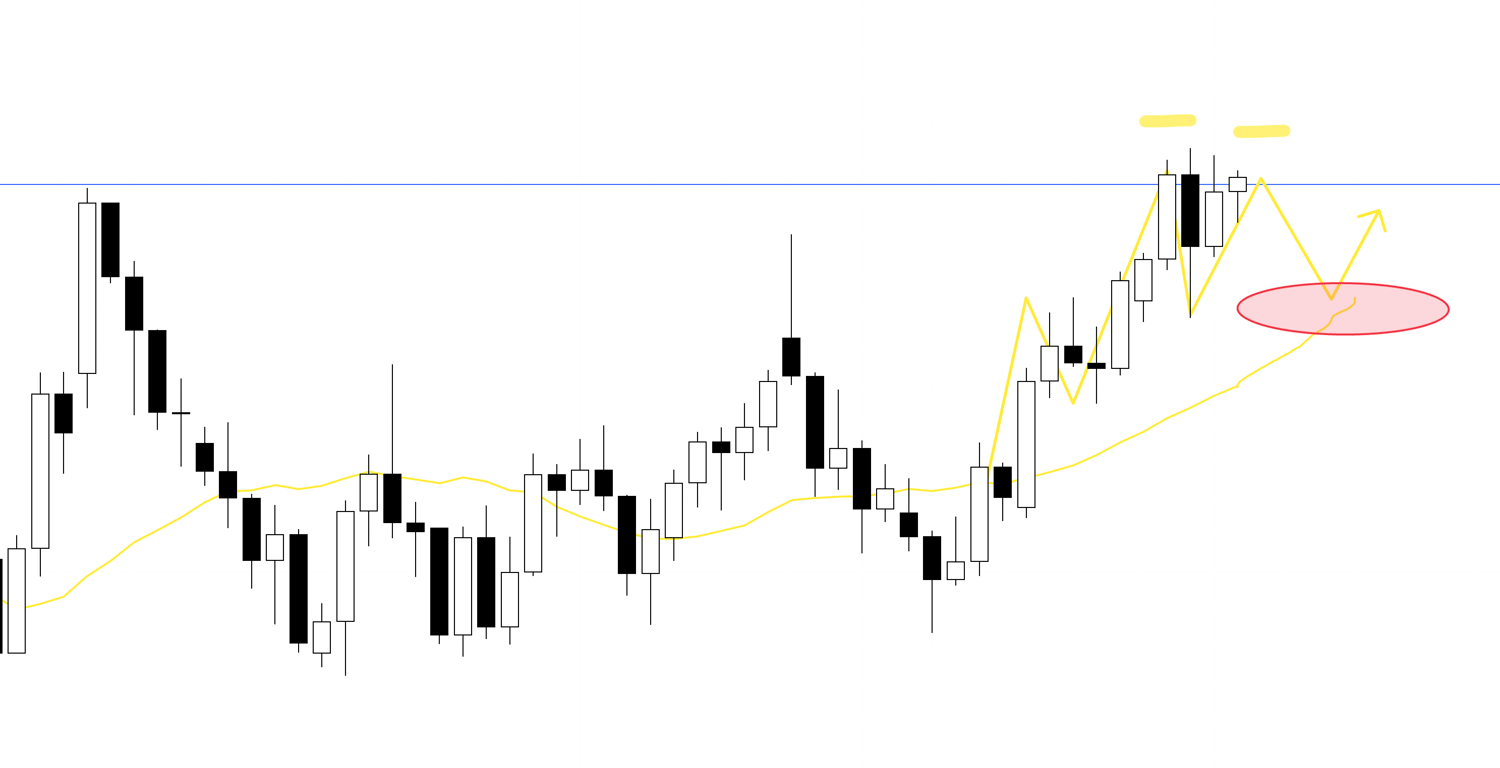
This is the daily chart from last week's scenario blog, and I was considering the risk of selling around the red circle, as it was a point where buying pressure would increase and daily pullback buys were likely to occur.
As it turned out, a trade at point C would have yielded a small profit, but that is hindsight, and it is crucial to consistently repeat trades only at high-edge points without being swayed by such hindsight.
It is important to understand in advance where and what kind of risks are hidden through multi-timeframe analysis, reflect that in your own scenarios and plans, and adhere to them strictly.
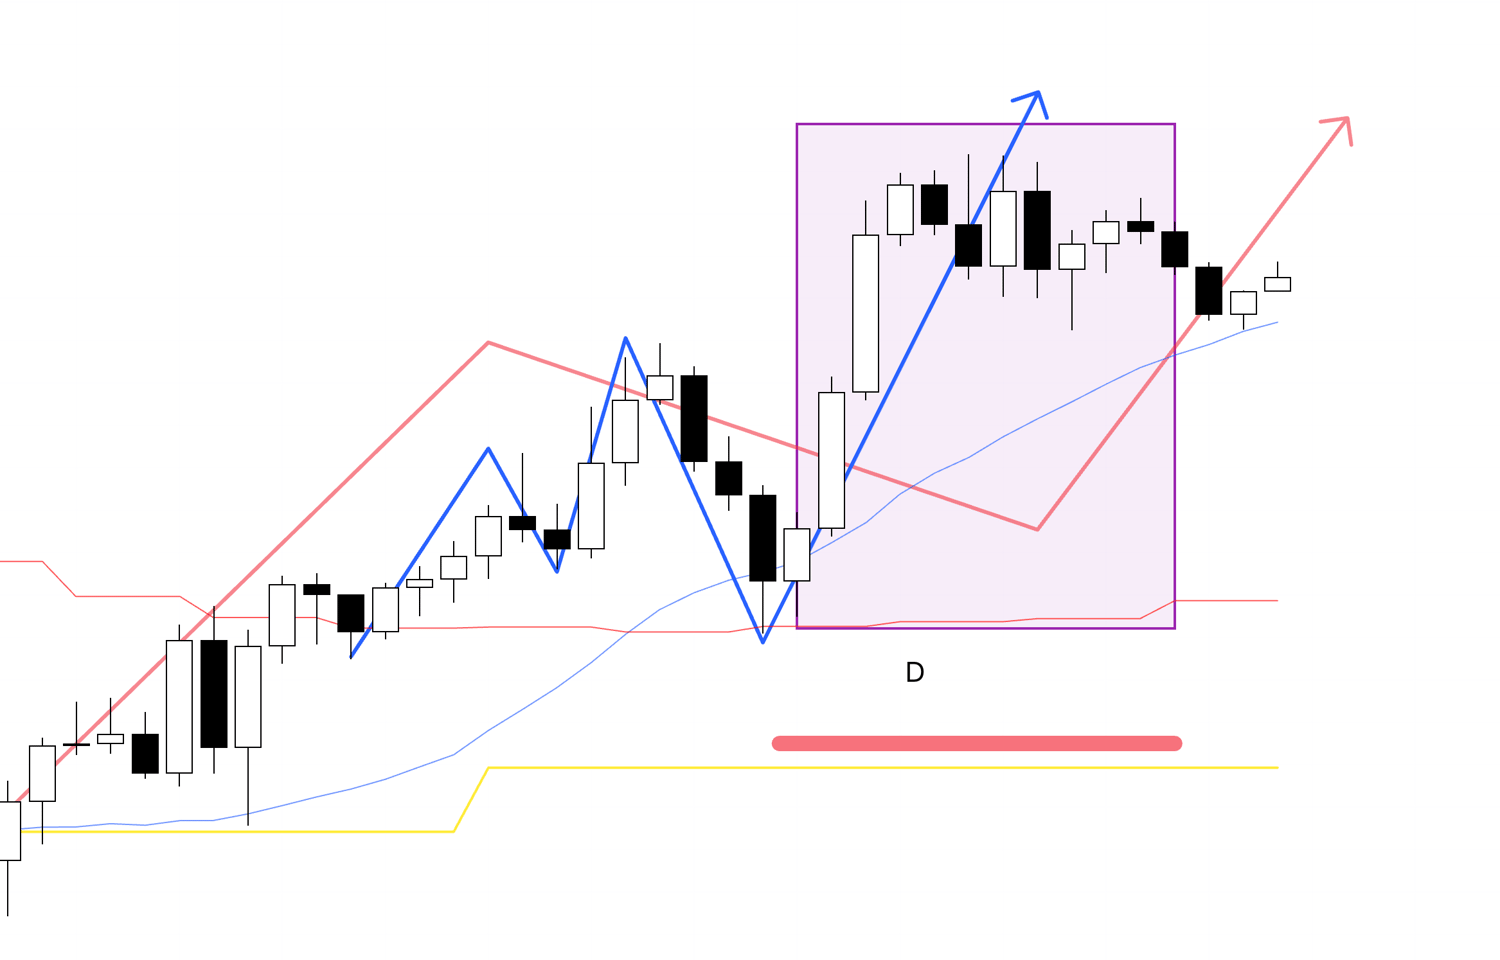
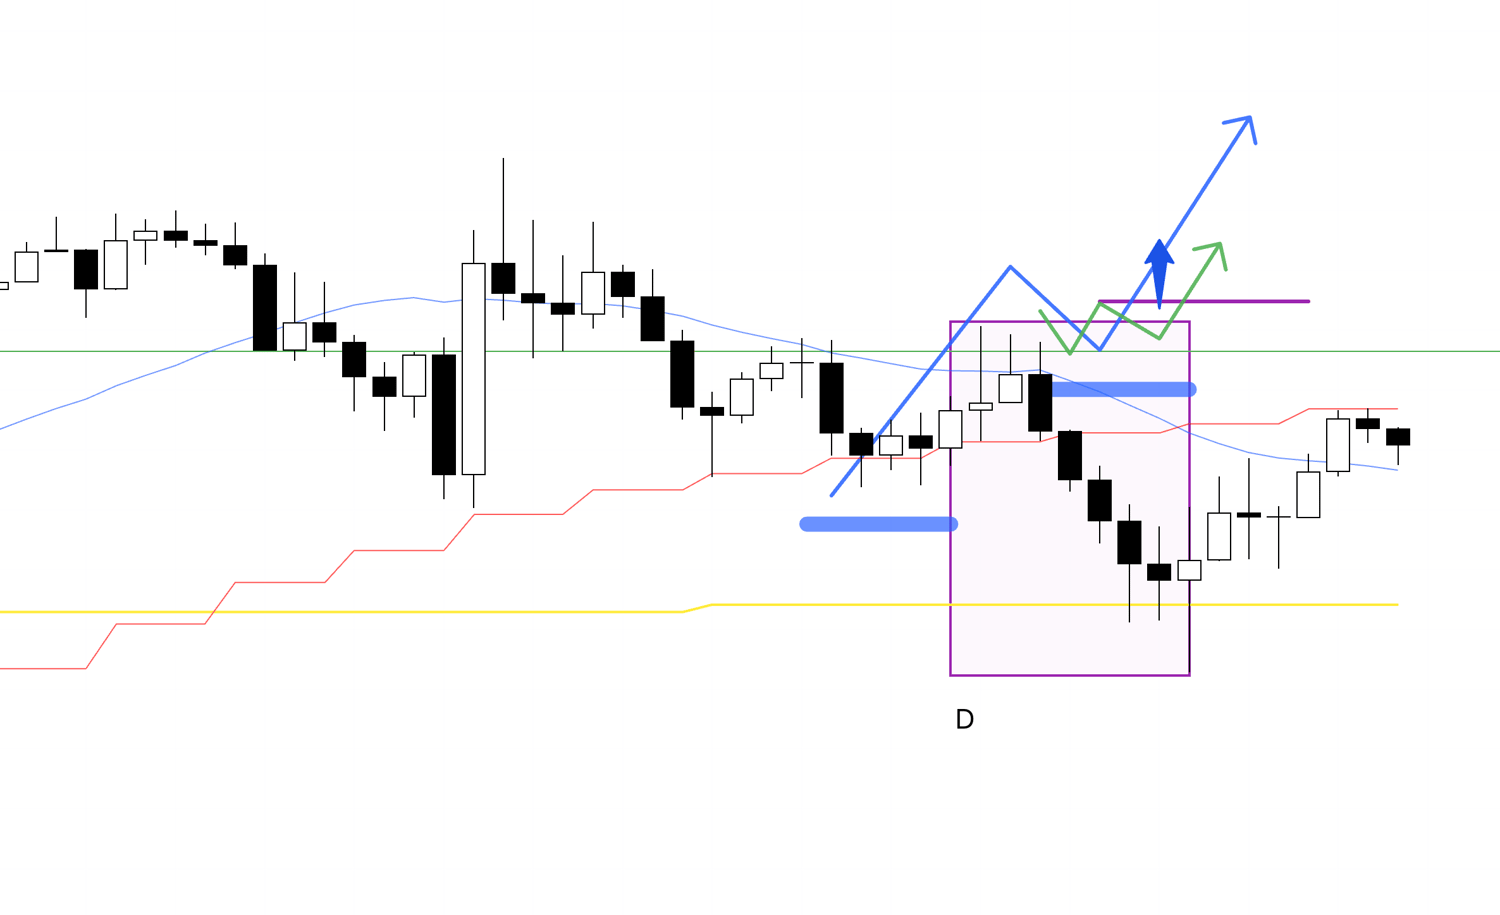
Now let's look at point D.
4h Chart
This is D as seen on the 4h chart; it's a point where the 4h trend is reversing in the direction of the daily pullback buy, and the edge for buying increases.
This was a point I was waiting for and had considered in last week's scenario.
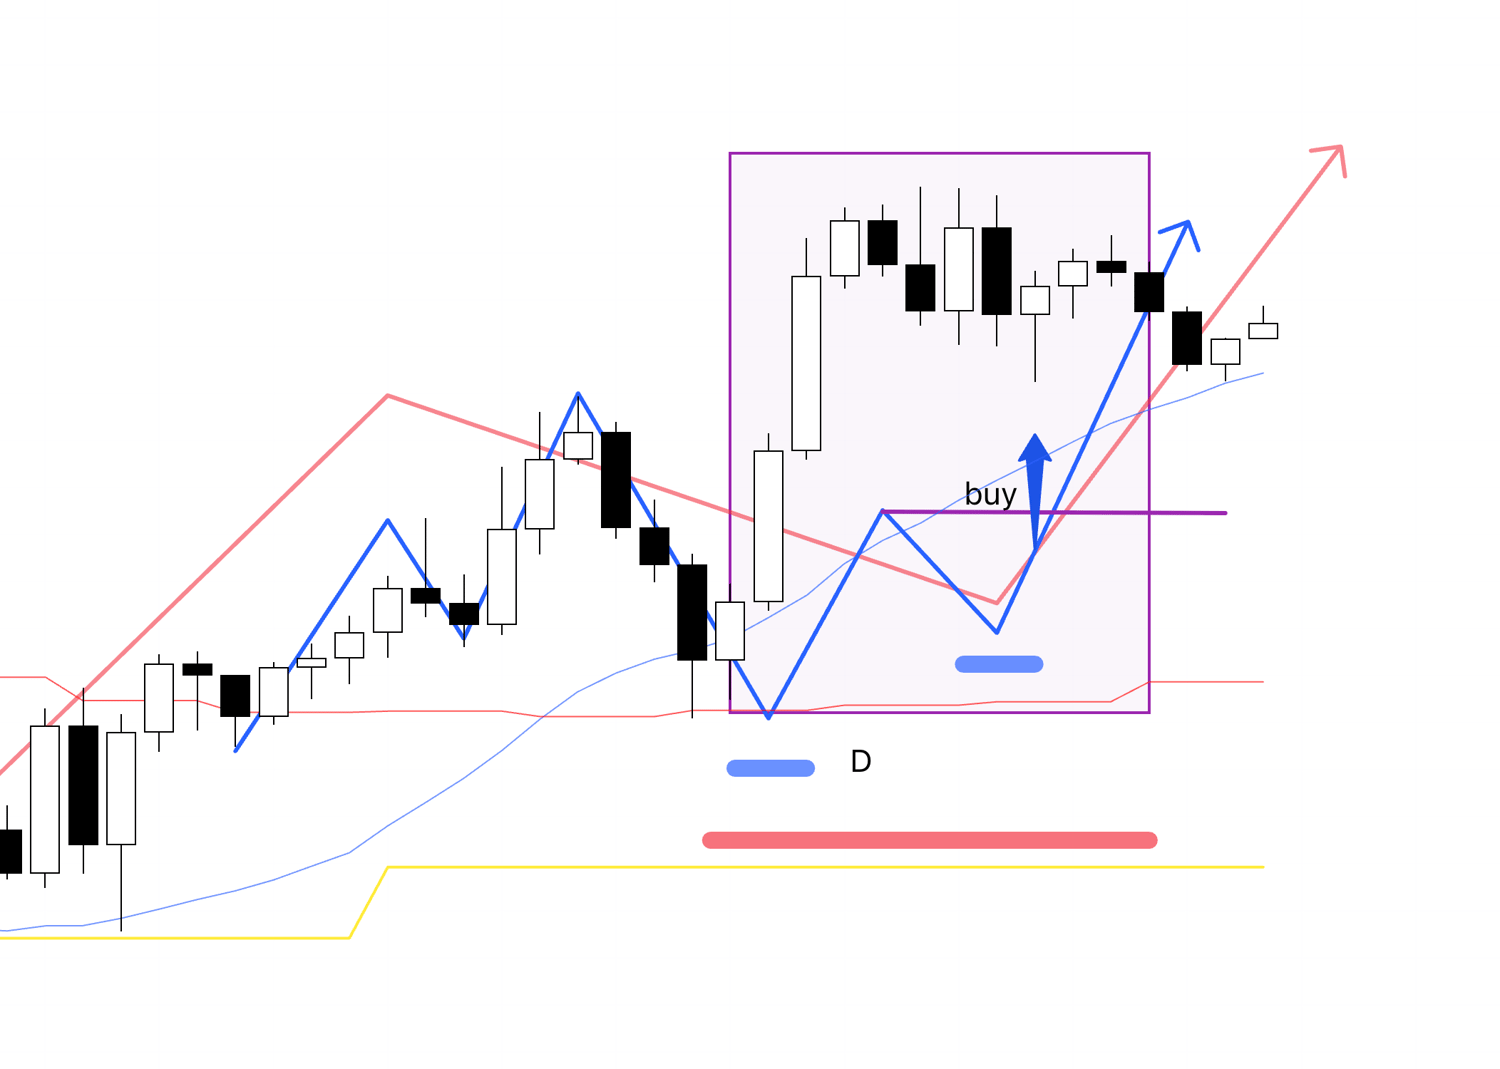
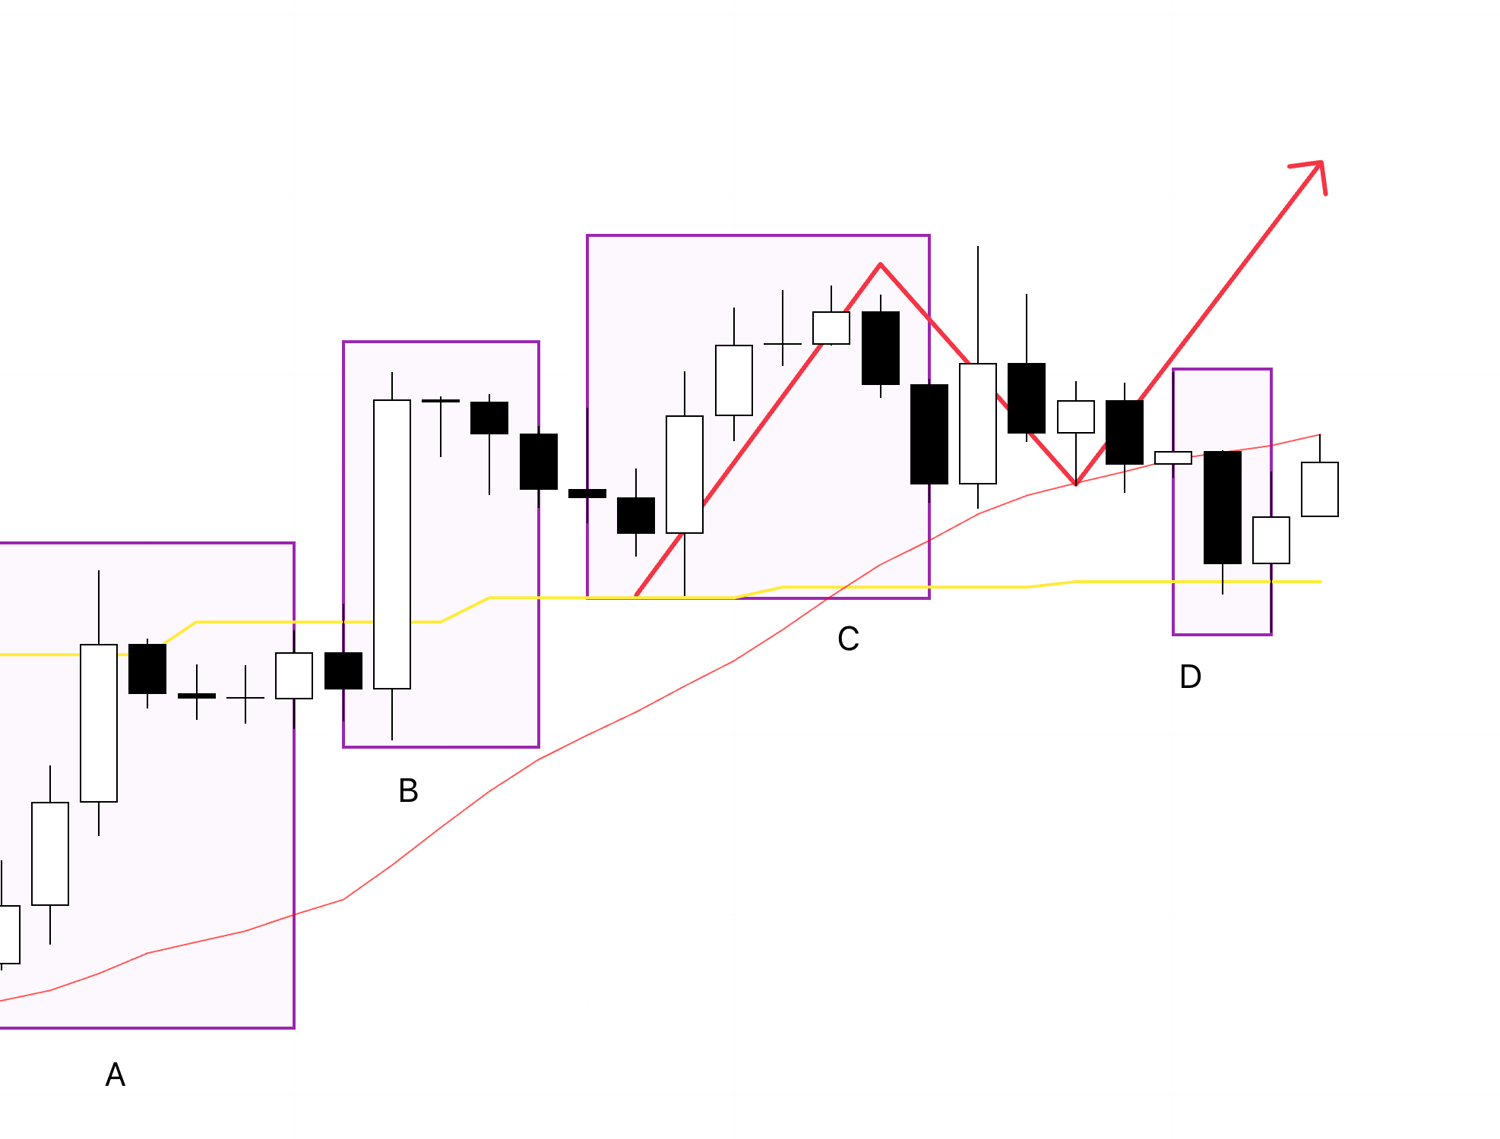
Please see the chart from the scenario blog below.
4h Chart
This scenario played out exactly, with the 4h downtrend ending and a buy entry at a higher low point, which is the first pullback buy opportunity.
The direction of orders on the daily, 4h, and 1h charts align, making the edge for buy orders very high.
Although it was a point I was waiting for, the price went up without forming a higher low on the 1h chart, so I couldn't get a timing for entry.
1h Chart
On the 1h chart, it made a new high without forming a higher low.
In such cases, I do not trade.
If it had been like the following, I would consider trading.
1h Chart
If it had formed a clear higher low point on the 1h like this and then made a new high, I think I would have traded it as the entry point I was waiting for.
This time, such a development did not occur, so I did not trade.
In this way, no matter how much the chart moves, you must not trade if the situation does not match your trading rules.
If you start thinking in hindsight, "I would have made a profit if I had done that," your consistency will crumble.
It's true that this one time might have been profitable, but if you bend your trend judgment based on Dow Theory to fit this one result, your subsequent trades will fall apart, and you will no longer be able to repeatedly trade at high-edge points.
So, for USDJPY, although there were several 4h pullback buy and sell opportunities, I was only able to trade at one spot this week.
It is very important not to get greedy and try to "catch every move," which leads to unnecessary losses, but rather to trade less frequently but only where it really counts, strictly following the rules.
〜・〜・〜・〜・〜・〜・〜・〜・〜・〜・〜・〜・〜・〜・
Next, let's look at EURUSD.
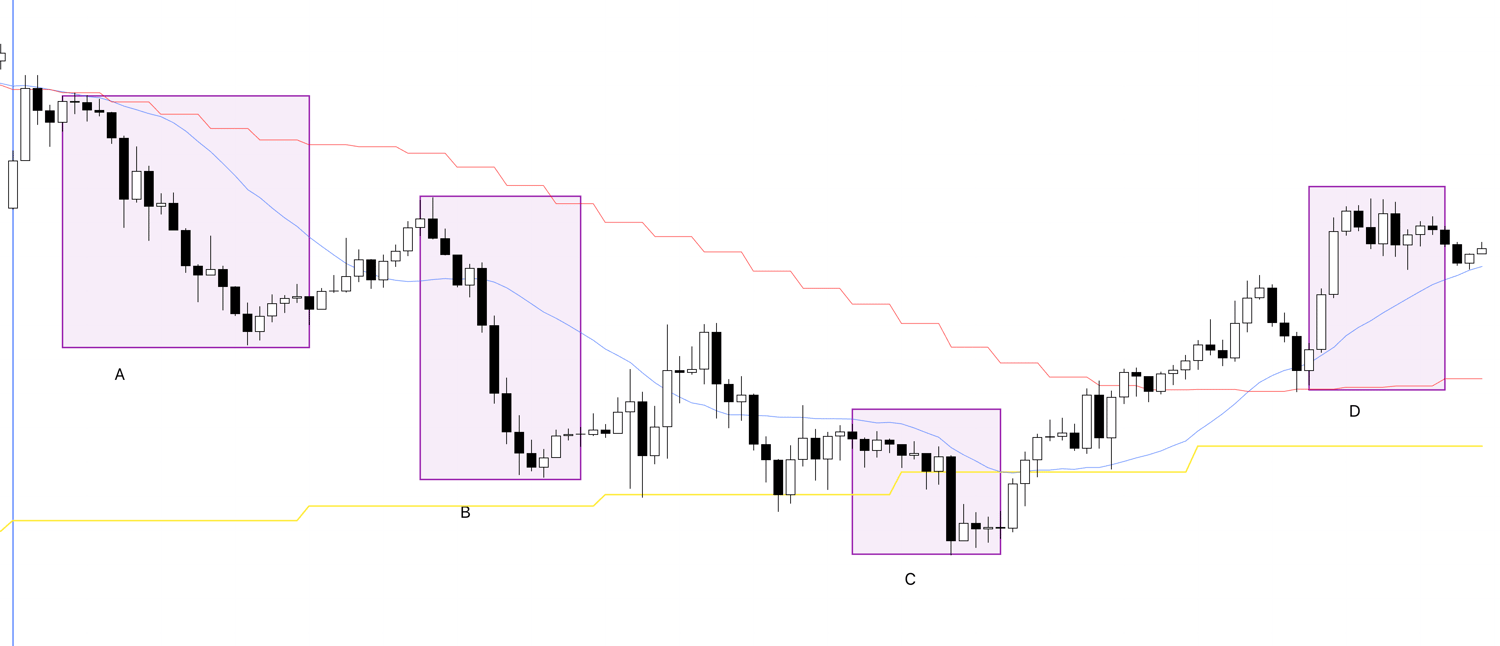
1h Chart
This is the 1h chart view of the 4h pullback buy and sell points for EURUSD.
First, regarding point A, I recognized this point as a likely area for daily pullback sells, so my plan was to trade after the price broke out of this area.
4h Chart
This is the 4h chart from last week's scenario blog; this area is a point where daily pullback sells are likely, and I had a scenario to buy on a pullback after the price exited this area.
However, point A was the first pullback buy point after the 4h trend reversal, so this time it extended strongly.
After that, point B was a point I was waiting for with a buy scenario, but it broke the low once and then went up, so I was unable to trade it.
For the same reason, I couldn't trade point C either.
I've marked both of these points on the chart below, so please take a look.
1h Chart
Both points B and C were points I was waiting for, but as you can see, the price broke the low on the 1h and then made a new high without forming a higher low, so I was unable to trade.
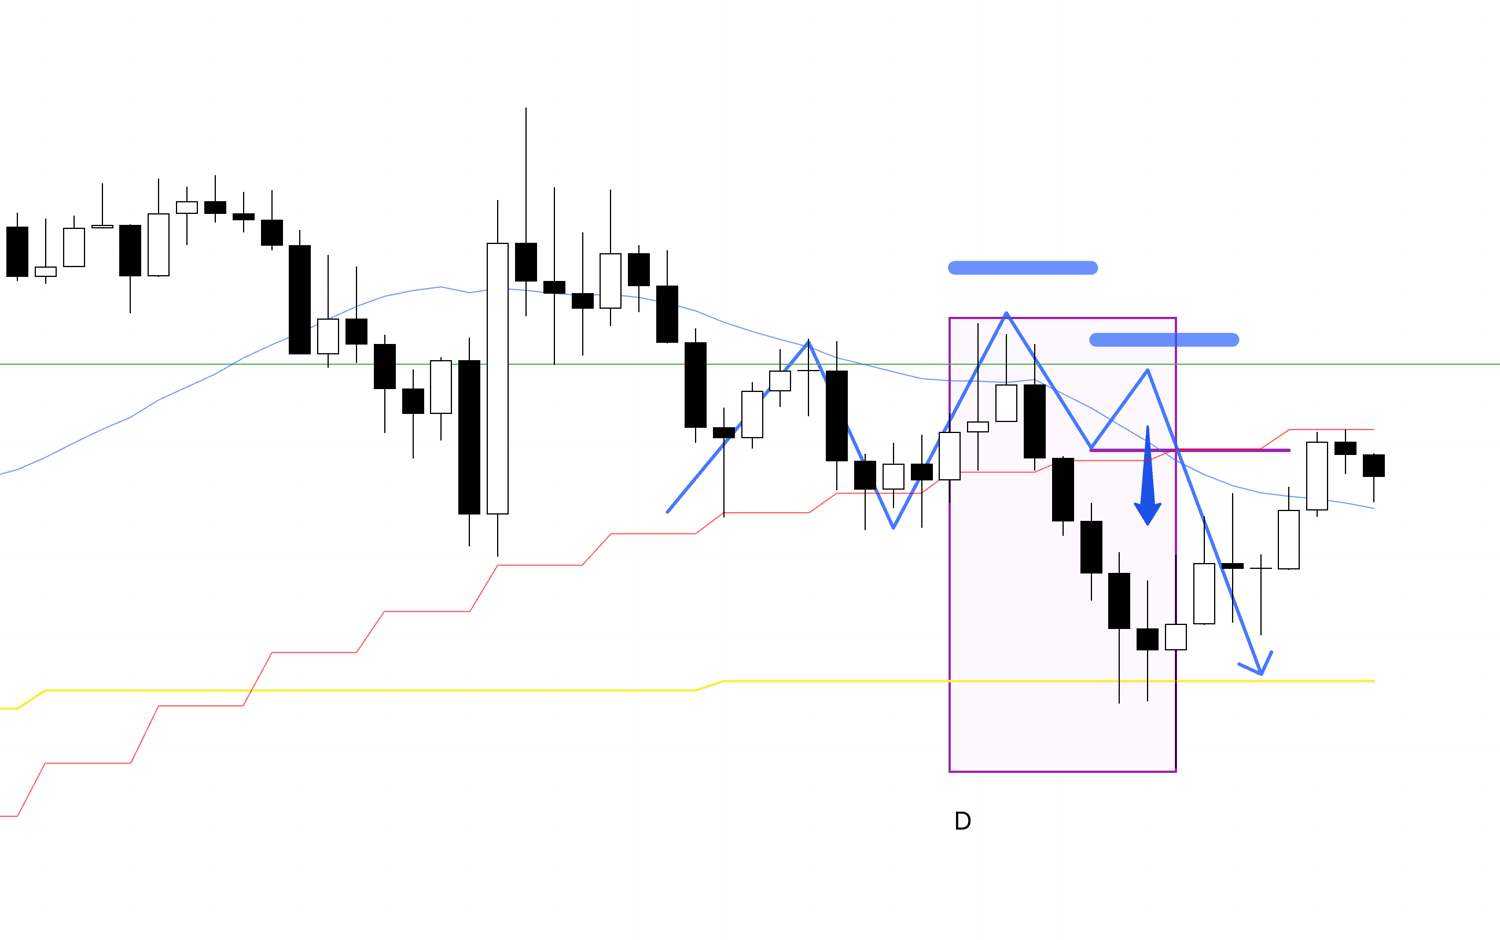
Then, for point D, I was waiting for both a pullback buy and a pullback sell.
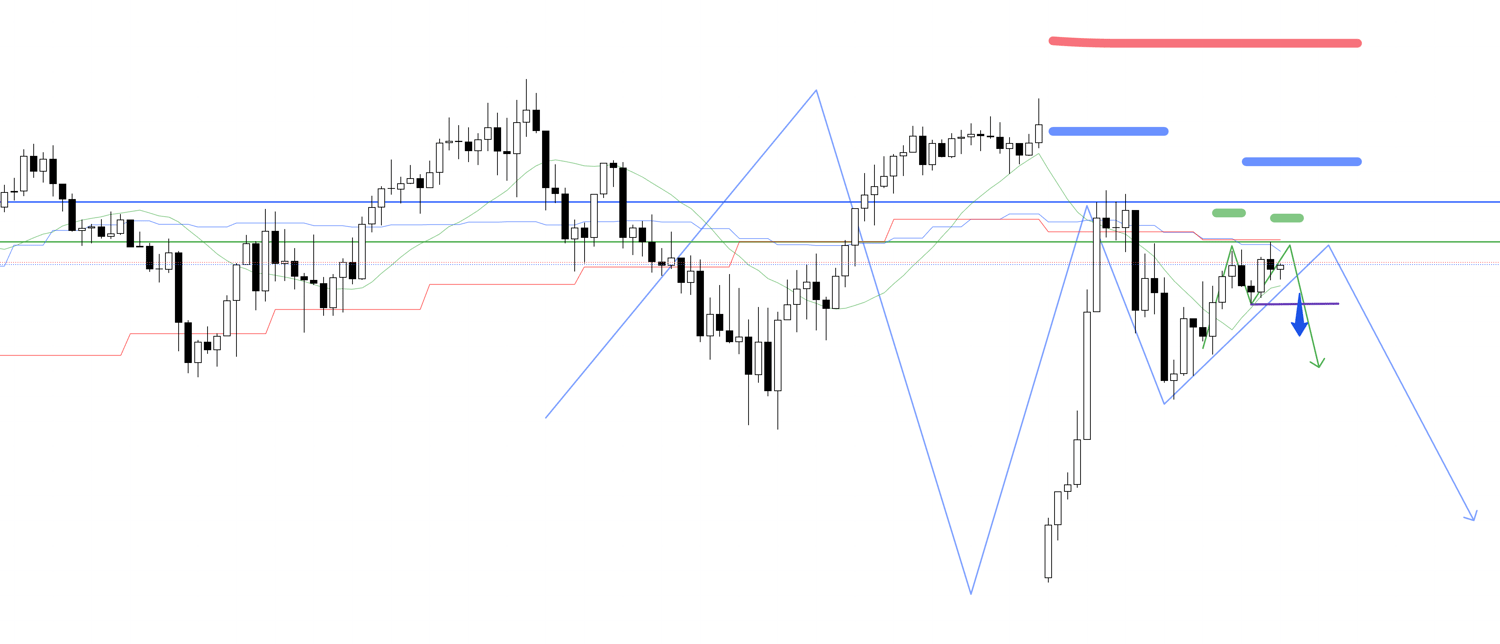
4h Chart
Looking at the 4h chart, there was both a scenario to wait for a pullback buy, like this, and a scenario to wait for a pullback sell, as shown below, and I was in a state of making a judgment while watching the lower timeframe's price action.
4h Chart
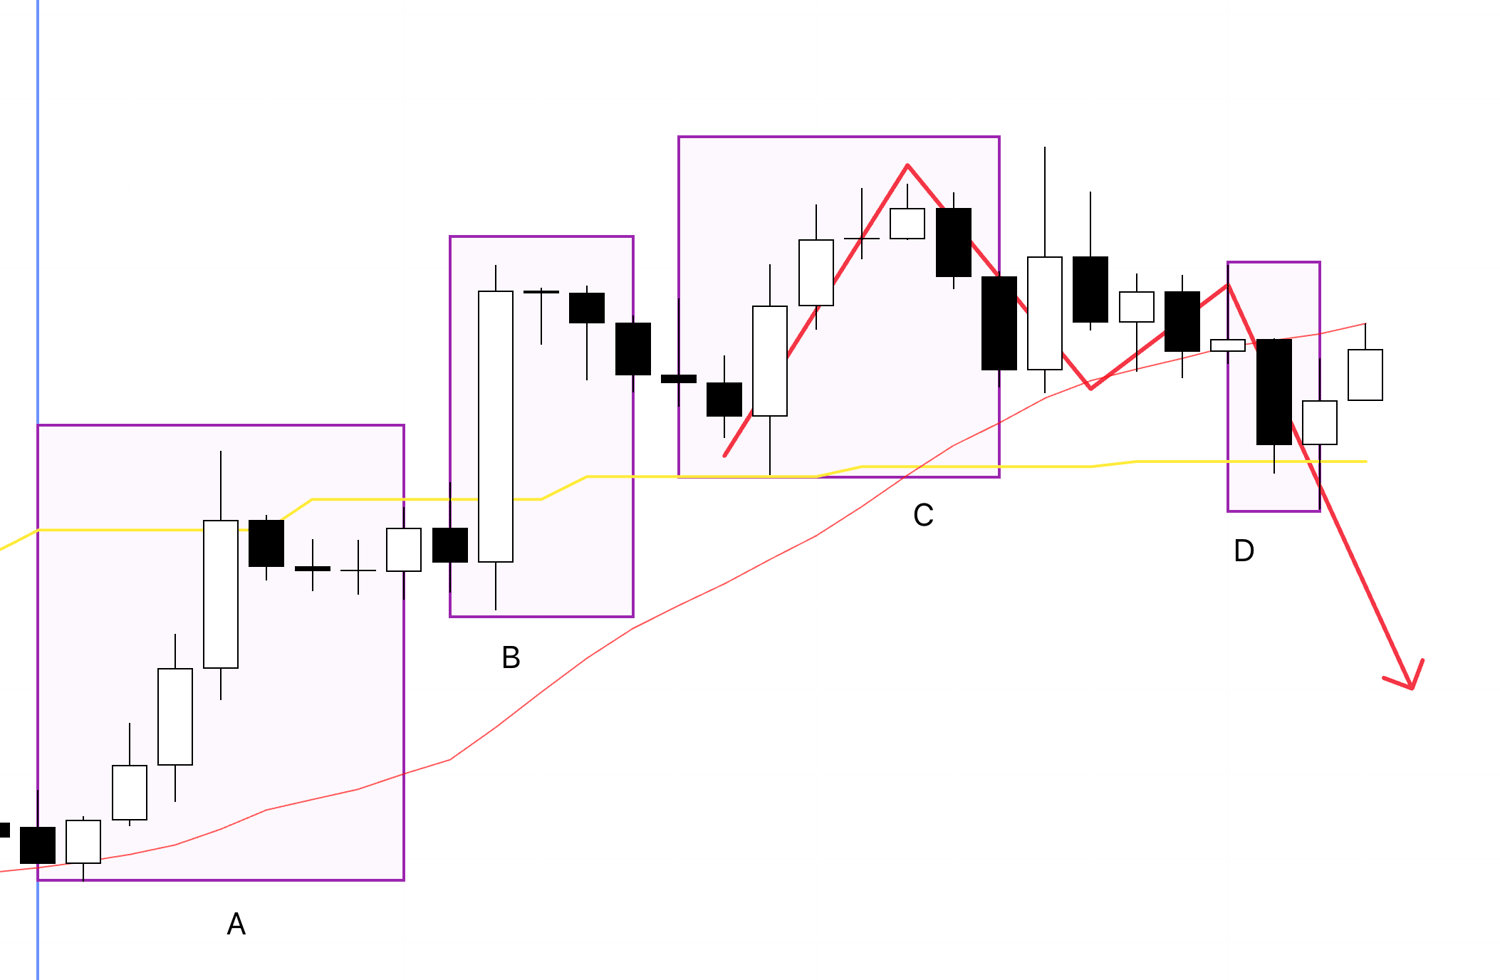
This is the sell scenario for when the price makes a lower high.
As I explained in last week's USDJPY trade, in such cases, it's important not to look at the chart with a bias towards one side, but to view the chart objectively and have both scenarios in mind.
In this case, it would be a point that breaks the ongoing 4h trend, so there is a high probability that sell-side edge will temporarily appear by triggering the stop-loss orders (sell orders) of 4h buy traders.
First, for the buy scenario, please see the 1h chart below.
1h Chart
For a buy, if the price started to form a higher low while being supported by support lines or moving averages, I was considering a trade on a lower timeframe like the 15m.
On the other hand, this is how I was thinking about the sell scenario in this situation.
1h Chart
However, this time too, the price made a new low without forming a lower high, so I was unable to trade.
If, as in this chart, it had been rejected by a resistance line like the one drawn in green on the 1h and created a lower high point, I would have considered a trade.
In that case, the daily chart would be forming a double top, and within that, a lower high point on the 4h would coincide with a lower high point on the 1h, increasing the edge for a decline.
Daily Chart
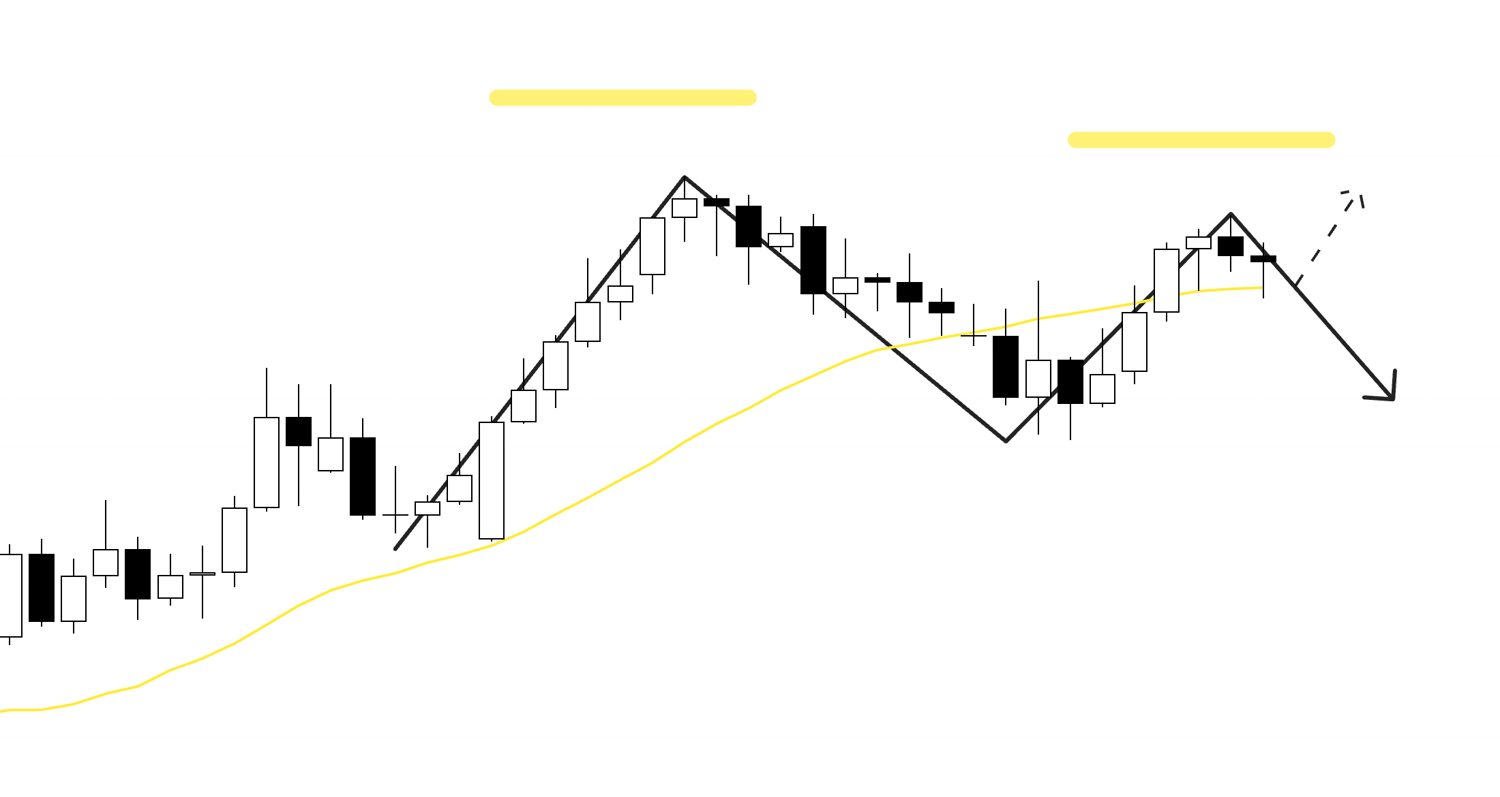
As the lower timeframes turn to a downtrend, the daily chart would form a double top.
However, it is still a bit early, so there are buy orders from those considering a pullback buy, as indicated by the dotted arrow.
Therefore, while I was waiting with both buy and sell scenarios, for the sell side, it wasn't a point to force a sell, but rather a crucial point to see if a clean chart pattern would appear, if it would be firmly rejected by a solid resistance, and if I could enter with a good risk/reward ratio to the support line or daily moving average immediately below.
In that case, my plan would have been something like taking half profits at the daily moving average and holding the rest until the trend broke.
By understanding in advance where and what kind of risks exist, it becomes possible to follow the trend while taking actions such as taking partial profits, considering the risk/reward to those points.
This area might seem very discretionary, but if you watch my trades many times, I think you will begin to see that I am always repeating the same judgments.
〜・〜・〜・〜・〜・〜・〜・〜・〜・〜・〜・〜・〜・〜・
That's all.
In the end, although there were several pullback buy and sell opportunities this week, the only trade I actually took was the one on USDJPY.
No matter how much the chart moves, you must not trade where you cannot according to your rules.
It's not good to feel regret or to think, "I could have traded if I had done this."
You cannot control the number of trades; that depends on the market.
What is important is to always repeat consistent trades with consistent judgment.
Your strategy's edge is brought out precisely because you execute the trades you are supposed to, when you are supposed to.
To commemorate the launch of this blog, this "Weekly Trade Report," which is regularly published every Saturday, will be available for free for the rest of this month.
In this report published every weekend, I summarize my thought process (entry, stop loss, take profit decisions, etc.
) recorded in real-time for the trades I actually took that week.
From August onwards, this Saturday "Weekly Trade Report" is scheduled to become paid content, so please take this opportunity to experience my real-time thinking.
Please note that these are provided for educational purposes only and are not intended to give you trading instructions, nor do they guarantee future profits.
You are responsible for any and all trades you make, so please spend adequate time on strategy development and testing, and approach trading at your own risk.
I hope that the explanation of my trend-following strategy will be a helpful reference for your own strategy development.