

Hello.
This "Trading Scenario" blog is scheduled to be posted "every week" on Sunday.
Then, every Saturday, I will post a "Weekly Trading Report" detailing how I thought about and executed my trades during that week.
By reading the Trading Scenario blog in conjunction with the report, I believe you can gain insight into the process of how I think beforehand, what I wait for, and how I execute.
For more on my strategy, please refer to the blog posts on Dow Theory and multi-timeframe analysis.
And this scenario is not a forecast.
It is not a forecast, but rather my trading plan of "if this happens, then I will do this."
I do not forecast the market, and this is not that kind of analysis, so please understand this in advance.
Furthermore, this is not intended to give you trading signals, nor does it guarantee future profits; it is provided for educational purposes, using my consistent process as a subject matter.
I cannot take any responsibility for the results of any trades you make, so please trade at your own risk.
Now, let's start by looking at USDJPY.
〜・〜・〜・〜・〜・〜・〜・〜・〜・〜・〜・〜・〜・〜・
USDJPY
First, please take a look at the following chart.
Daily Chart
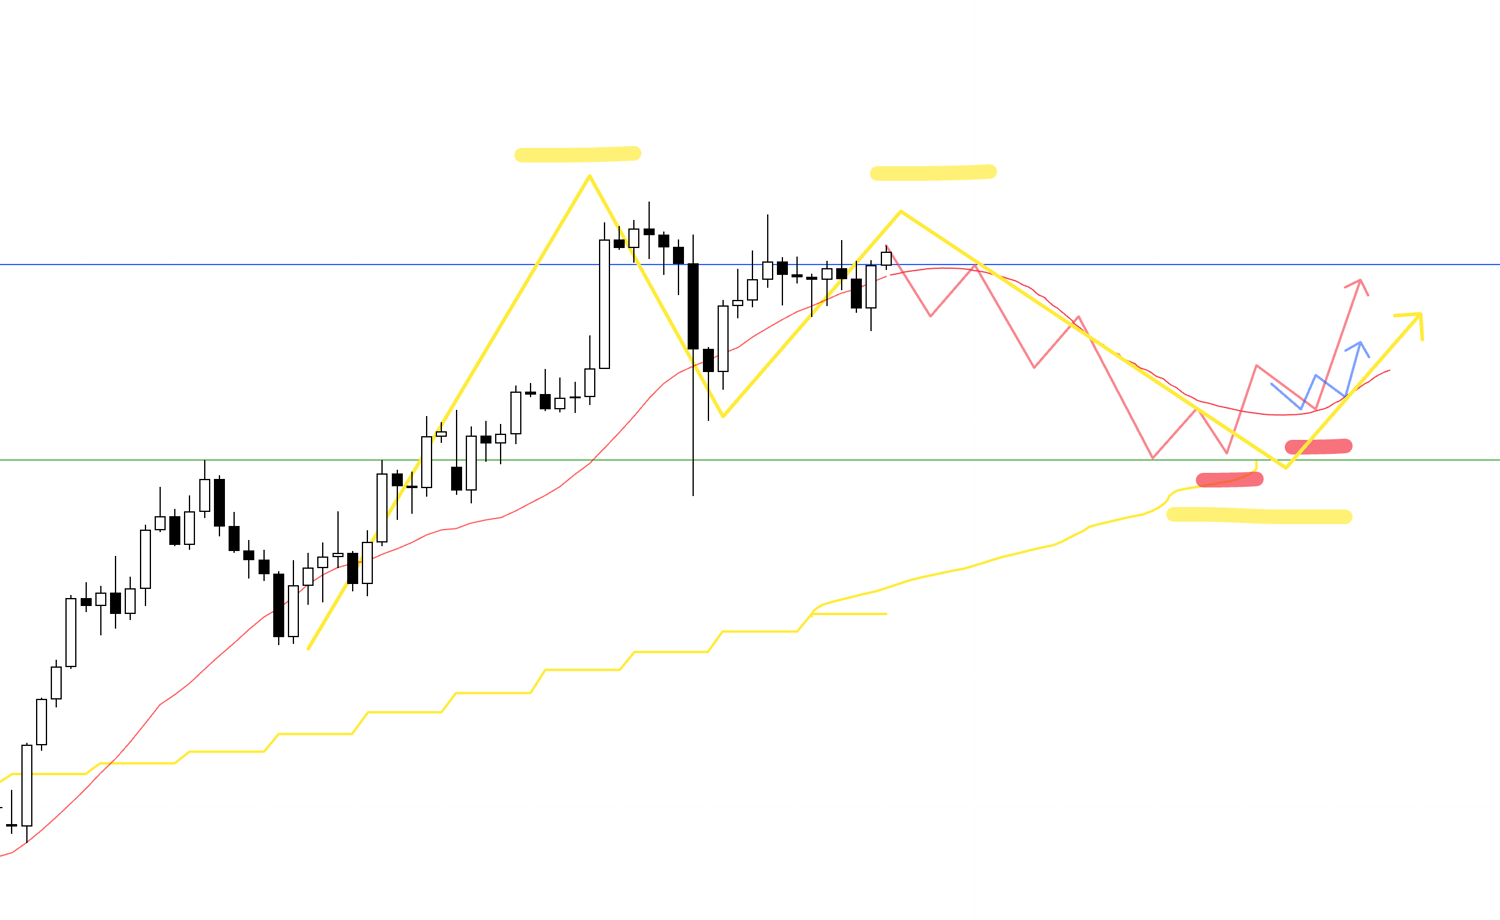
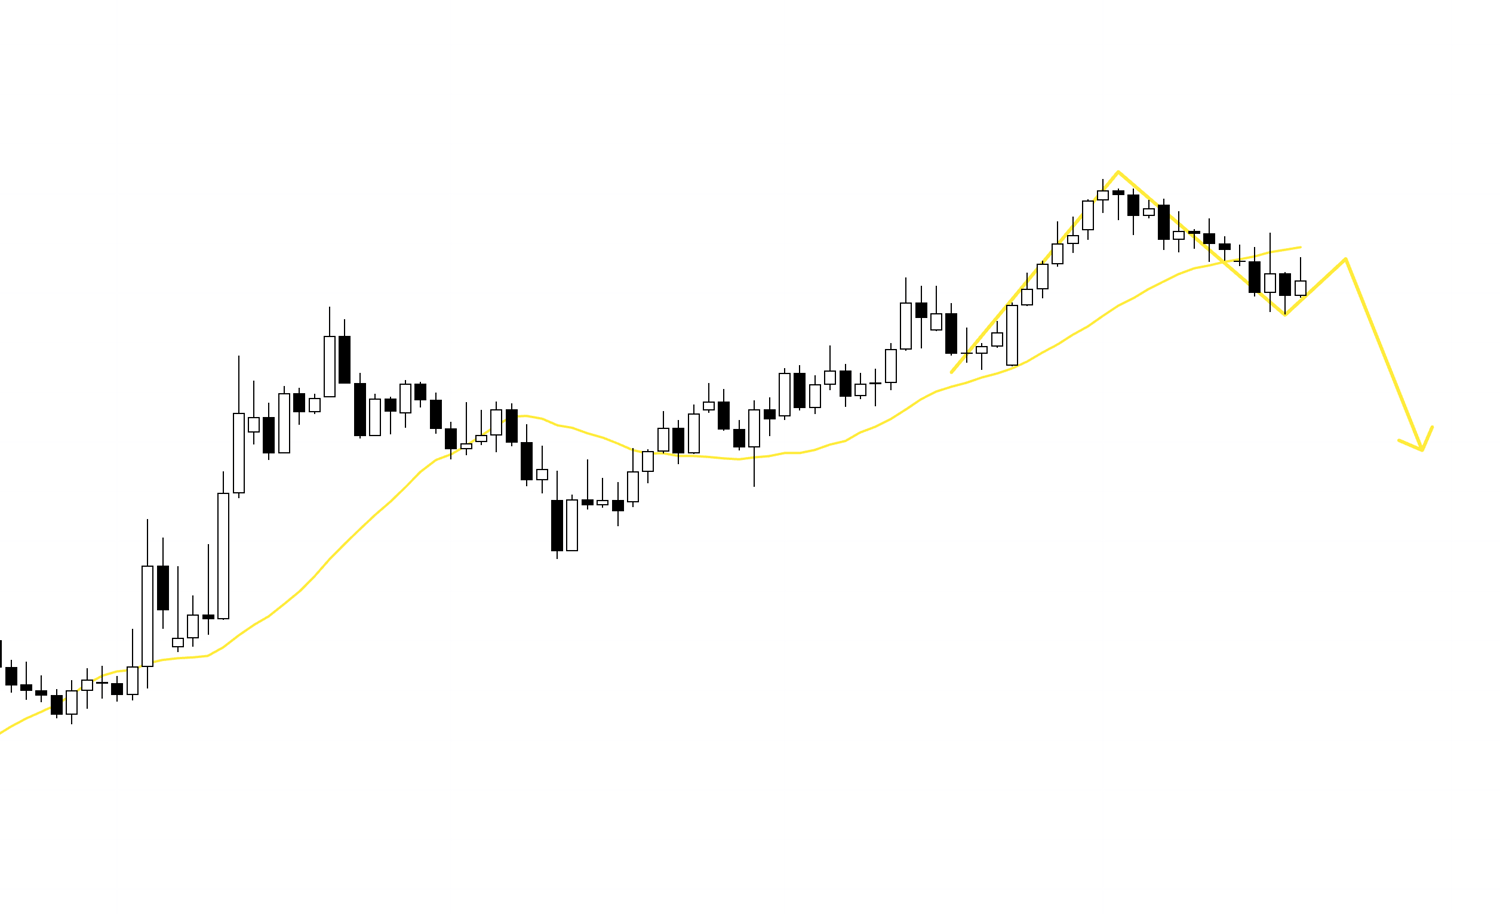
On the daily chart, the price has recently entered an uptrend, repeatedly making higher highs and higher lows.
However, looking at the weekly chart, which is one timeframe higher, the price is approaching a high where selling on a rally is likely to occur.
I have overlaid the weekly chart's movement onto this daily chart, drawing it in pink.
Currently, the price has slightly broken above the previous high, and it is important to have scenarios in place to react whichever way it moves, depending on its subsequent action.
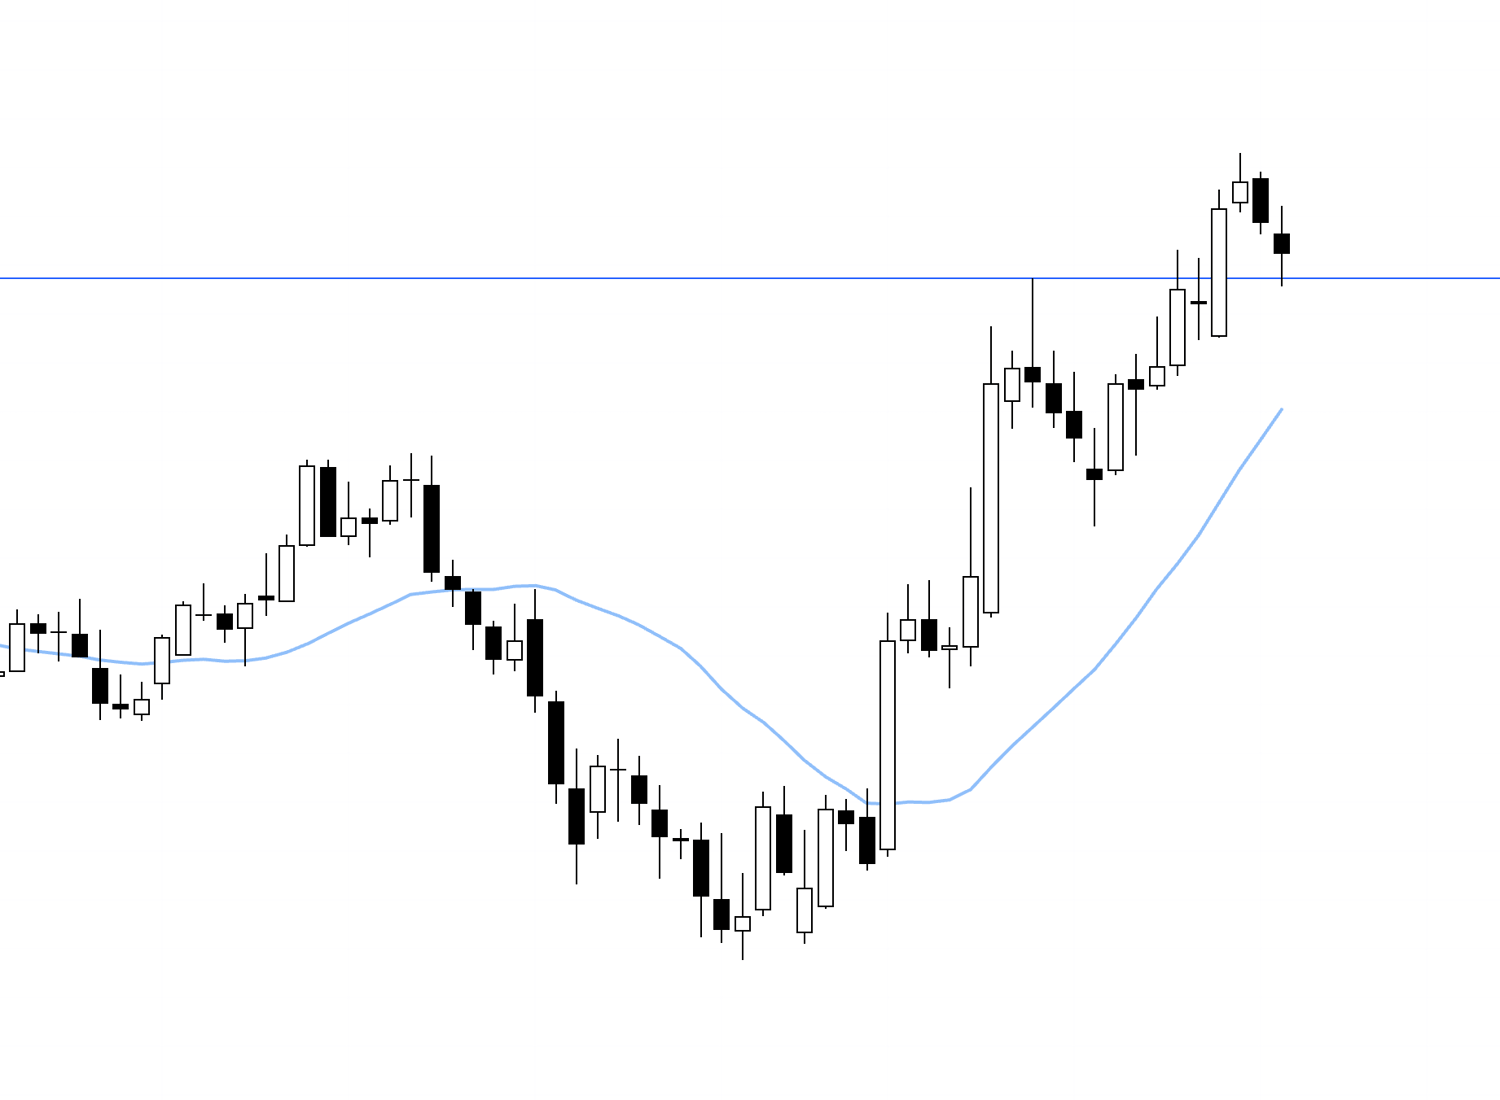
As I explained in yesterday's "Weekly Trading Report," the key point is whether the price can break above this blue line or if it will reverse once.
Now, let's look at the 4h chart.
4h Chart

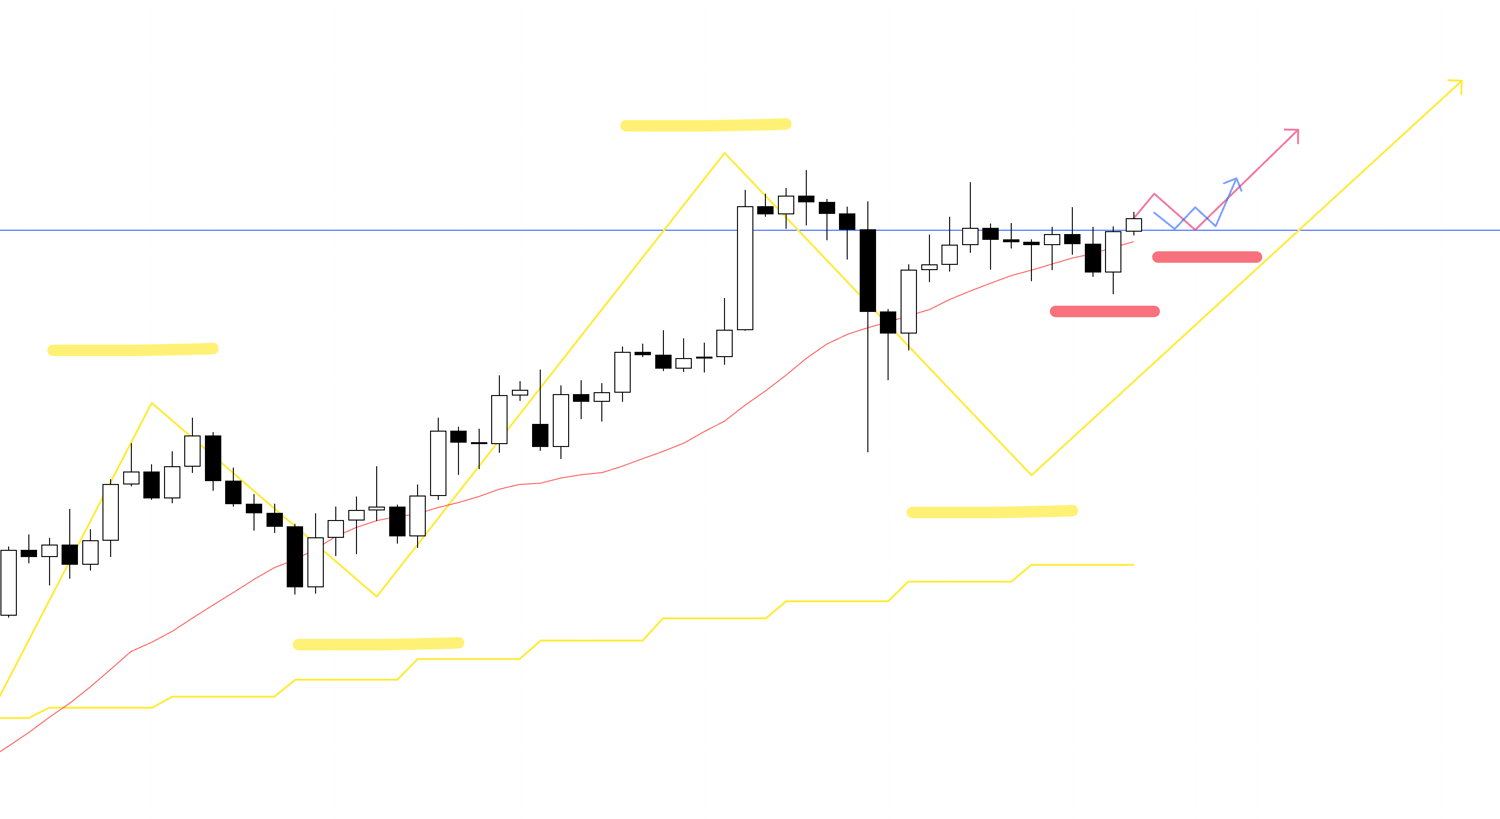
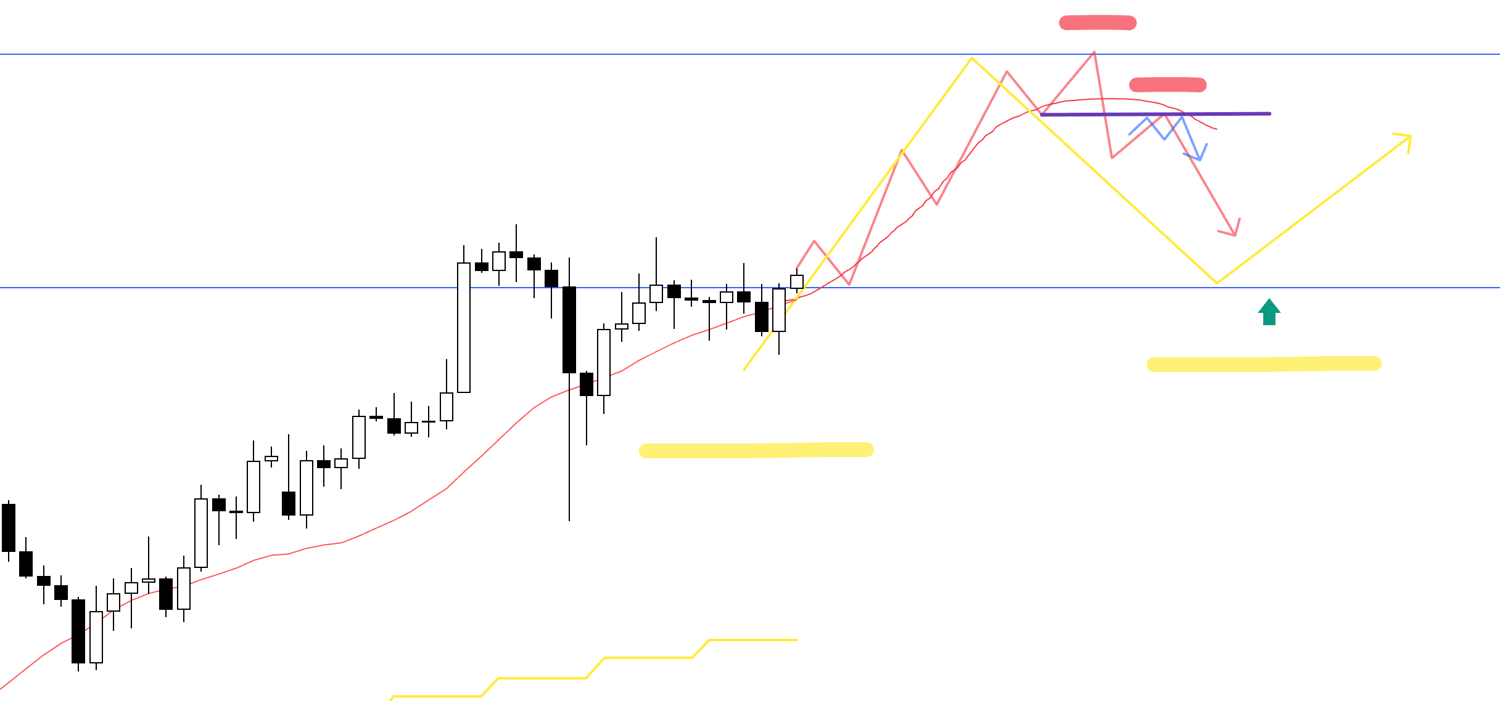
USDJPY is still continuing the uptrend on the daily chart.
If the price creates another higher low point on the 4h chart right on this blue line we were just looking at, I am planning to look for an entry timing on a lower timeframe like the 1h or 15m at a point where it forms a double bottom, or breaks a high and forms a higher low.
The yellow arrow represents the daily movement, red represents the 4h, and blue represents the 1h.
4h Chart
On the other hand, if the price is capped by the blue line like this and then starts to reverse on a lower timeframe like the 1h, I am thinking of trend-following the trend reversal point within the daily chart's double top formation.
However, in that case, the daily chart has not yet broken its uptrend, so there is a risk that buying pressure will increase the further the price drops.
Please see below.
Daily Chart
As shown here, even if the daily chart forms a double top at the weekly's selling-the-rally point and makes a temporary decline, that decline will be a dip within the daily uptrend. Therefore, the lower it goes, the higher the buying pressure becomes, so the key point will be whether a situation emerges where I can initiate a sell from as high a price as possible.
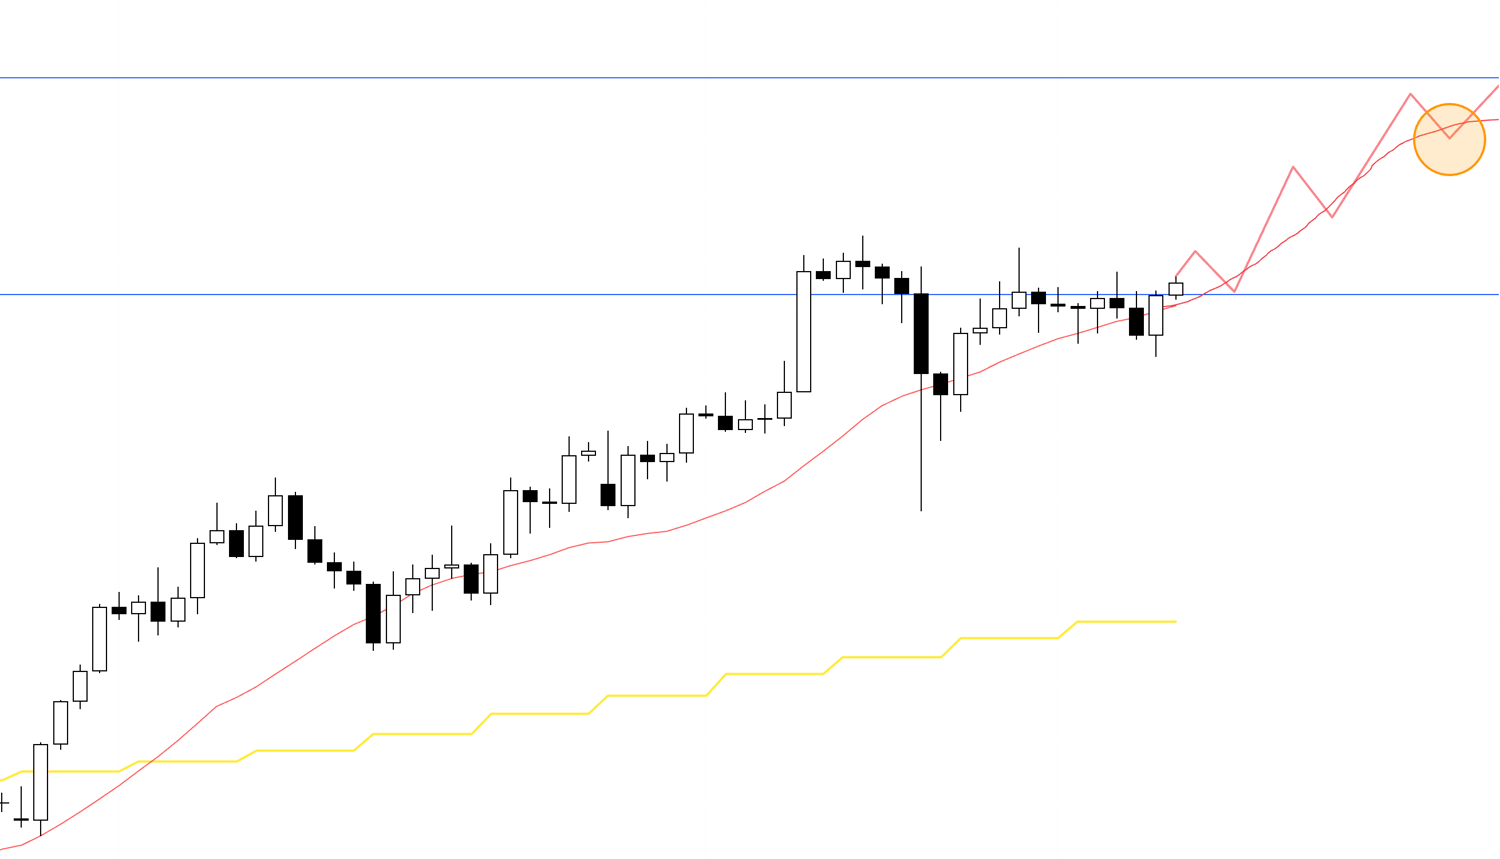
After that, when considering a buy, the initial move of a new 4h uptrend that ends the temporary downtrend and acts as a dip-buy on the daily chart would be a high-edge point.
4h Chart
For example, if a situation arises where the 4h downtrend ends at a daily dip-buy point and a new uptrend is formed like this, I will then consider an entry on a lower timeframe like the 1h.
This point would be a 1h dip-buy within a 4h dip-buy within a daily dip-buy, making it a very high-edge buying point.
However, in this case as well, the blue line of the weekly's selling-the-rally point is still directly above, so the key will be whether the risk/reward to that point is favorable.
Depending on that risk and the price action, I will decide whether to trade on the 15m or the 1h.
Next, let's consider points for selling after a rise.
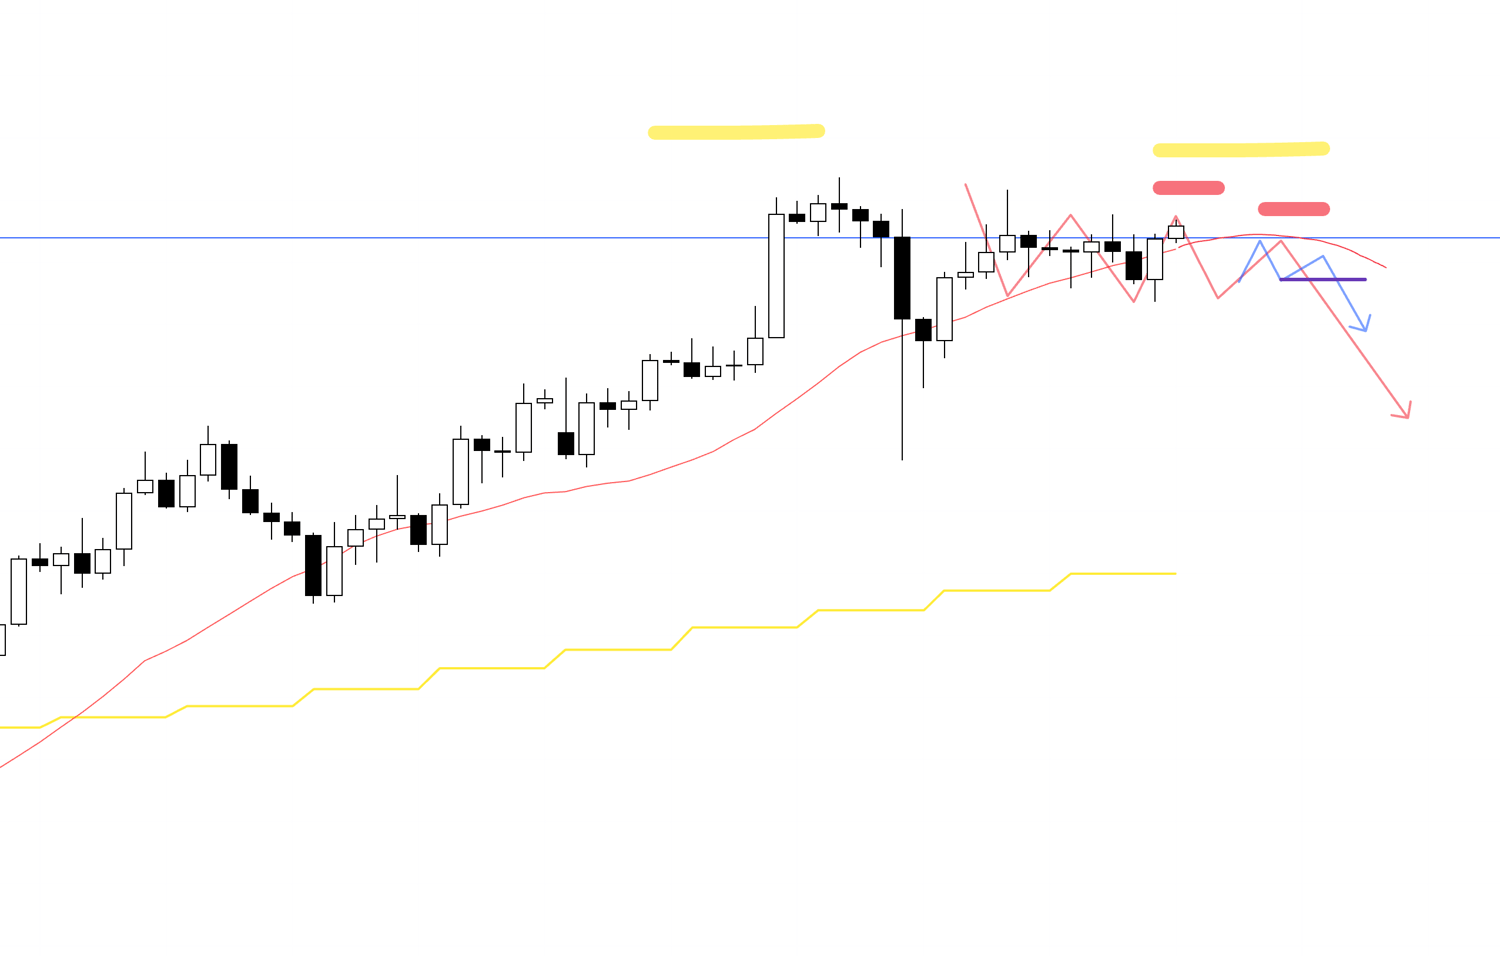
4h Chart
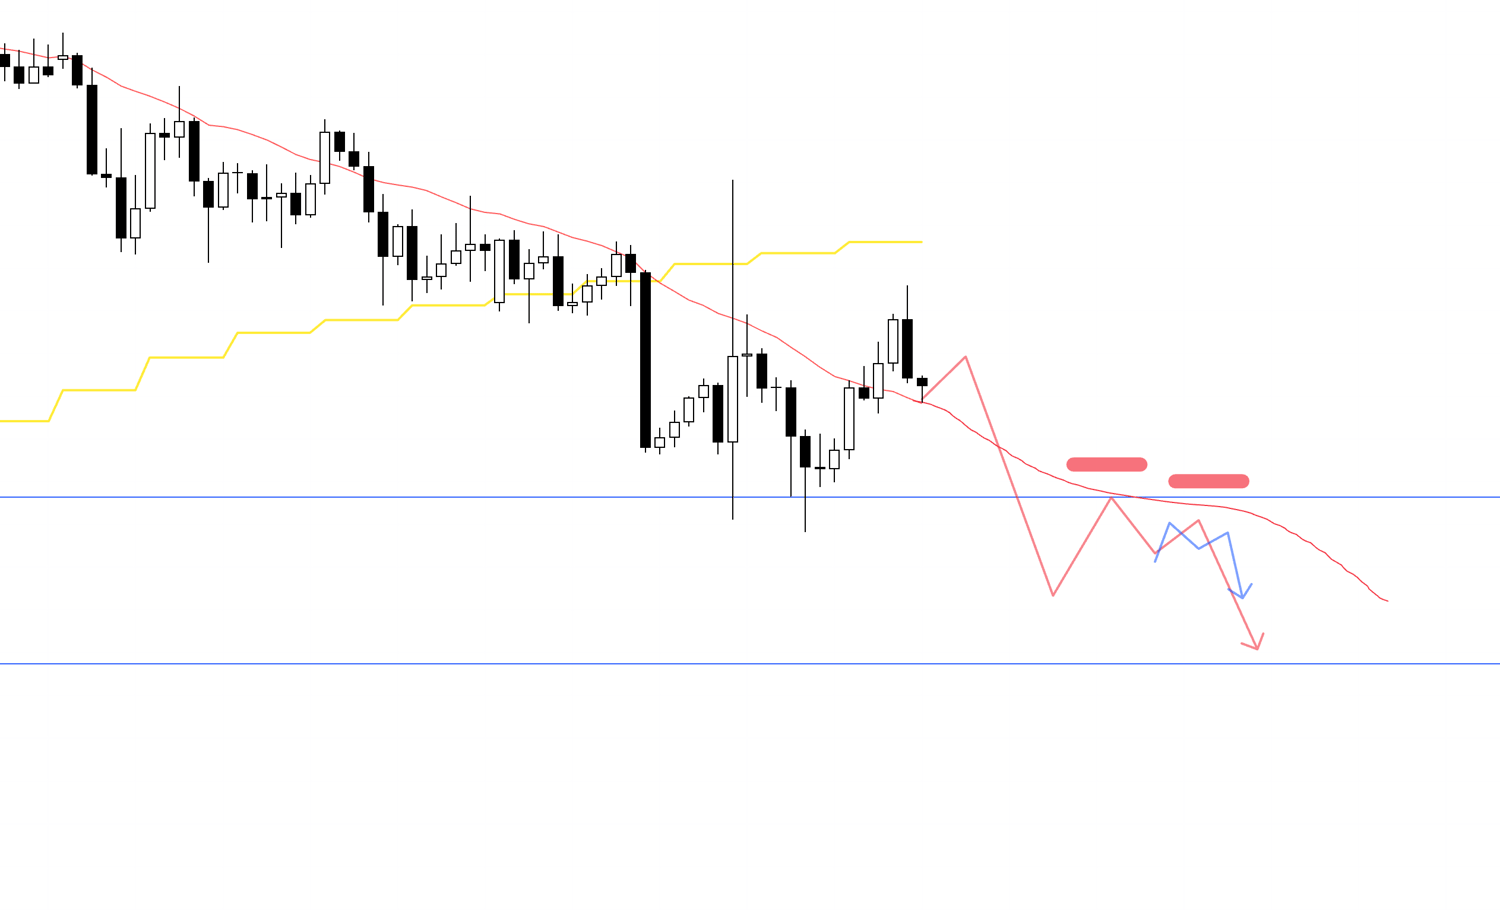
If, after another rise from the start of the week, the price is stopped by a line drawn from a clear past high and shows a development of making a lower high, I plan to catch the reversal on the 1h timeframe and follow the new downtrend, riding the wave of profit-taking sell orders from the preceding 4h uptrend.
In this case, on the daily chart, the price has broken above the high and confirmed the continuation of the uptrend, so there is a risk that buying on dips will become a factor on any decline.
Therefore, the key point is whether I can initiate a sell from a high price point.
However, this doesn't mean you should sell immediately from a high just because the price has touched the upper blue line.
4h Chart
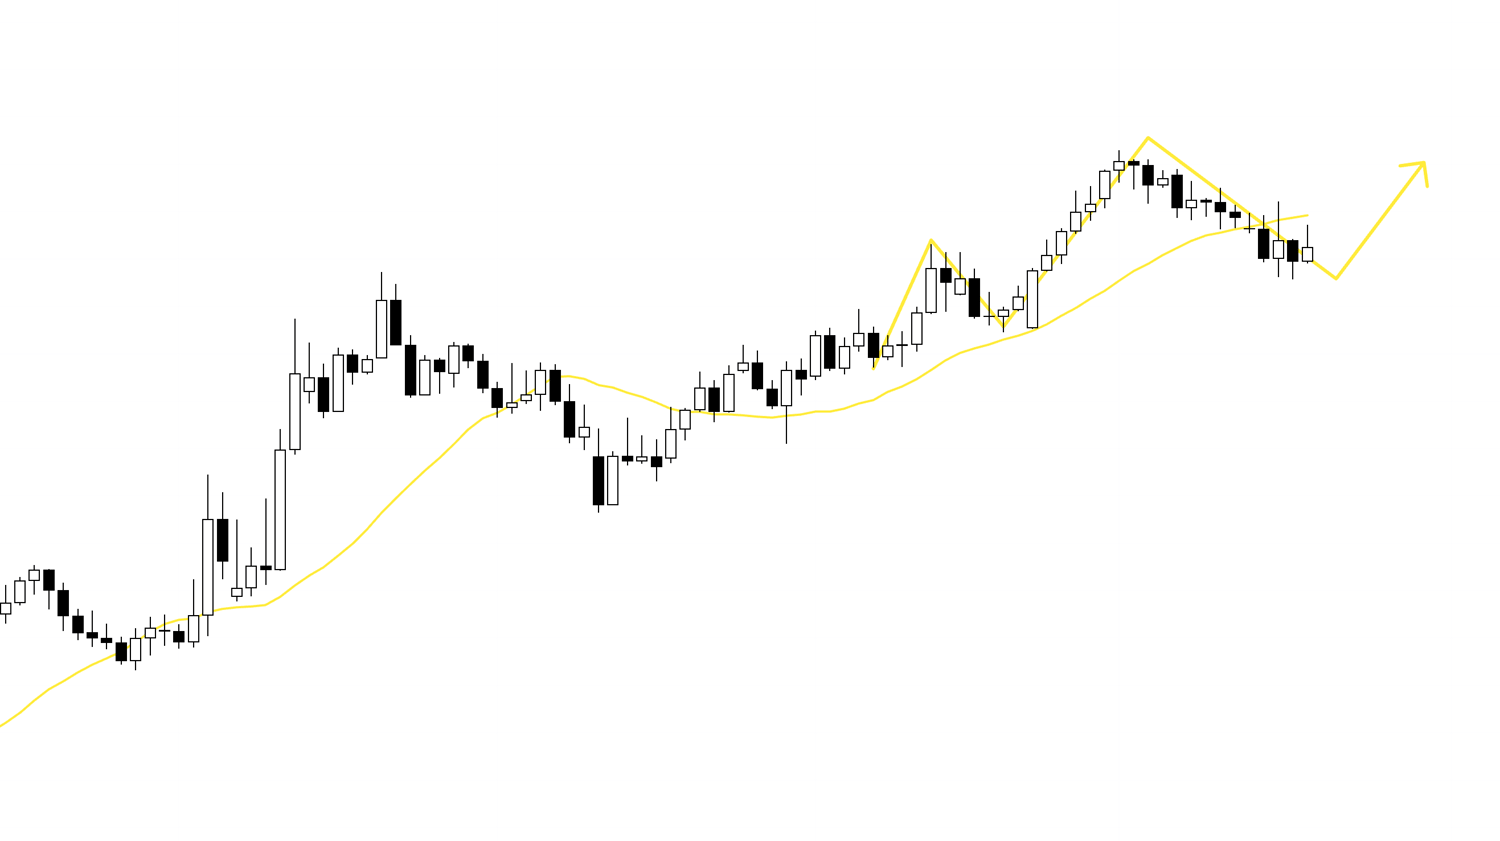
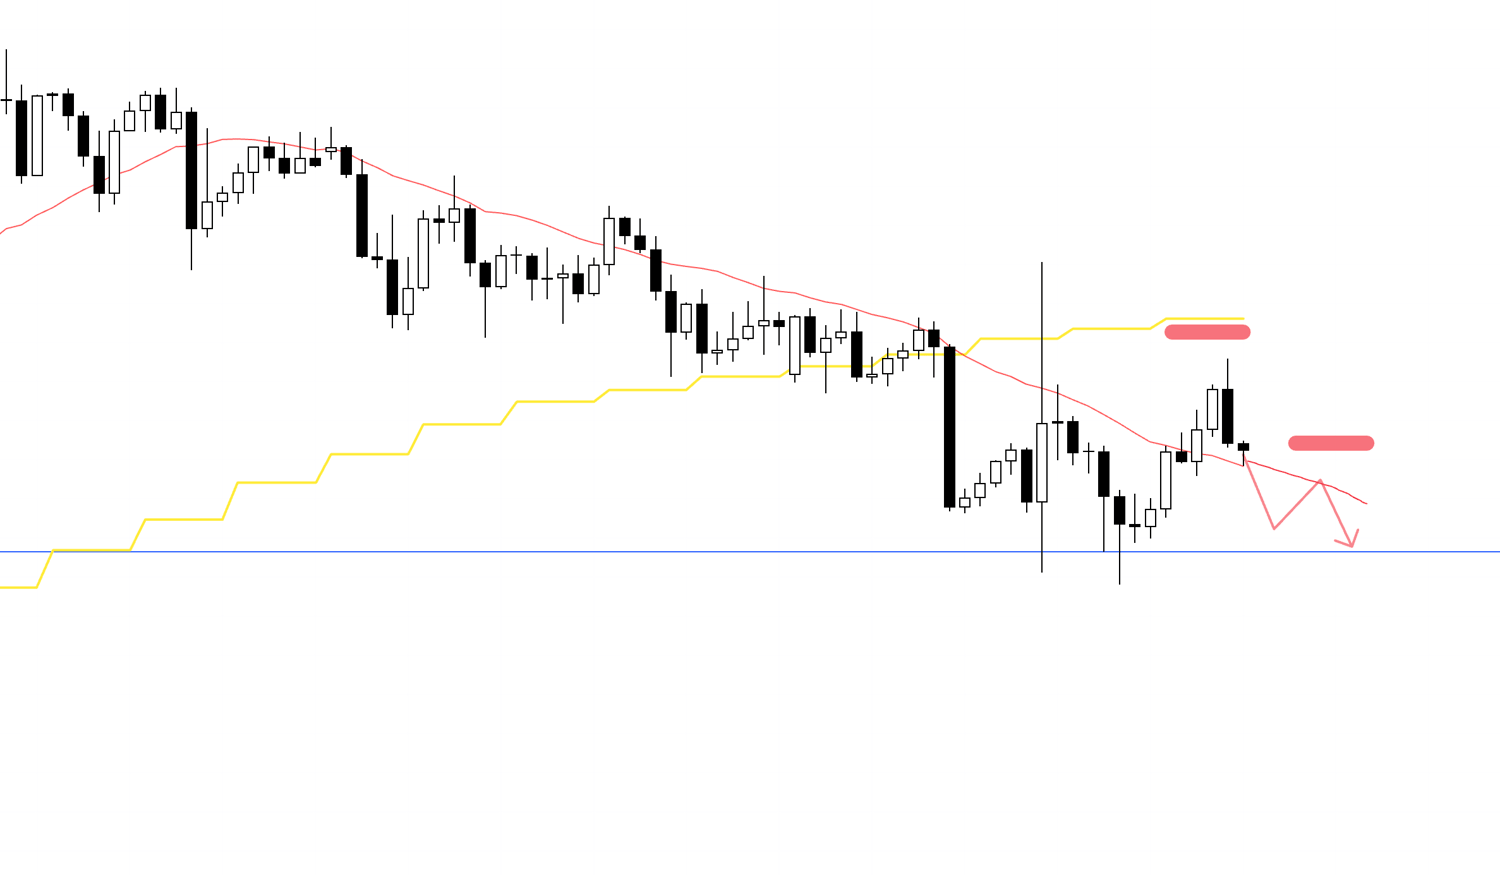
For example, at this previous point here, it was still a dip in the 4h uptrend, and the red 20-period moving average was also supporting from below, so I cannot sell immediately from here.
4h Chart

It is crucial to wait for the price to first create a lower high point like this, and for a setup where it breaks below the moving average and is then capped by it from above, or for an entry where it breaks below a flattening moving average.
That is all.
In reality, I update or build new scenarios daily according to the chart's movement, so I will explain what trades I actually took in Saturday's "Weekly Trading Report."
Next, let's look at EURUSD.
〜・〜・〜・〜・〜・〜・〜・〜・〜・〜・〜・〜・〜・〜・
EURUSD
Daily Chart
On the daily chart, this looks like a dip in an uptrend, but it also appears as if it might be forming a lower high as the price has dipped below the 20-period moving average.
Daily Chart
I will consider several scenarios depending on how the chart moves from here: whether it will form a lower high and create a new downtrend from profit-taking sell orders of the previous uptrend.
If we look at this daily chart on the weekly timeframe, it is as follows.
Weekly Chart
On the weekly chart, a point that is likely to be seen as a dip-buy is approaching, and we need to see how the price reacts at this blue line drawn from the previous high.
Now, let's look at the 4h chart with those risks in mind.
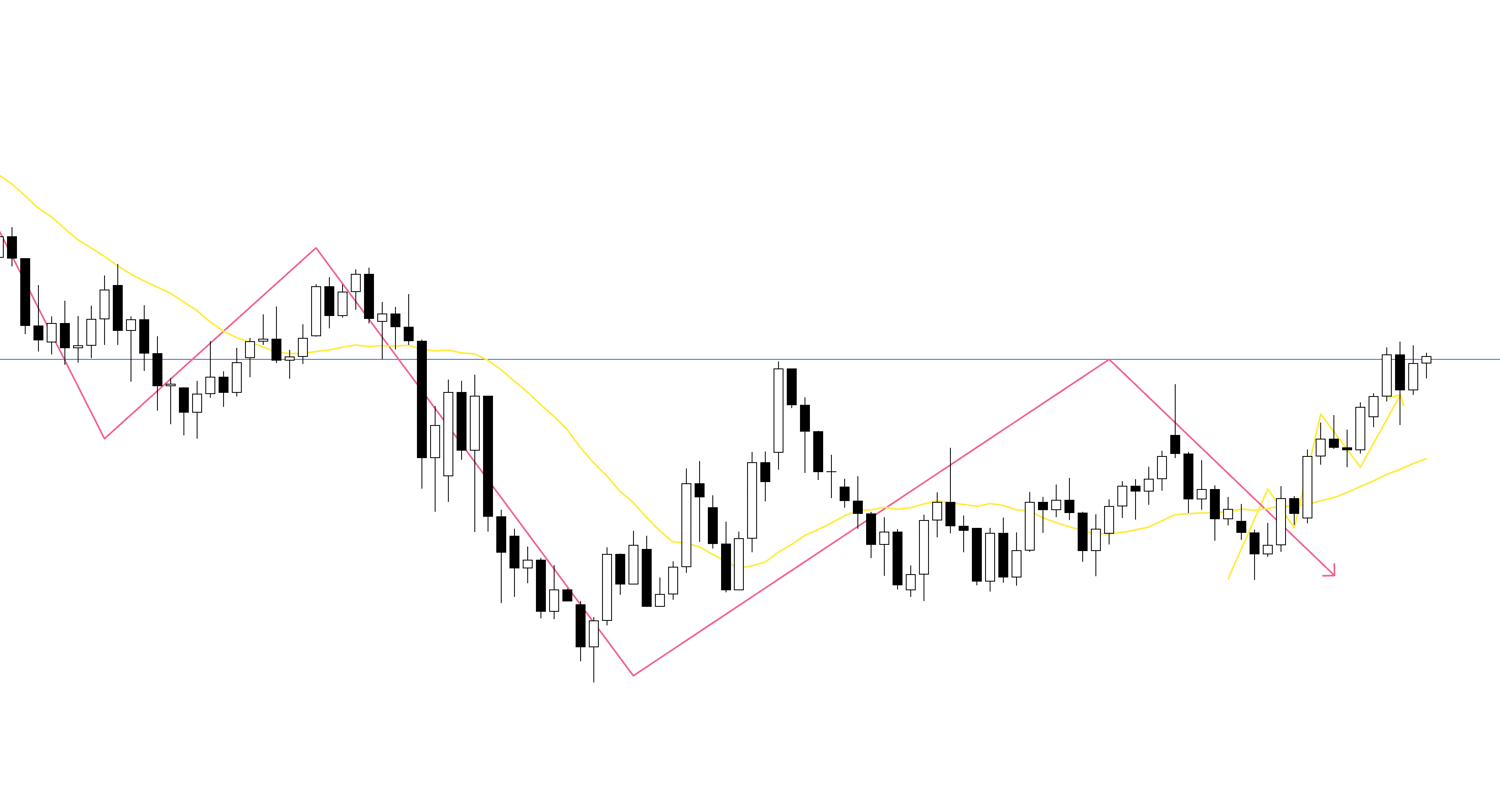
4h Chart
Considering the aforementioned weekly dip-buy points, even if the price forms a lower high on the 4h like this, I want to avoid selling around this area as much as possible because both buy and sell orders are likely to be mixed, and price action on lower timeframes can easily become choppy.
I will consider this area while looking at how the risk/reward pans out.
If the price breaks below this line once and is then capped by it again, I will consider a sell.
4h Chart
For example, if the price breaks below the blue line once and then forms a lower high as if being capped again, I will consider a sell within that formation on the 1h or another timeframe.
However, even in this case, the risk of a weekly dip-buy still remains, and I also recognize the other blue line drawn just below it as a line to be cautious of.
Therefore, I would like to consider this sell only after thinking about whether the risk/reward is favorable at the time of entry.
Next, let's look at a buy scenario.
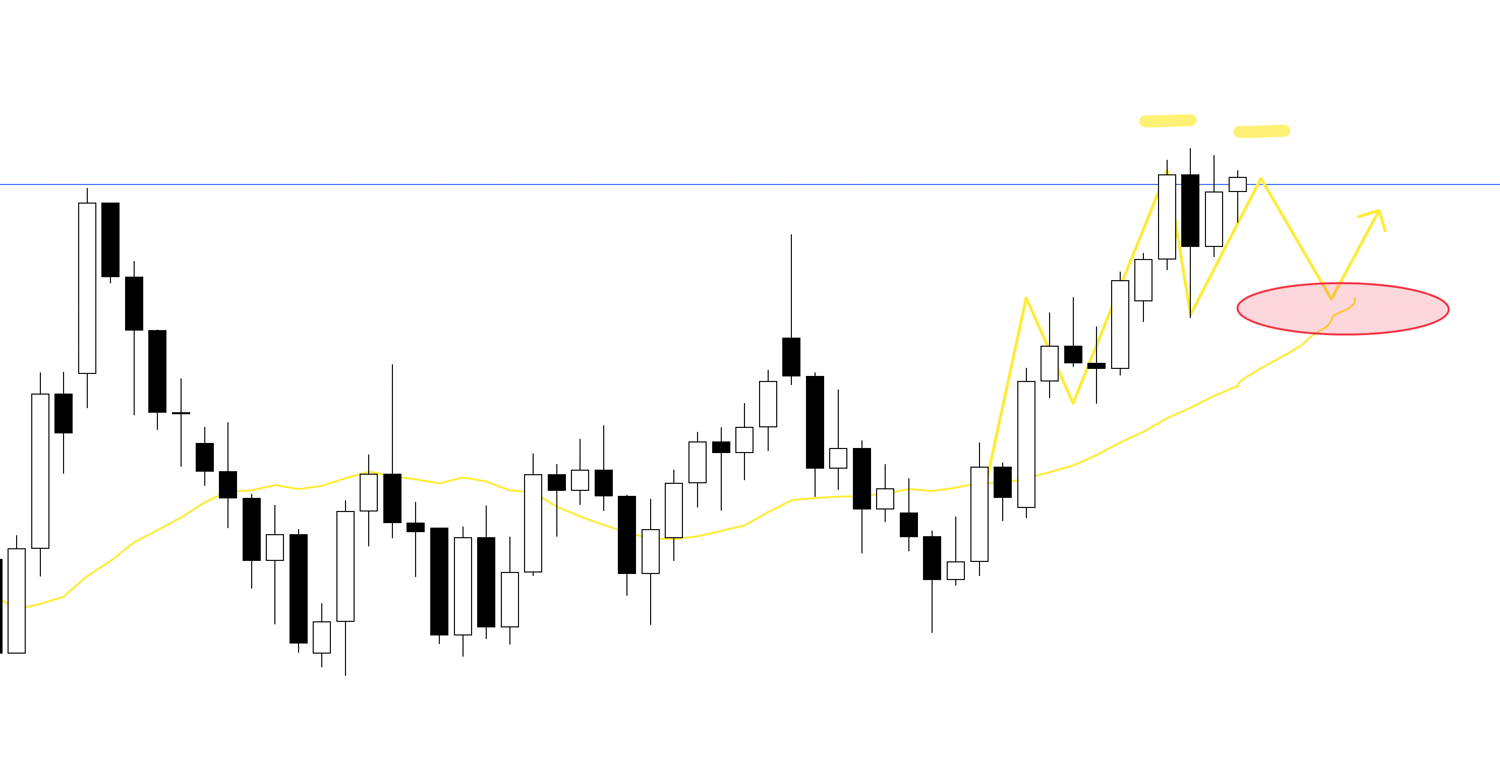
4h Chart
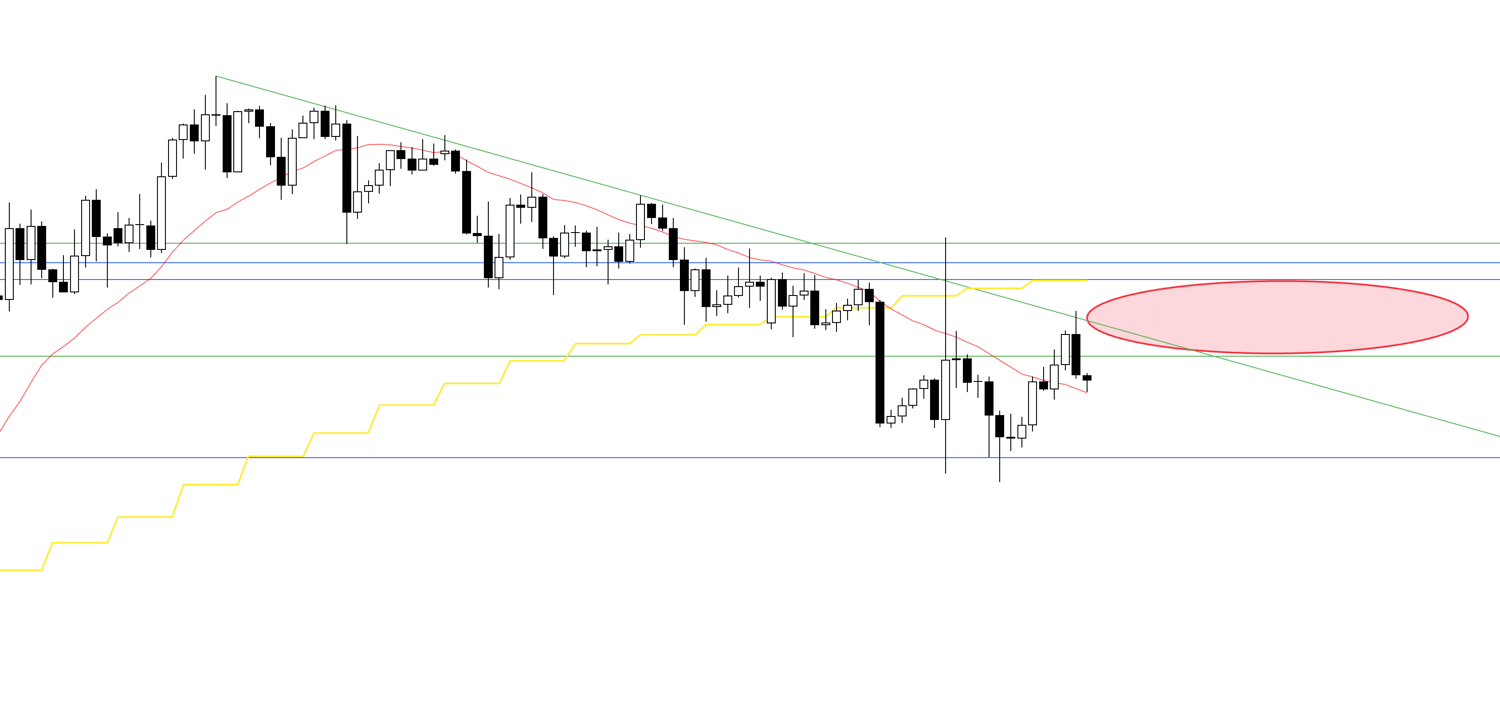
As I mentioned in last week's scenario, I do not want to trade in the area circled in red.
This is because recently, the price has broken below the daily moving average, which is now starting to act as resistance from above, and it is a point where buy and sell orders are mixed, making the price action on lower timeframes likely to get choppy.
Therefore, to consider a buy, I would like to wait for the price to break above an area like this and form a new dip.
4h Chart
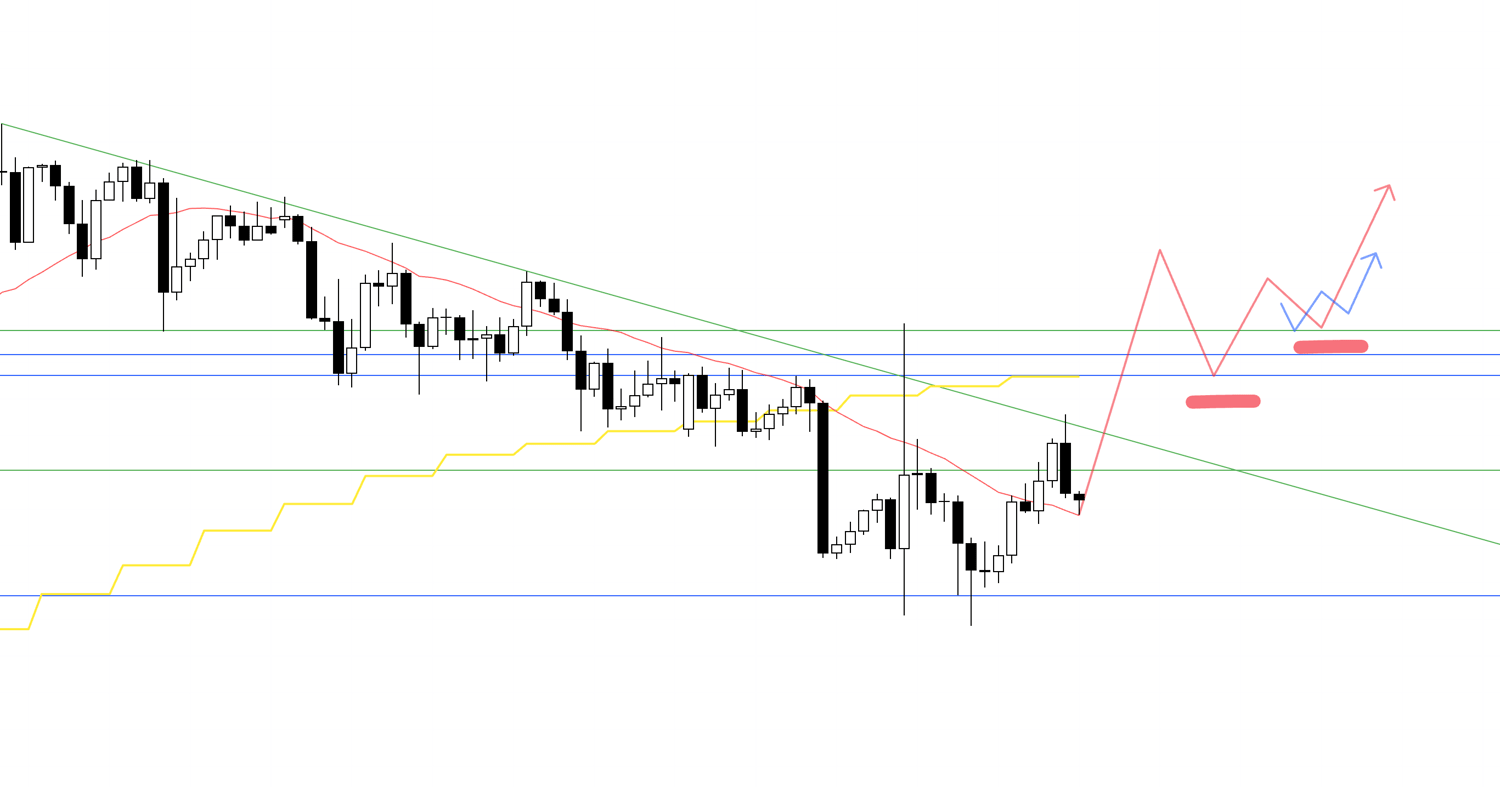
For example, if the price first breaks out of this high-risk area of mixed orders and then shows a higher low on the 4h chart as if being supported by some line, I will consider an entry on a lower timeframe like the 1h at a point where it forms a double bottom, or a higher high while making a higher low.
That is all.
For this pair as well, I plan to update and build scenarios each time while watching how the price action develops after the week begins.
〜・〜・〜・〜・〜・〜・〜・〜・〜・〜・〜・〜・〜・〜・
Regarding EURUSD, it is currently a situation where there is risk in immediately buying or selling.
The important thing is not to think about "how can I possibly trade" in a place you perceive as high-risk and difficult, but rather to not trade in such situations and instead repeatedly trade only in "easy to understand," clear situations.
It is precisely because you can grasp the risks in advance that you can formulate a scenario like this and "wait."
You cannot understand the risks by looking at a chart of only a single timeframe, so it is crucial to view the charts on multiple timeframes and judge from multiple perspectives whether traders on other timeframes are waiting to buy next.
I hope this serves as a good reference.
This is strictly my personal trading plan, so if you are someone who has not yet established a trading method, I hope you can use it as a reference for building your own strategy. However, if you already have a solid trading style of your own, please do not be swayed by my trading plan and stick strictly to your own rules.
Thank you for reading to the end.