

I will review the key points of my trades, focusing on the ones I took this week.
I will be posting this "Weekly Trade Report" every Saturday.
If you read it as a set with the "Trade Scenario" that I post every Sunday, I believe you can get a better idea of how I think in advance and how I actually trade based on the scenario.
Now, please take a look at the following chart.
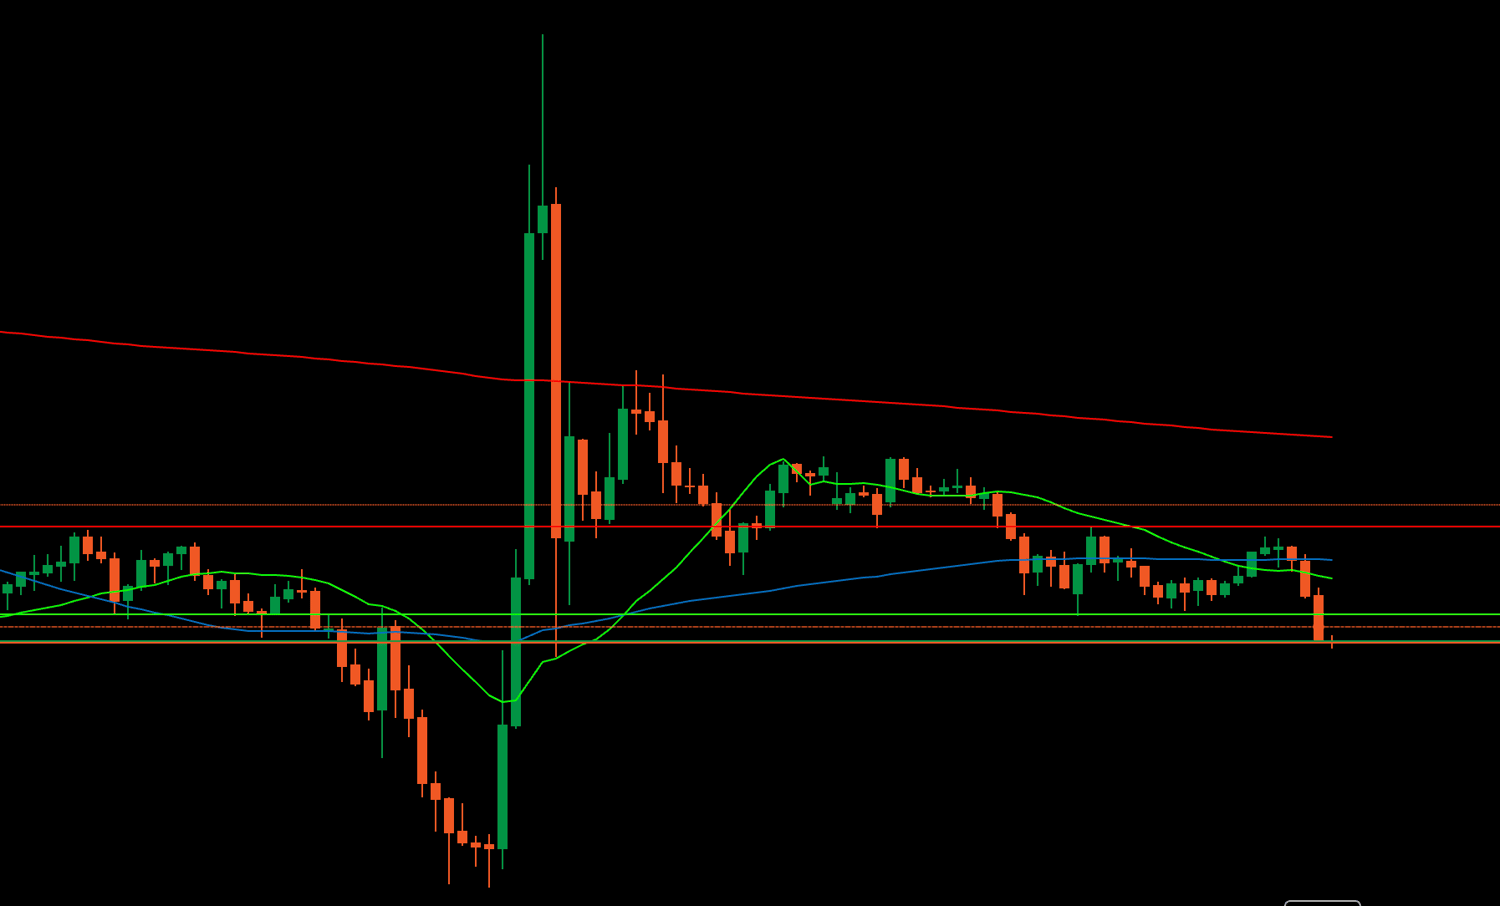
4h chart

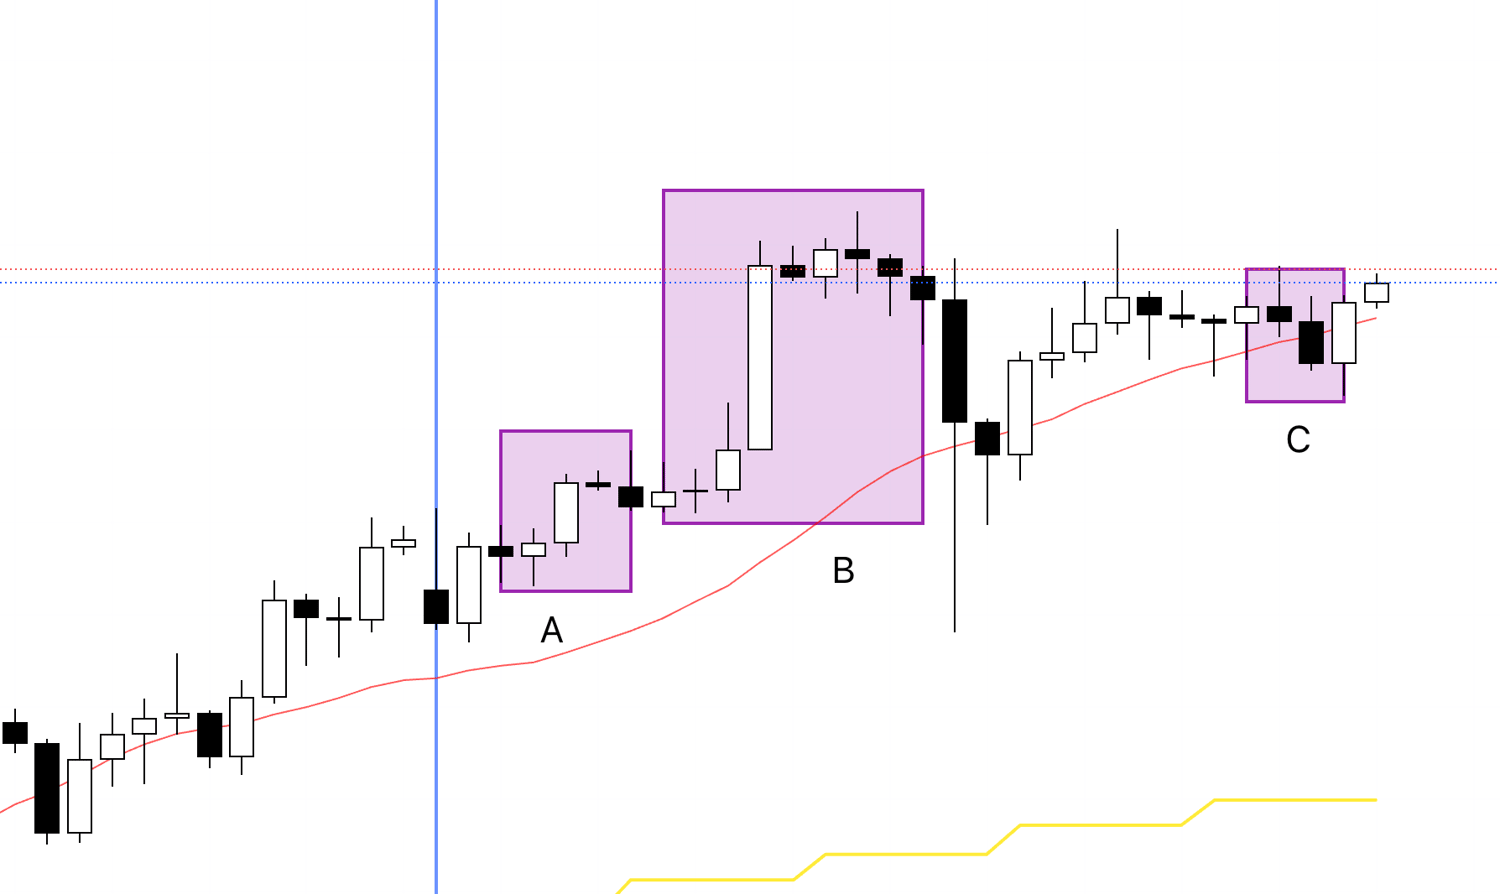
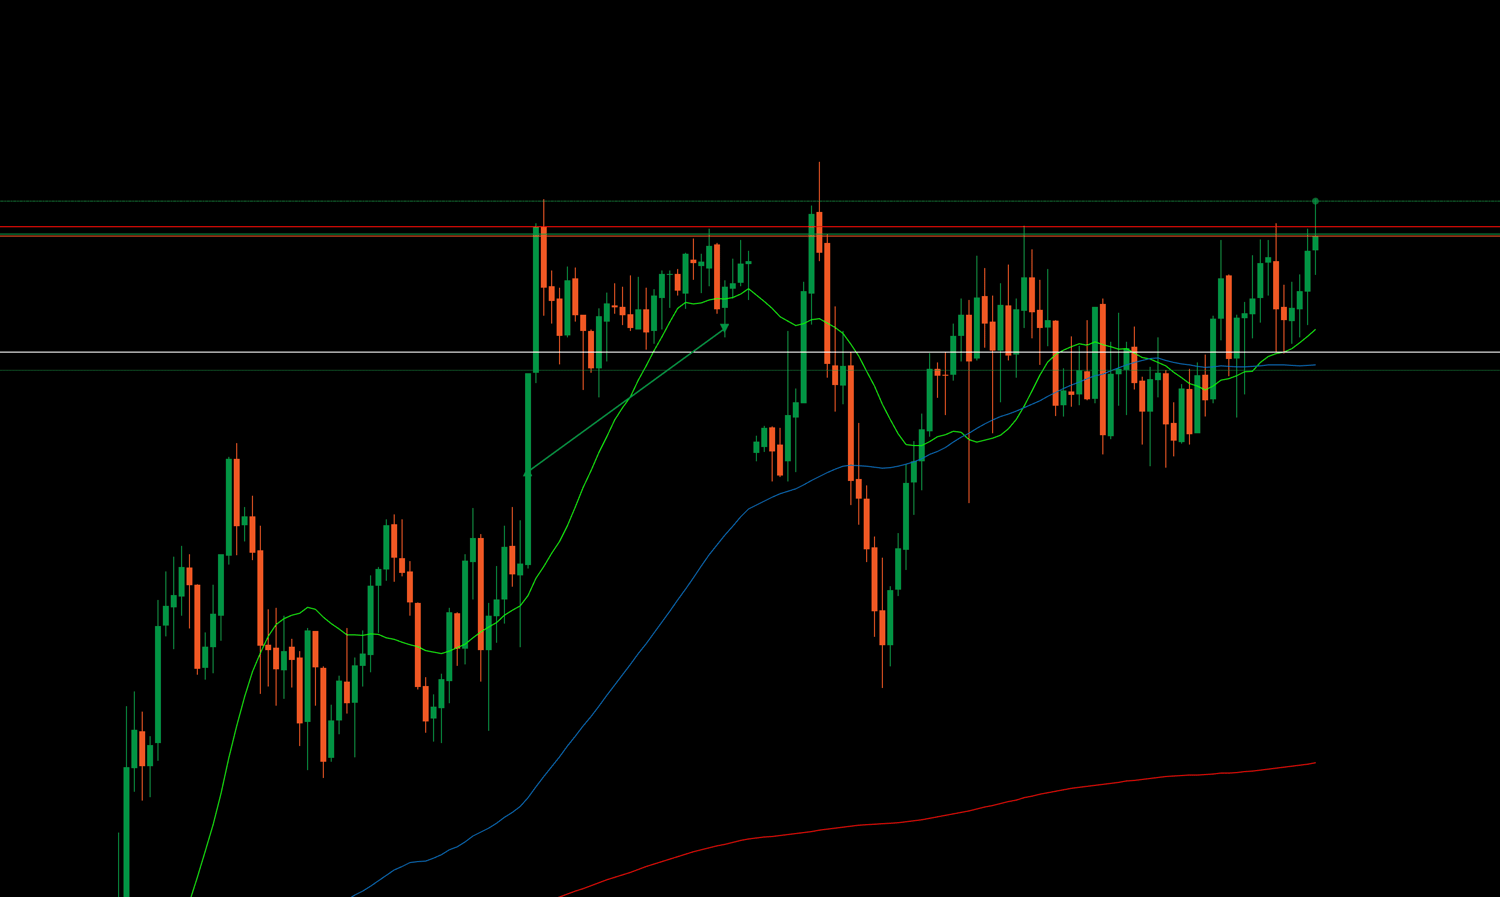
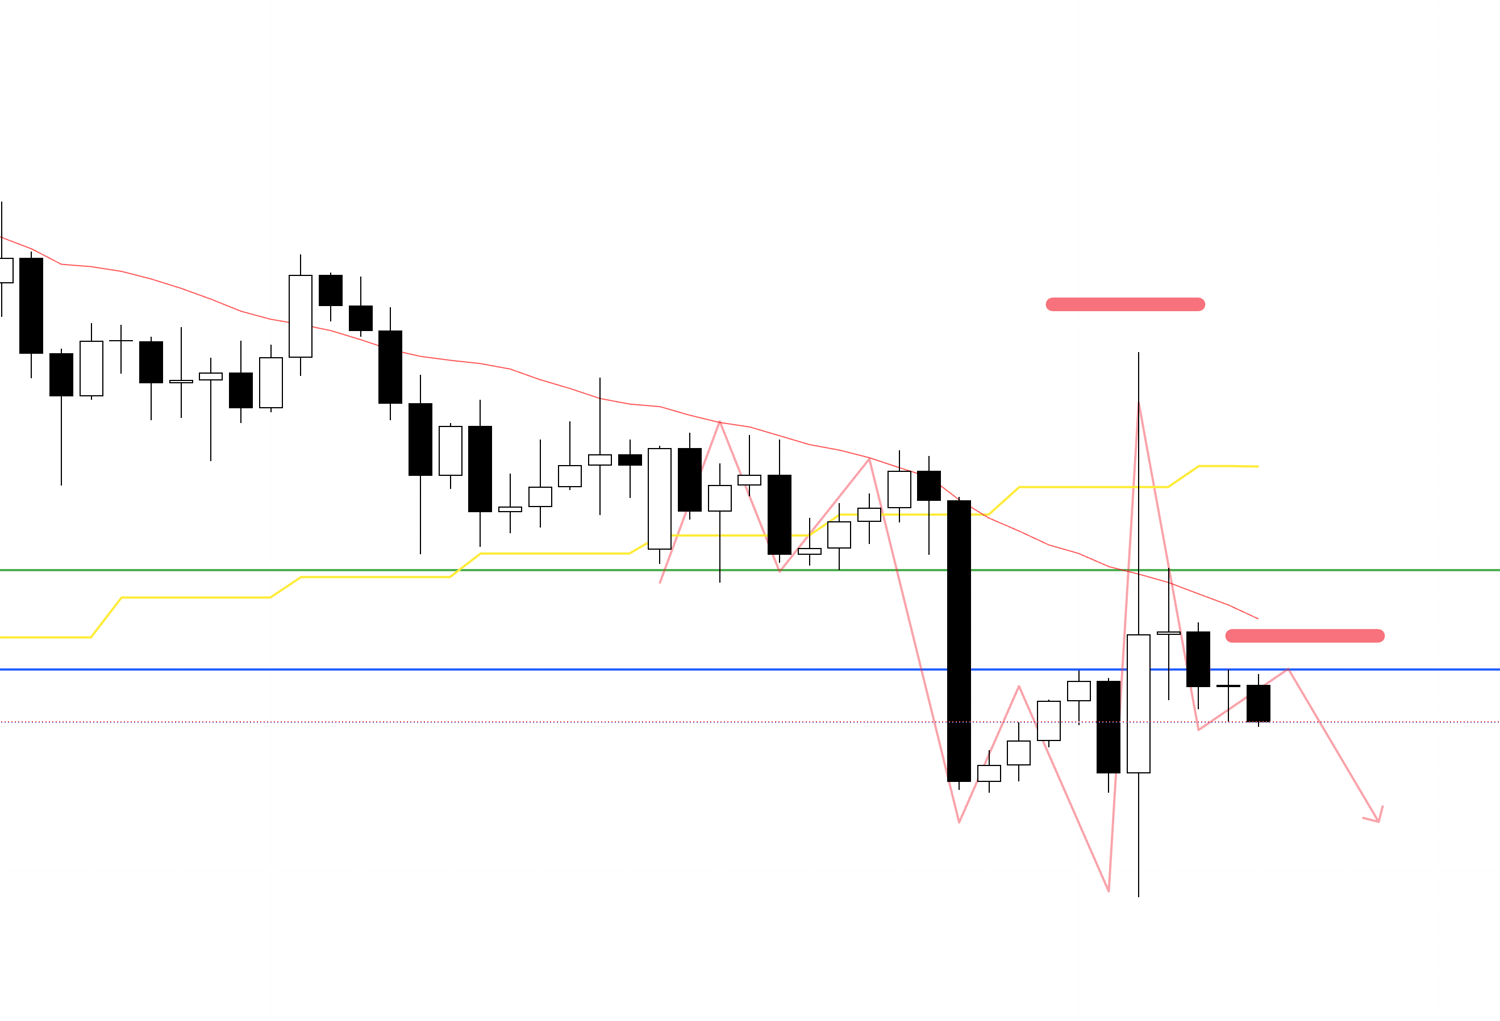
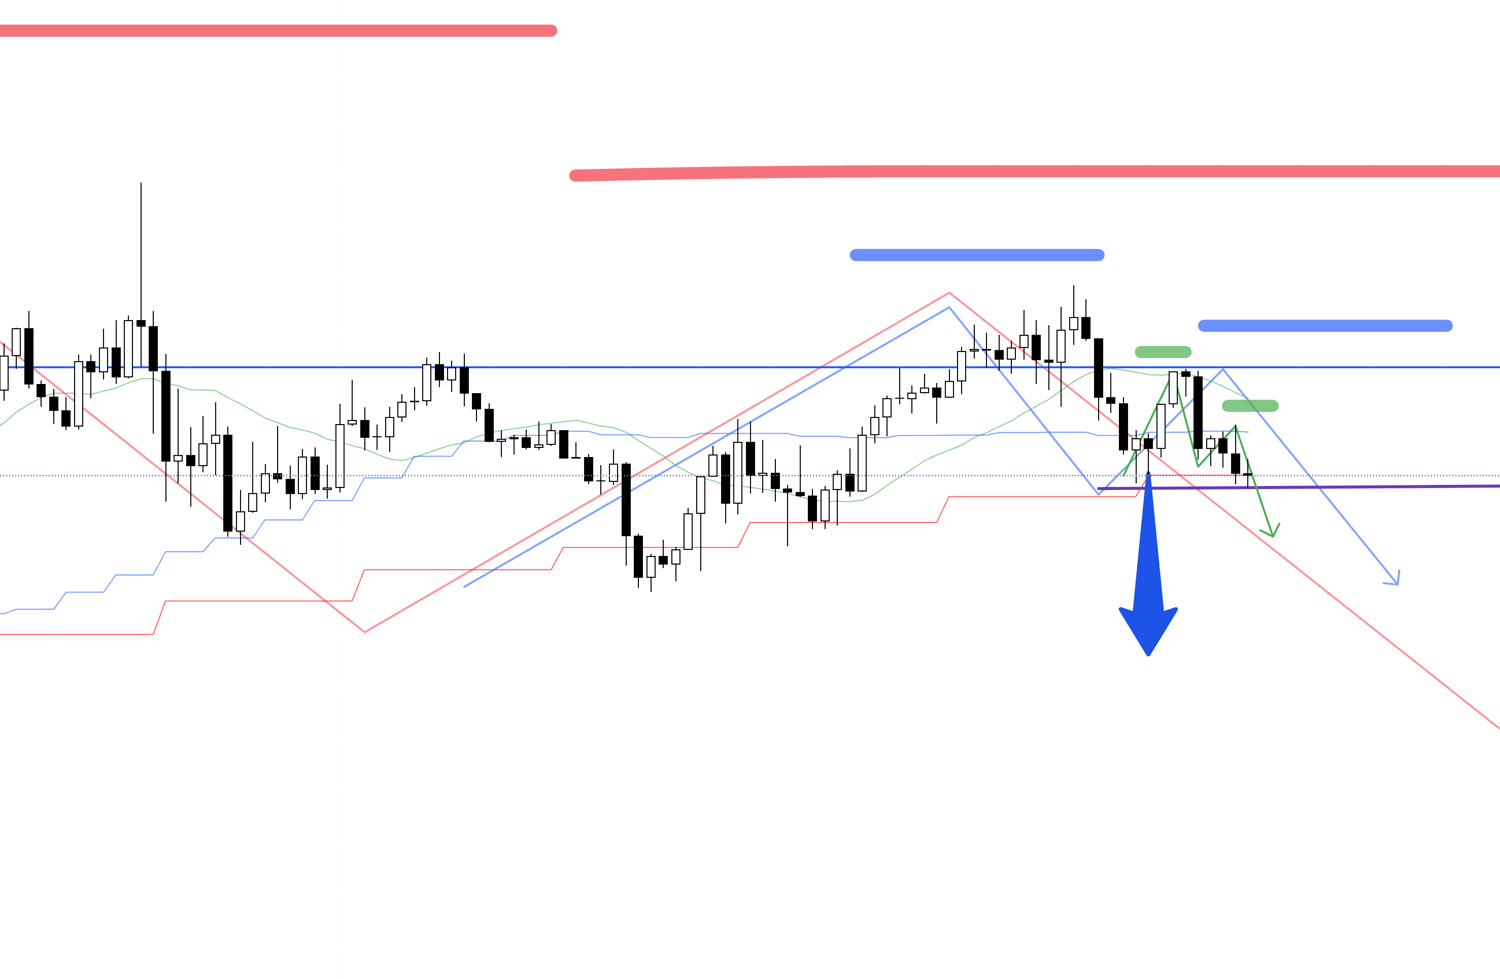
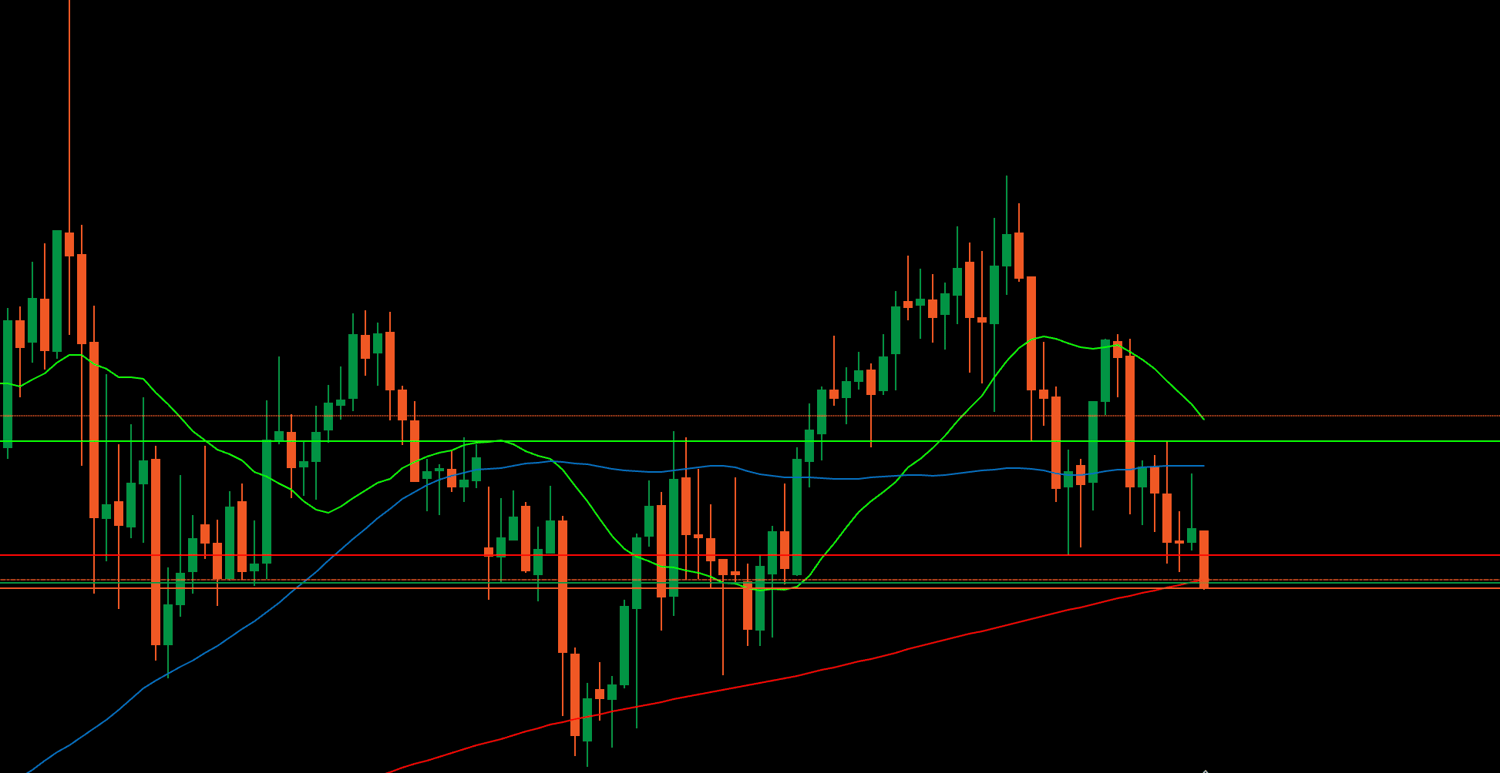
This is the 4h chart for USDJPY.
This week started from the vertical blue line.
Personally, there were three locations enclosed in squares where I considered trading on USDJPY.
Next, let's also look at EURUSD.
4h chart

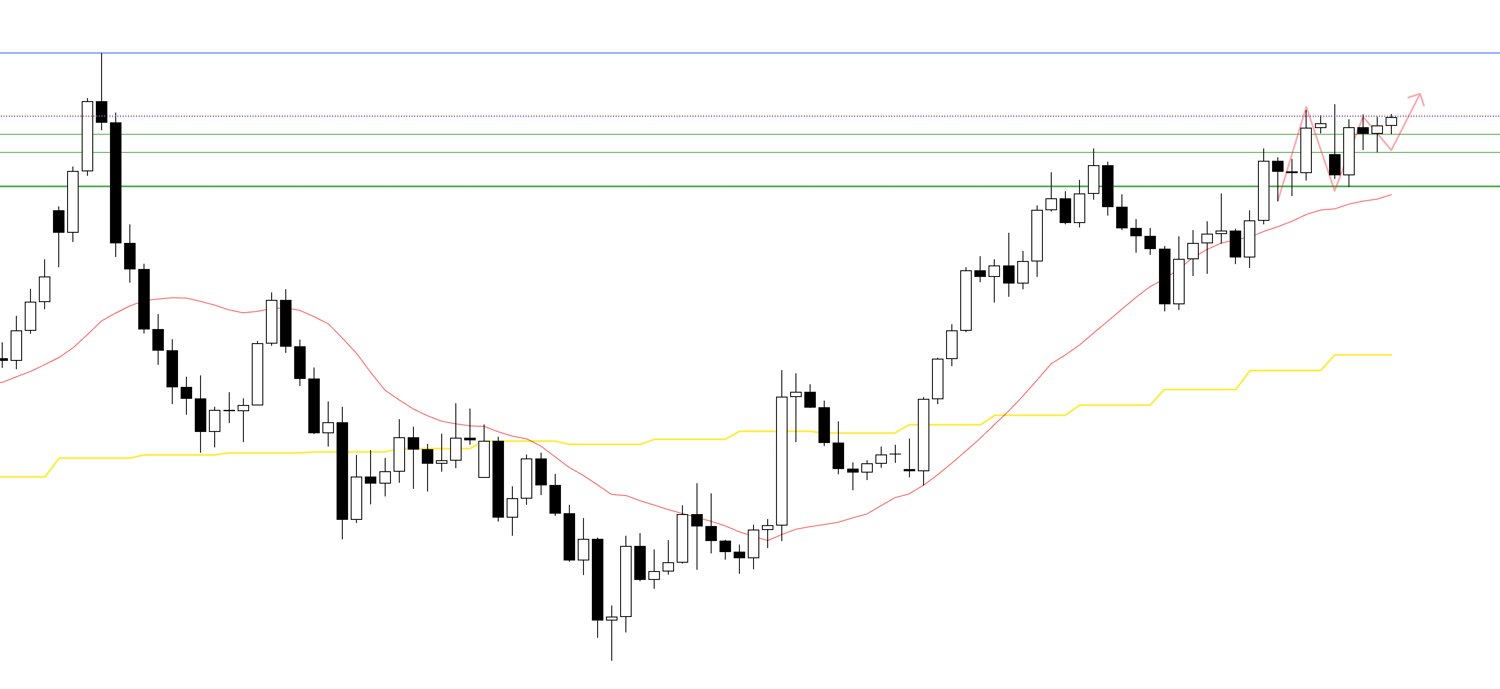
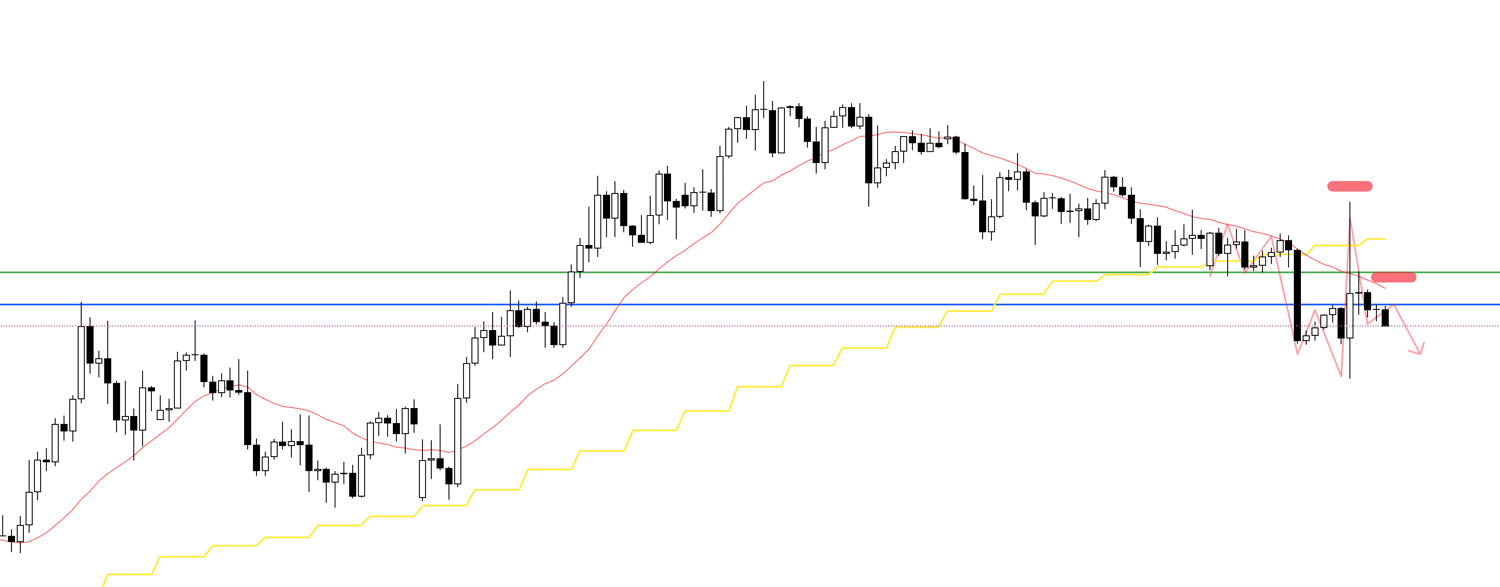
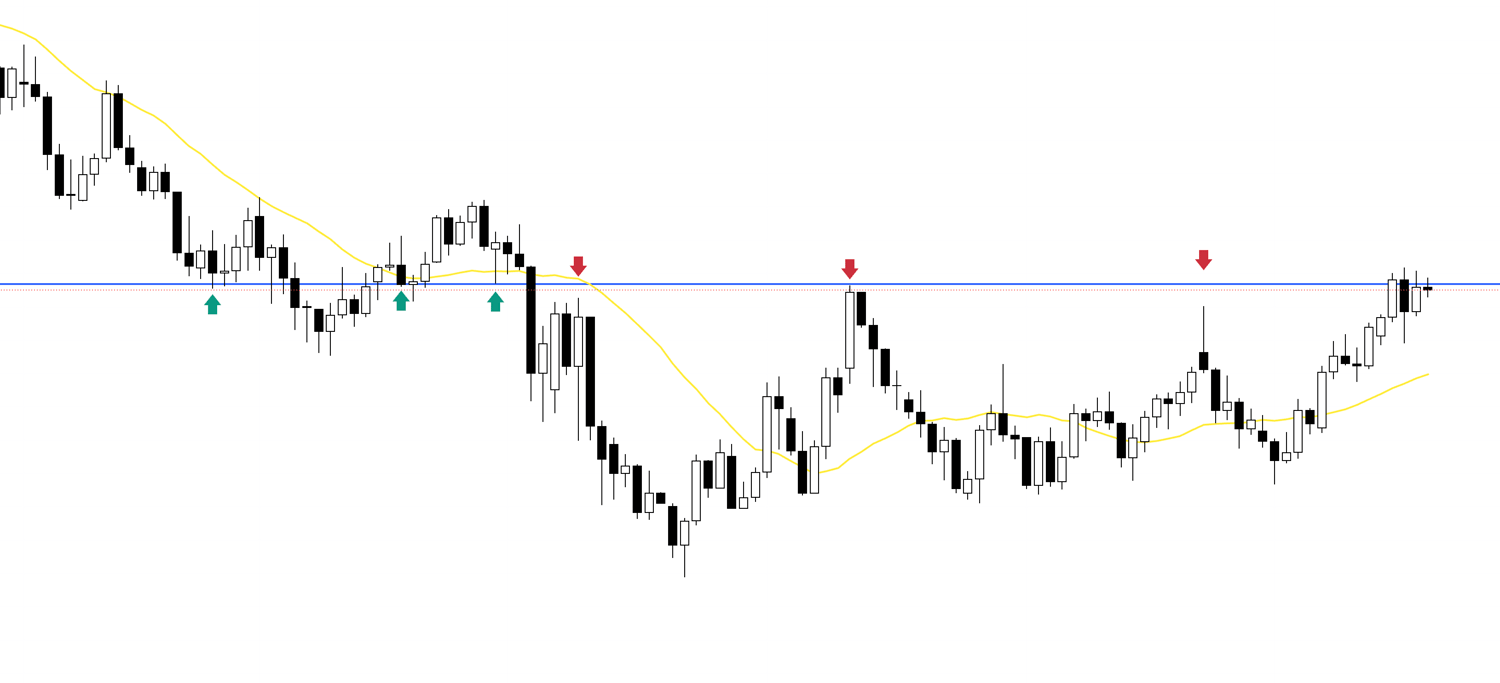
This is the 4h chart for EURUSD.
Similarly, the price action after the vertical blue line is this week's movement.
The point where I considered trading on EURUSD this week was the one location enclosed in a square.
I usually trade two currency pairs, USDJPY and EURUSD, so in total, there were four points this week where I should have considered a trade based on my rules.
By the way, what I do is trend following by buying on dips and selling on rallies on the 4h chart.
The actual trades are executed on lower timeframes, the 1h chart or the 15m chart.
For these strategies, please see the blog posts I have previously written on Dow Theory and multi-timeframe analysis.
So, when I am looking at this chart in real-time, what rules and judgments do I use to execute (or skip) a trade? I have kept a trade diary by taking screenshots before and during trades, noting the points I read from the chart at that time, so please view it as a trade report.
Just to be clear, this article is not meant to brag about winning trades, nor is it the kind of thing that aims to stir people up, and I have no interest in such things. So, I hope you will use it as a reference for how I think and execute a consistent process.
Regardless of wins or losses, even the trades not taken have meaning, and I'm picking up the important parts of the week, including all of them.
I believe you can get a good idea of how I view and think about the chart in real-time, and how I build scenarios while conducting consistent trades.
〜・〜・〜・〜・〜・〜・〜・〜・〜・〜・〜・〜・〜・〜・
July 14 (Mon) USDJPY
The buy scenario I had drawn up over the weekend came to fruition, so I placed a stop order.
4h chart
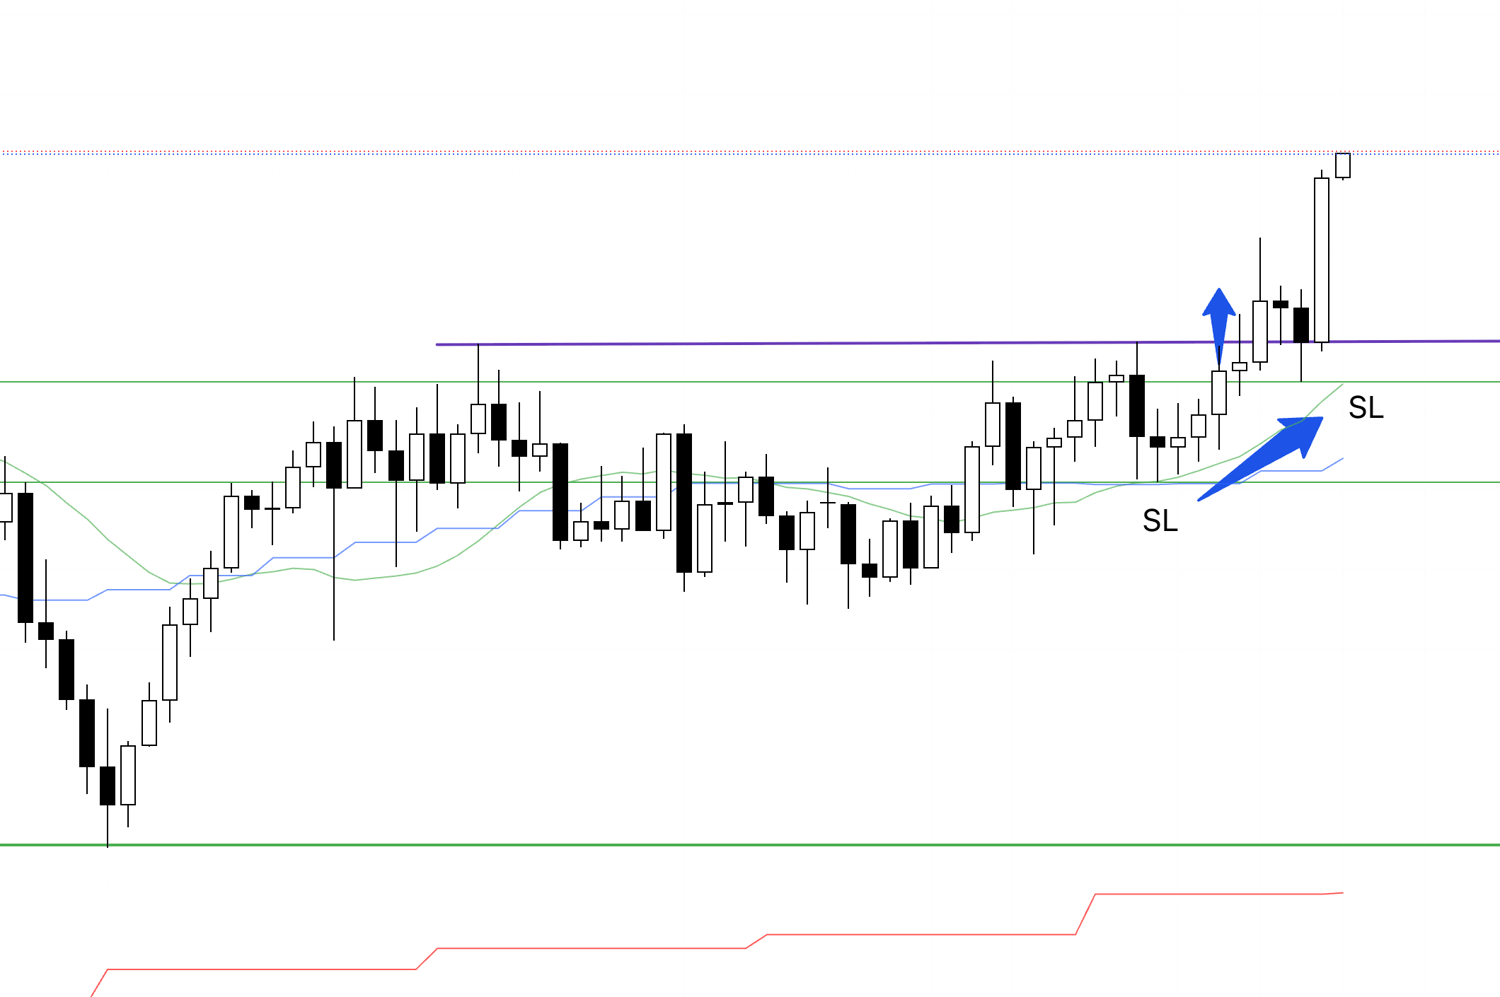
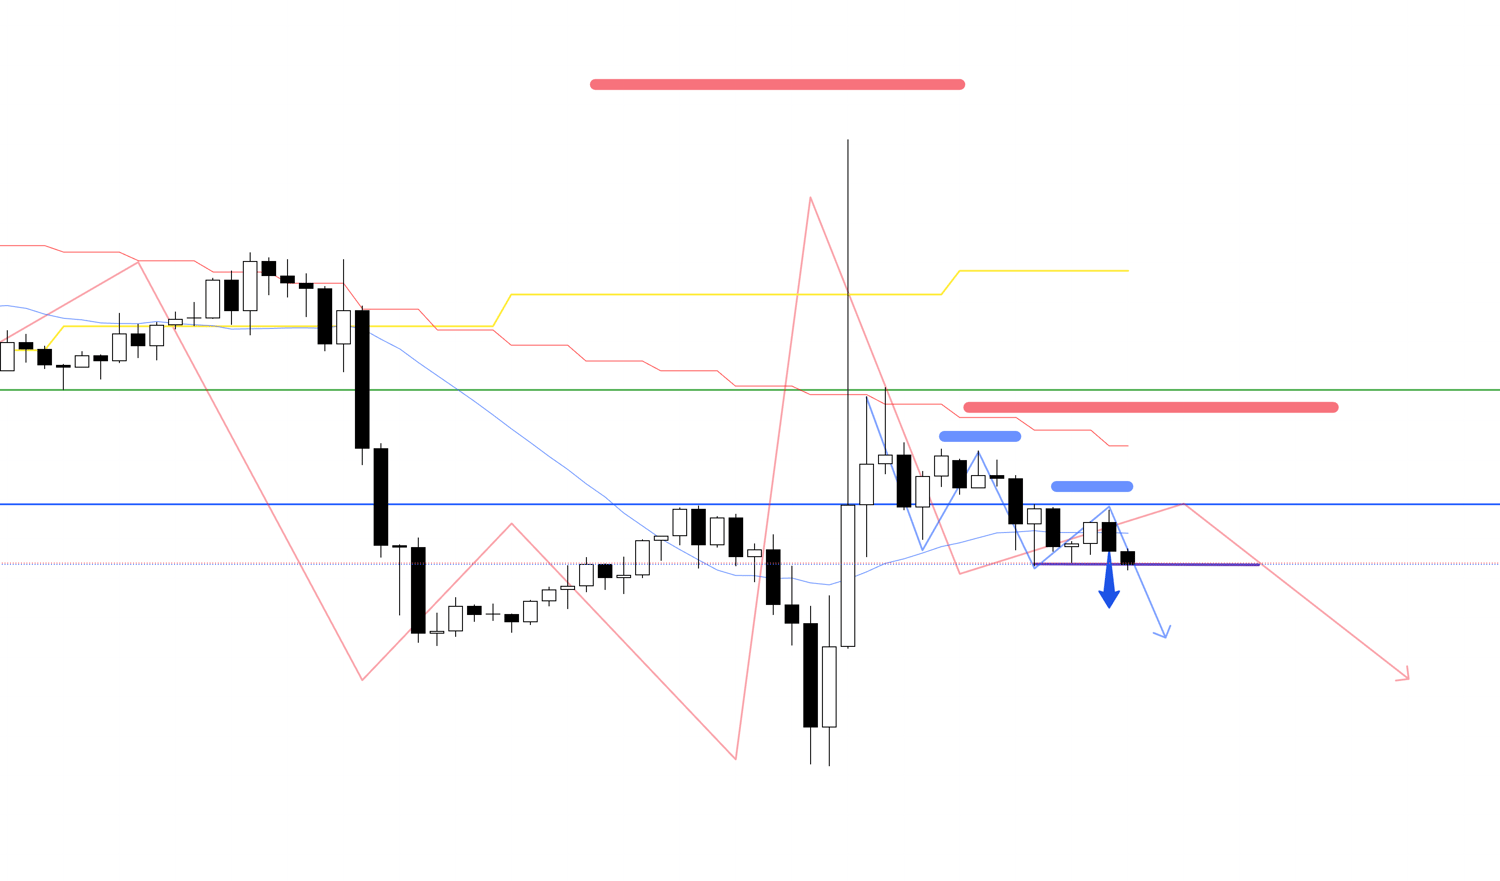
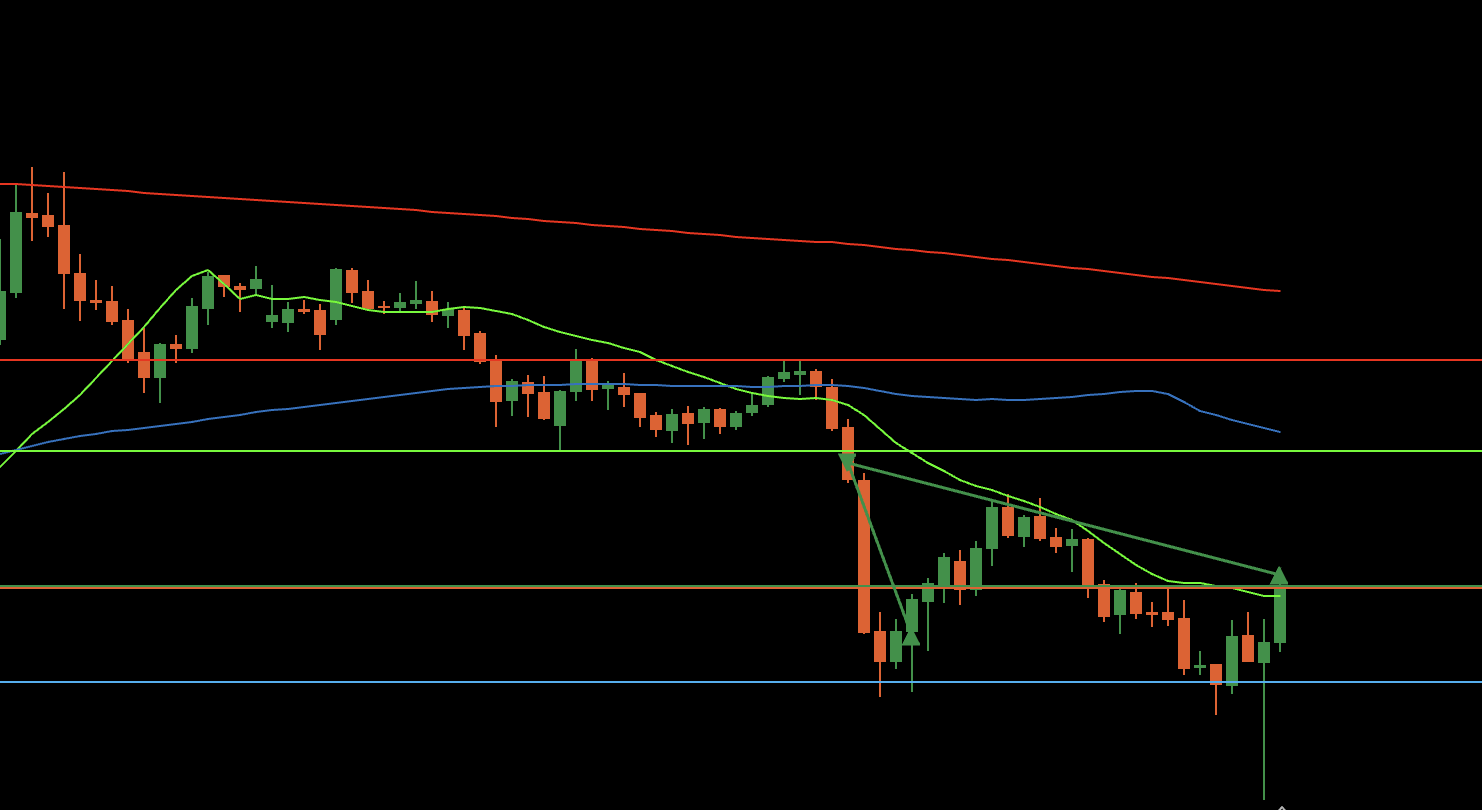
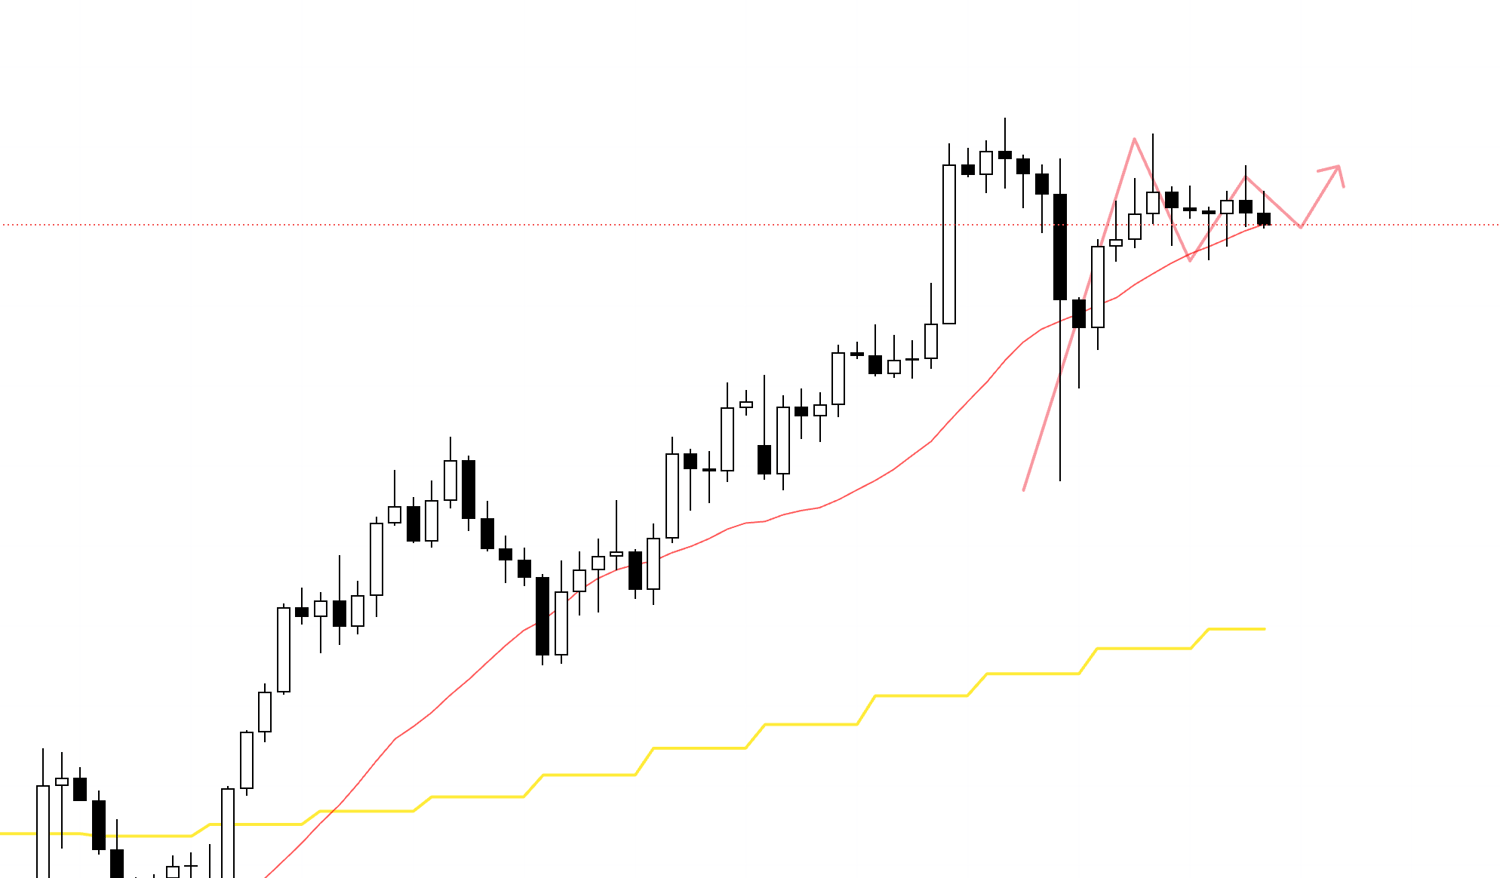
First, please look at the 4h chart.
It's currently in an uptrend, making new highs while making higher lows, and after forming a new low, it looks like it's about to make a new high.
However, as I also noted in the weekend scenario, it is near a selling on rallies point on the weekly chart, and it's a phase where selling pressure will increase, so it's necessary to consider such risks.
There is a blue line drawn at the previous daily high just above, and if it reaches there, I plan to secure half my profit, and after that, I want to hold the position until the trend breaks down.
1h chart
On the 1h chart, it looks like this.
Within the higher low on the right side of the 4h chart, the 1h chart is also making a higher low and is about to break the high.
If it breaks through here, an uptrend will be confirmed on the 1h chart, and the continuation of the uptrend on the 4h chart will also be confirmed, which is a point where the bullish edge increases.
15m chart
Let's also look at the even lower timeframe, the 15m chart.
Similarly, within the higher low point on the 1h chart, the 15m chart is also making a higher low and is about to break the high.
This becomes a point with a very high edge where orders from traders on various timeframes converge.
As you can see from my previous trade reports, I always continue to repeat the same trade like this.
If the order is filled after this, I will follow the trend as it is.
15m chart
This is the 15m chart on cTrader immediately after entry.
The order was filled while I was writing this.
After entry, there is nothing in particular to think about, and I plan to follow the trend until it breaks down.
15m chart
It made a new high and a higher low, so I raised my SL.
I will continue to trend follow like this.
15m chart
I woke up this morning and raised my SL.
15m chart
This is the cTrader chart where I am actually trading.
It broke the 15m chart's low and the trend broke down, so it hit the trailing stop I had set, and the trade was closed.
15m chart
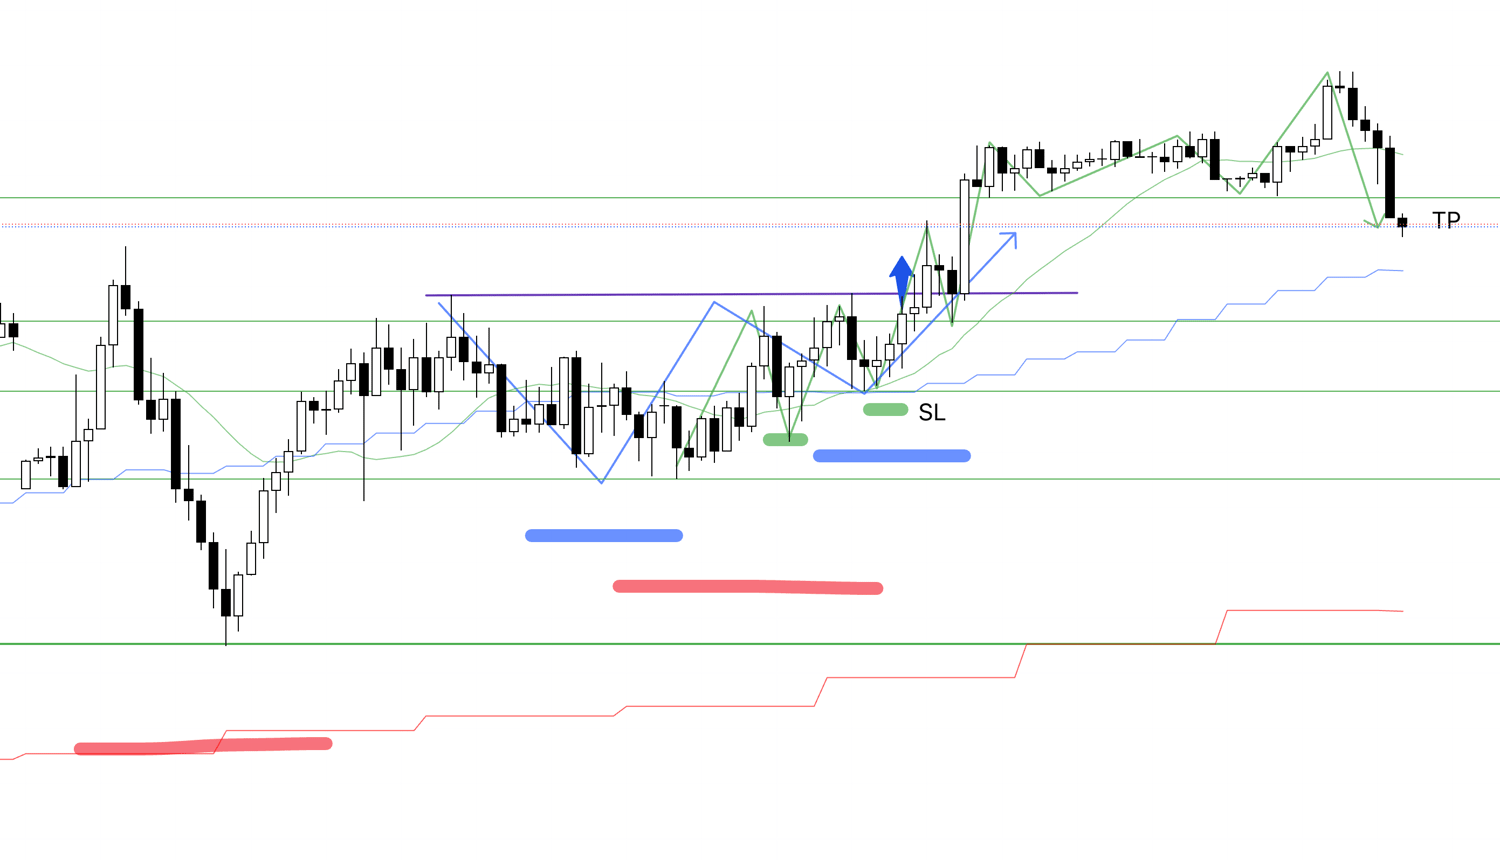
To summarize, I entered at a point where the 4h chart was making a higher low and a new high, and within that, the 1h chart and 15m chart also confirmed an uptrend by making a higher low and a new high, and then I held the position until the trend broke down.
This trade was also exactly the same as always.
In this way, even if the chart is one of a kind, it is extremely important to build a scenario based on strategy and rules, and to always repeat consistent trades.
〜・〜・〜・〜・〜・〜・〜・〜・〜・〜・〜・〜・〜・〜・
July 15 (Tue) USDJPY
After that, a clean entry point appeared again, but since it was before an economic indicator announcement, I have a rule not to take new positions, so I skipped it.
Therefore, this is a trade I did not actually take, so it's a chart after the fact, but please take a look below.
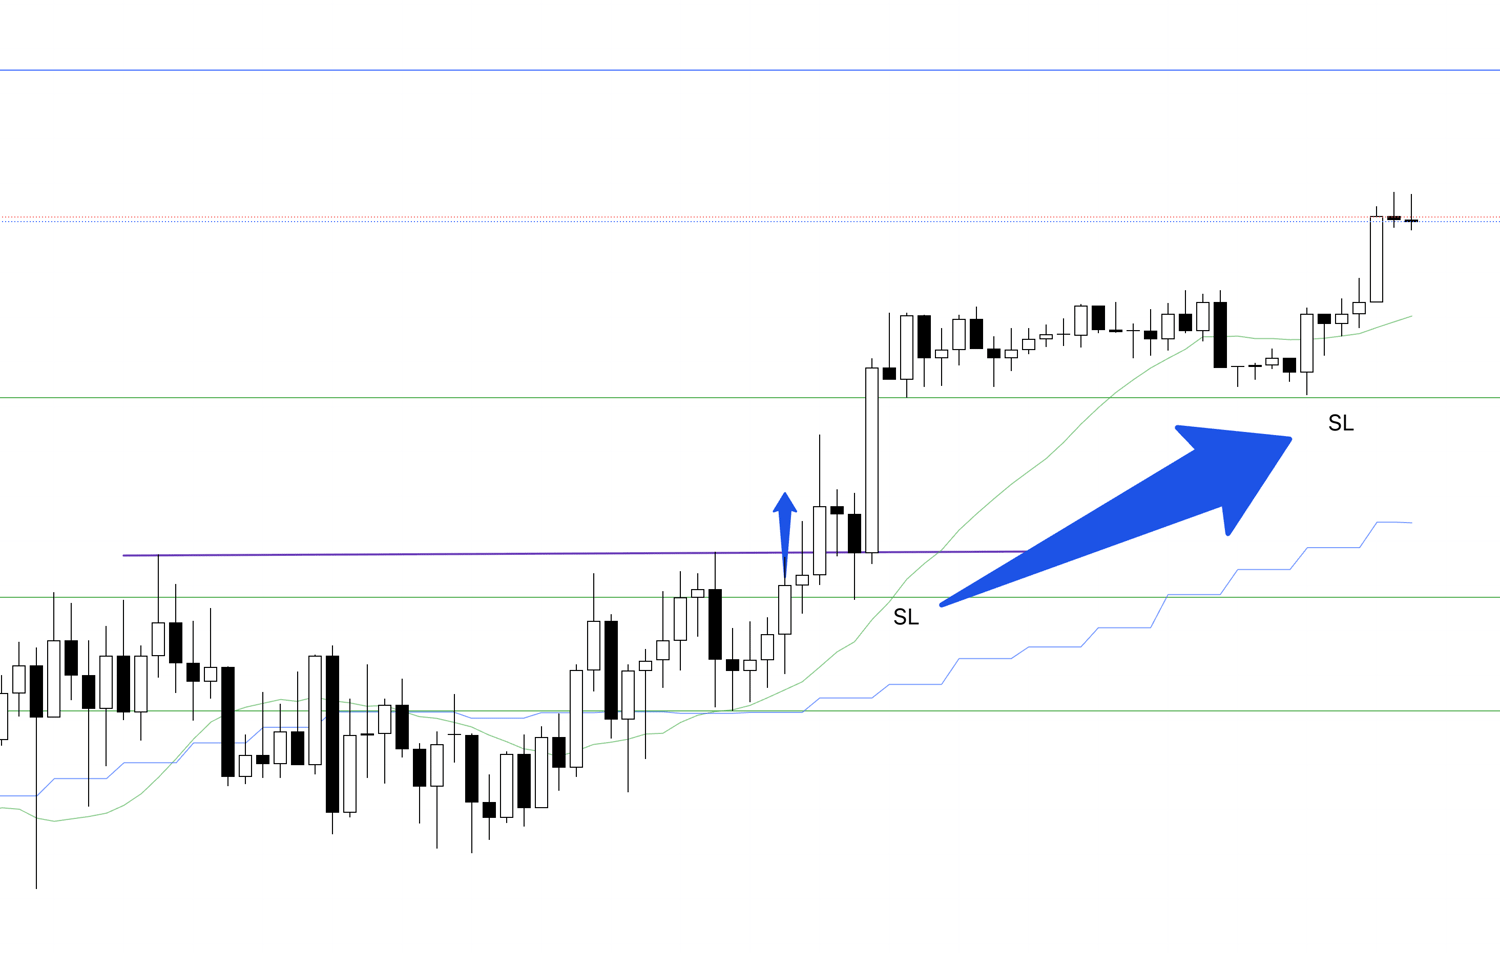
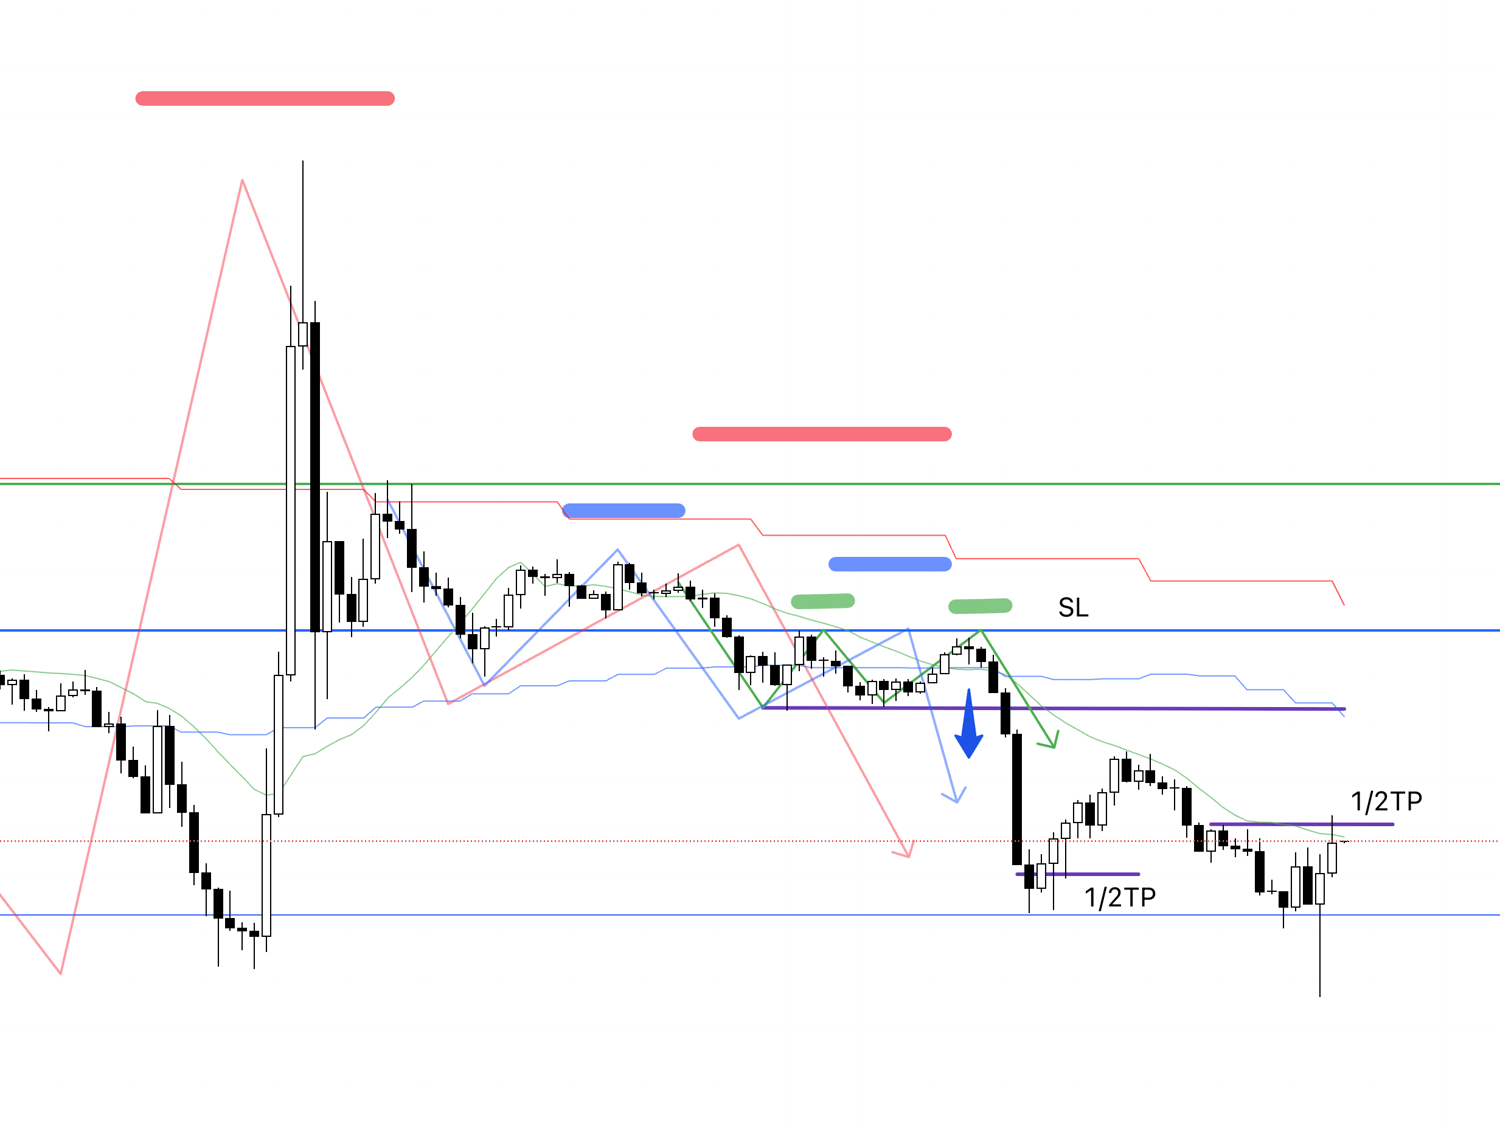
1h chart
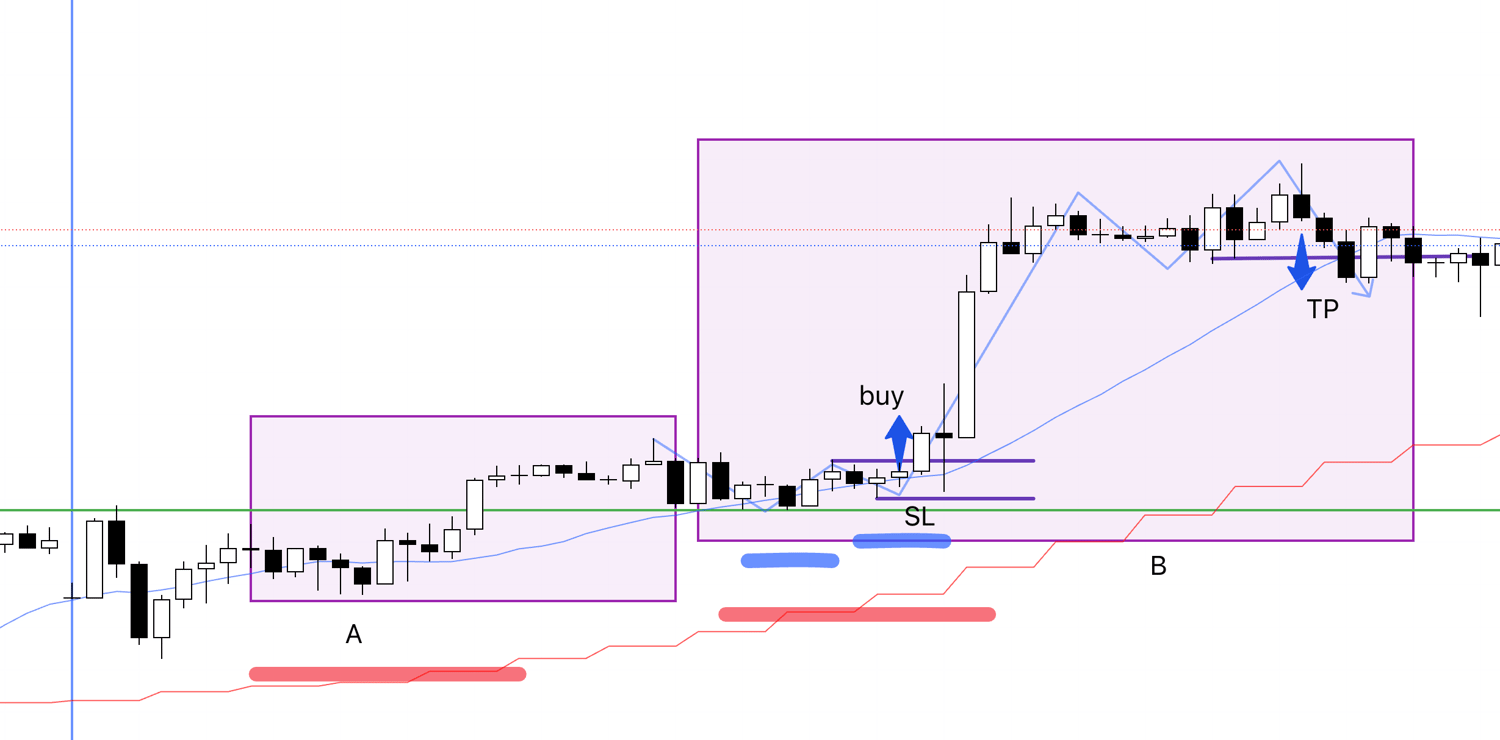
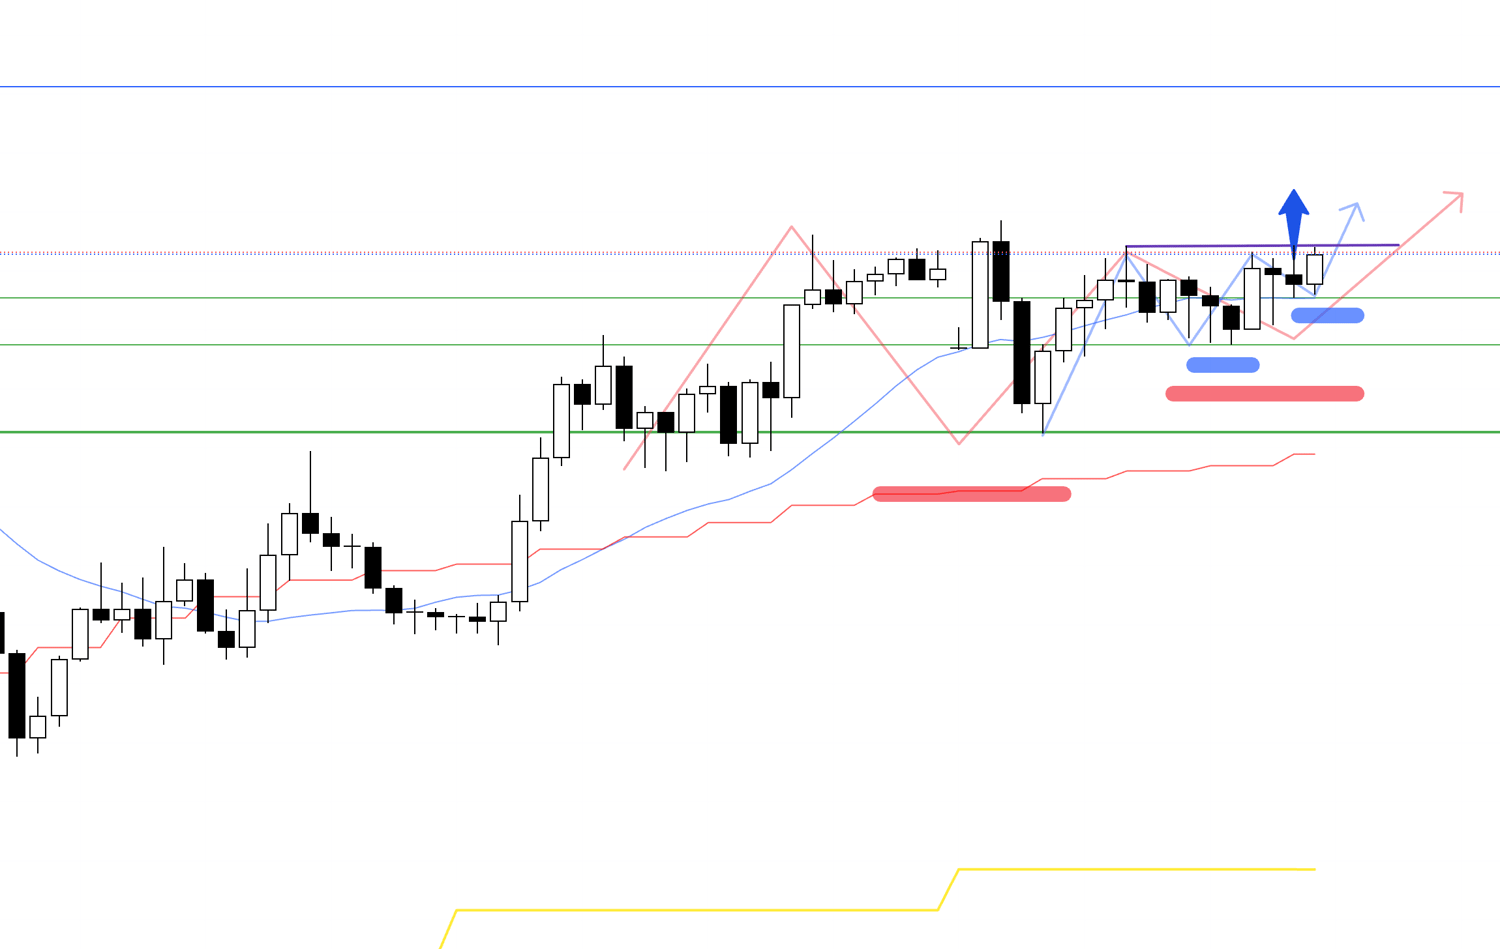
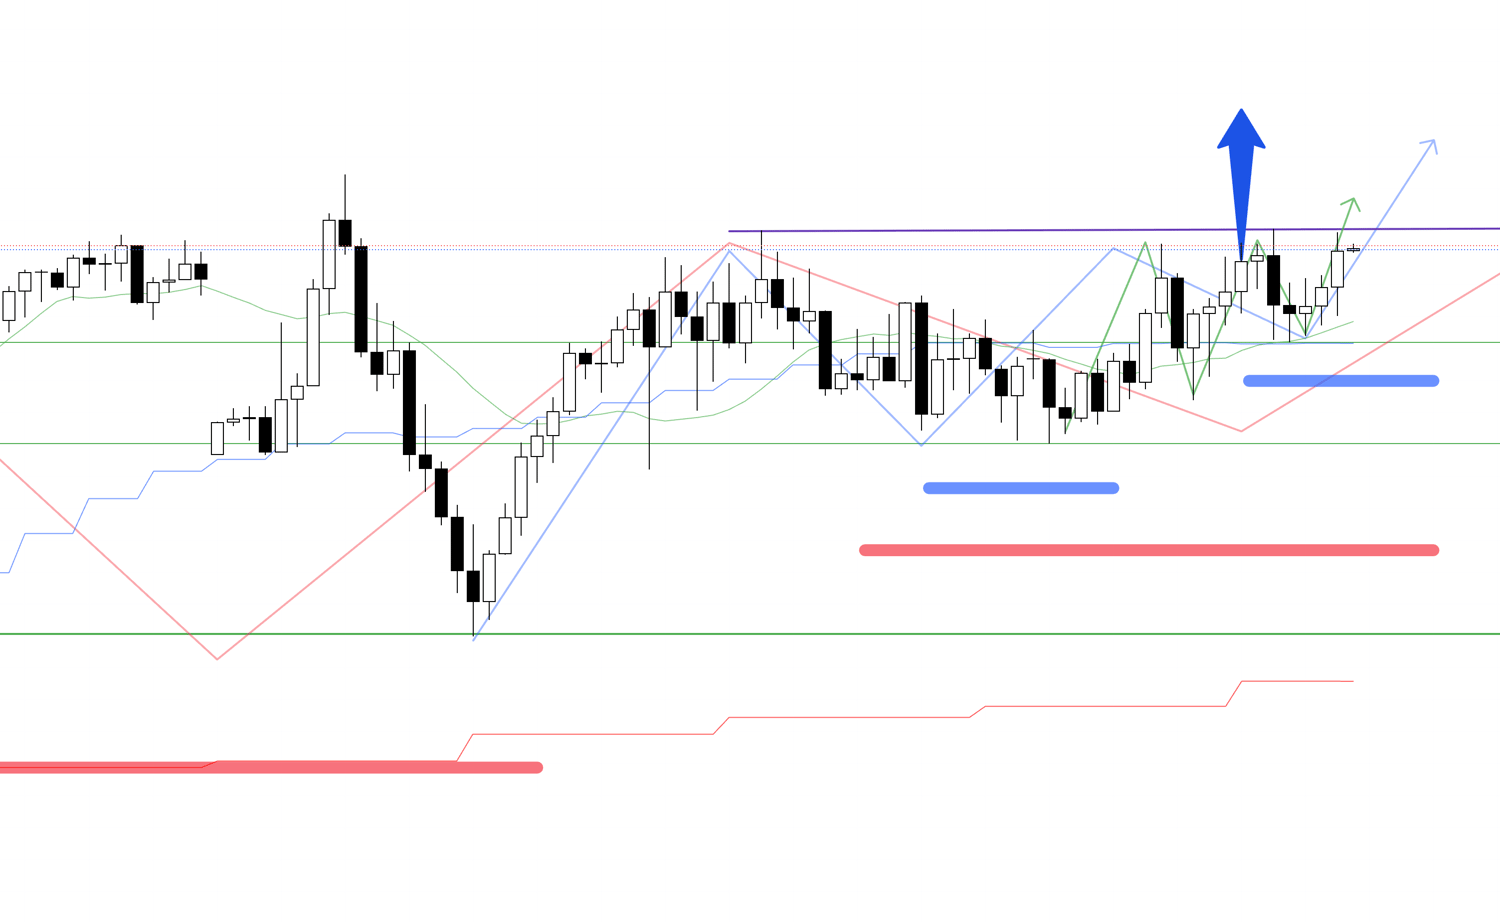
It's point B, but as you can see, a point appeared to buy the dip on the 4h, where the lower timeframe 1h chart also made a higher low and a new high.
That low was supported by the previous high, as shown by the green line in the chart, and if it makes a higher low and a new high at this point, it is a place that is very likely to function as a line for setting an SL.
However, I was watching, but since there was an indicator announcement immediately after, I refrained from entering.
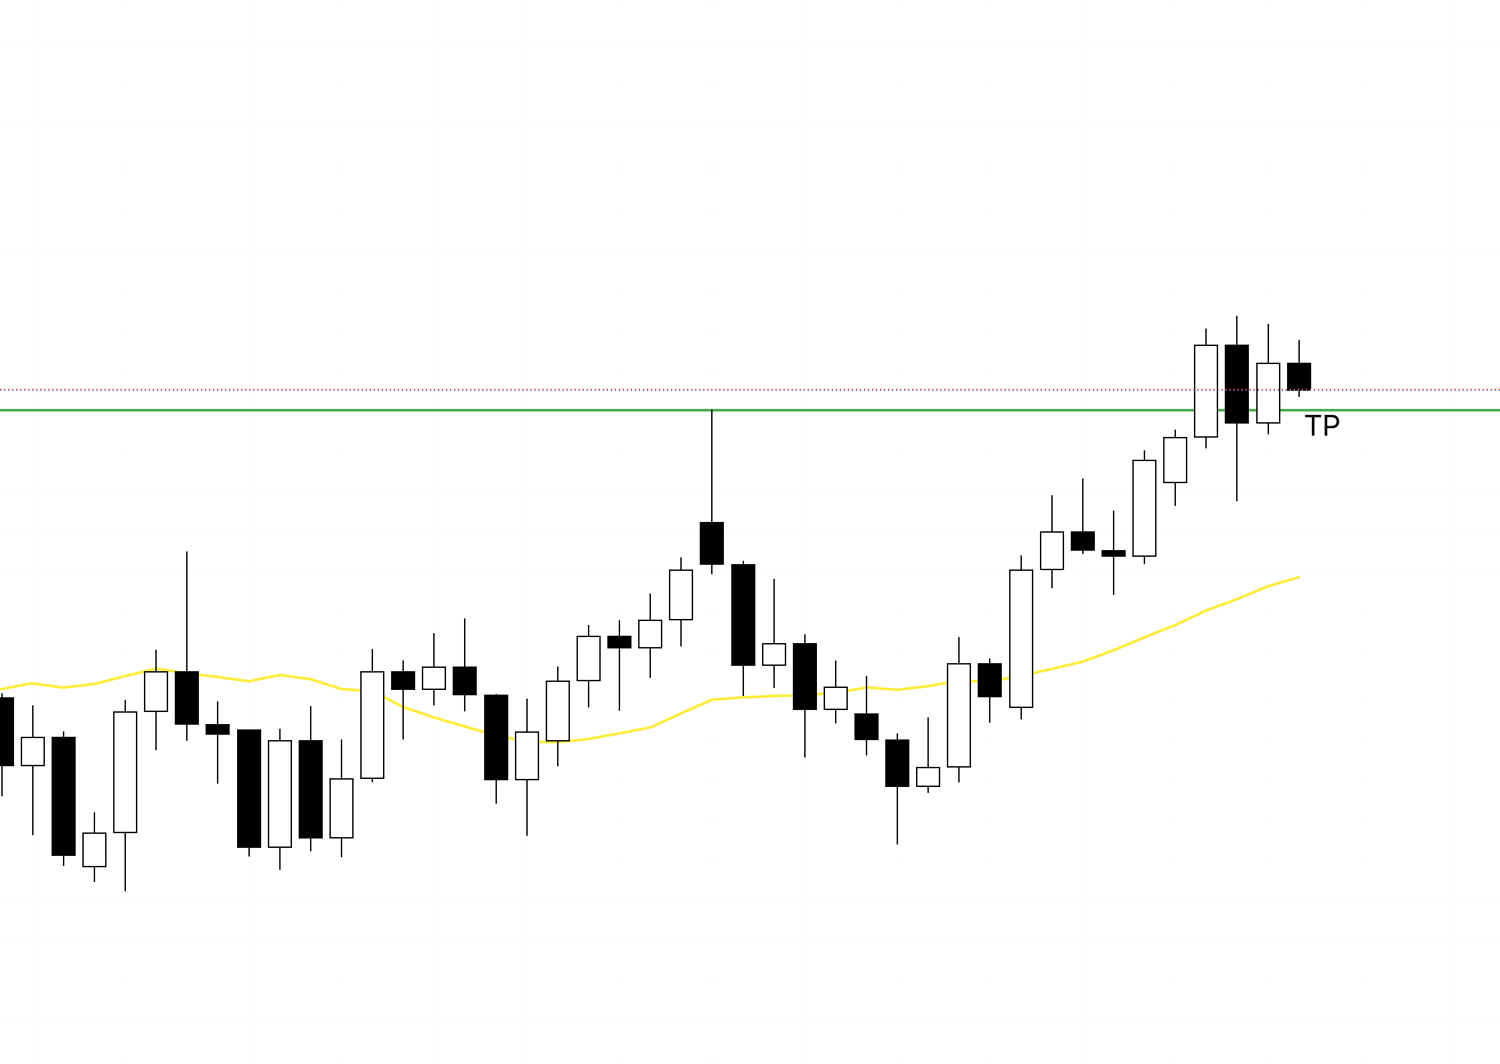
If there were no events like an indicator announcement, it would be a point with a significant edge, so I would really like you to remember this pattern.
After entry, I would hold the position as usual until the trend breaks down, so if I had traded, it would have been closed at the point labeled TP on the chart.
〜・〜・〜・〜・〜・〜・〜・〜・〜・〜・〜・〜・〜・〜・
July 17 (Thu) EURUSD
4h chart from last weekend's scenario
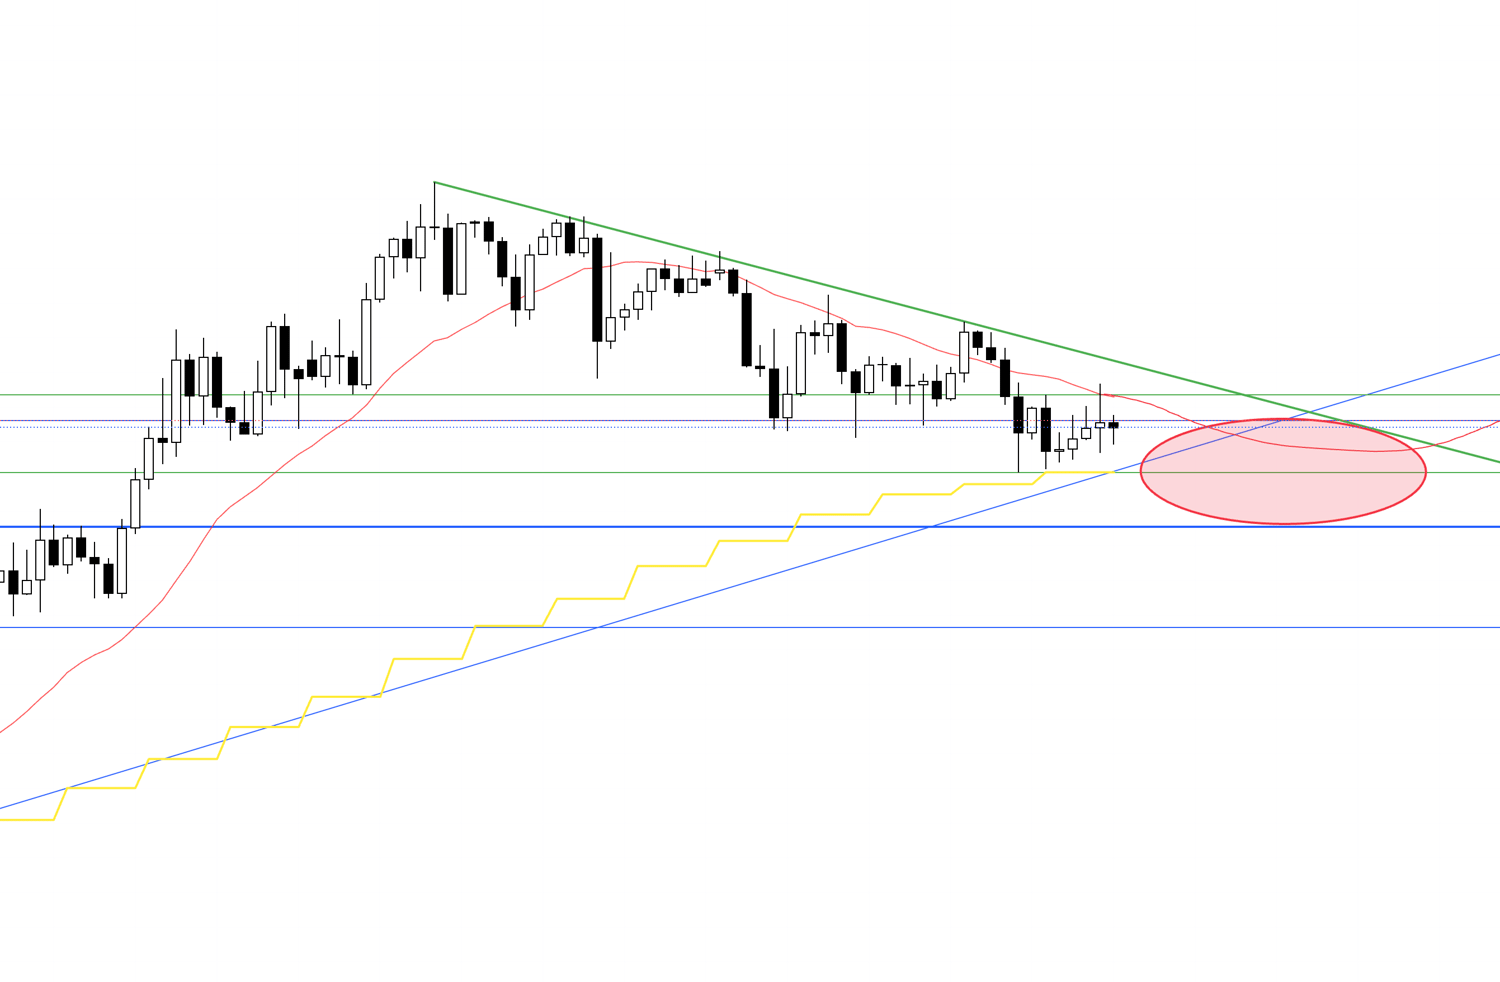
This chart is the 4h chart from the trade scenario I posted last weekend.
It broke significantly below the area I said I wouldn't trade, marked with a circle, and after breaking the downtrend once, I was waiting for the first selling on rallies point to start a new downtrend.
4h chart from last weekend's scenario
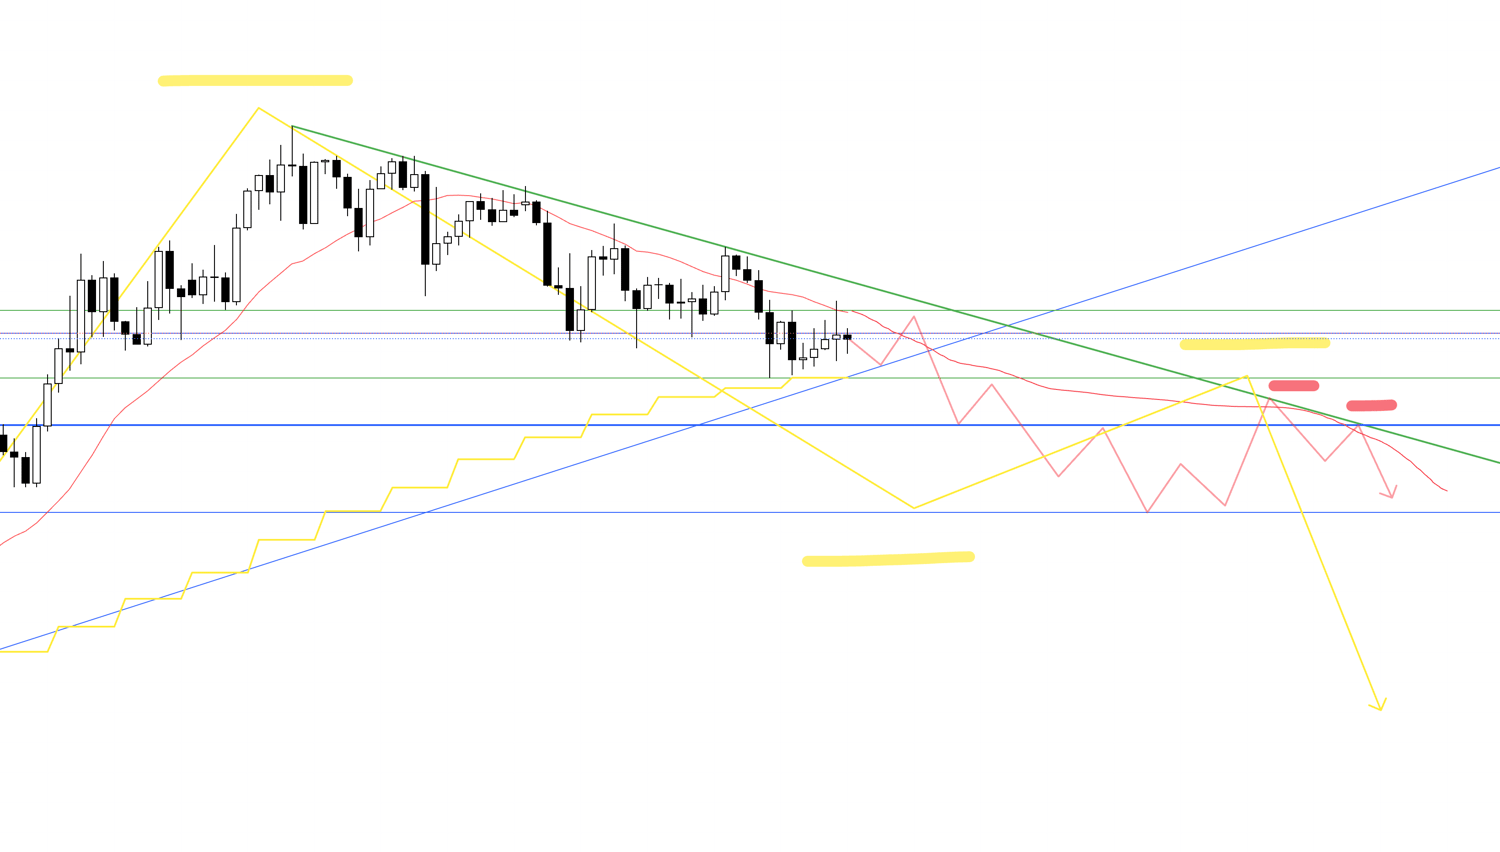
This was the sell scenario I was looking at in last weekend's scenario, and this sell scenario appeared today.
I thought it would take a little more time for this sell scenario to form, but due to President Trump's remarks yesterday, the chart moved significantly and ended the downtrend on the 4h chart for me, so it became easier to aim for the initial move of a newly forming downtrend.
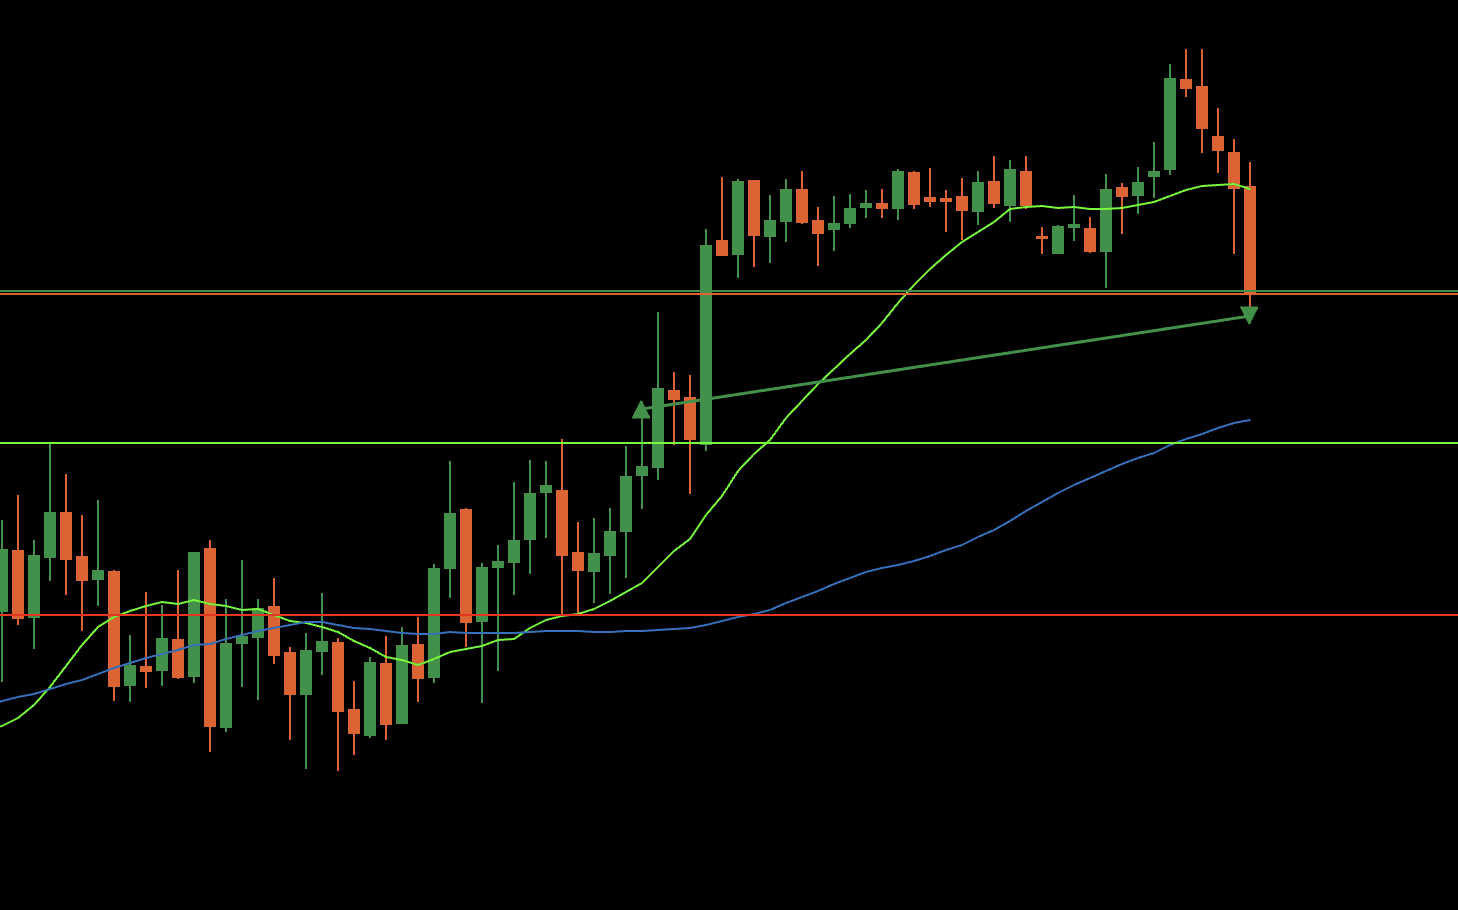
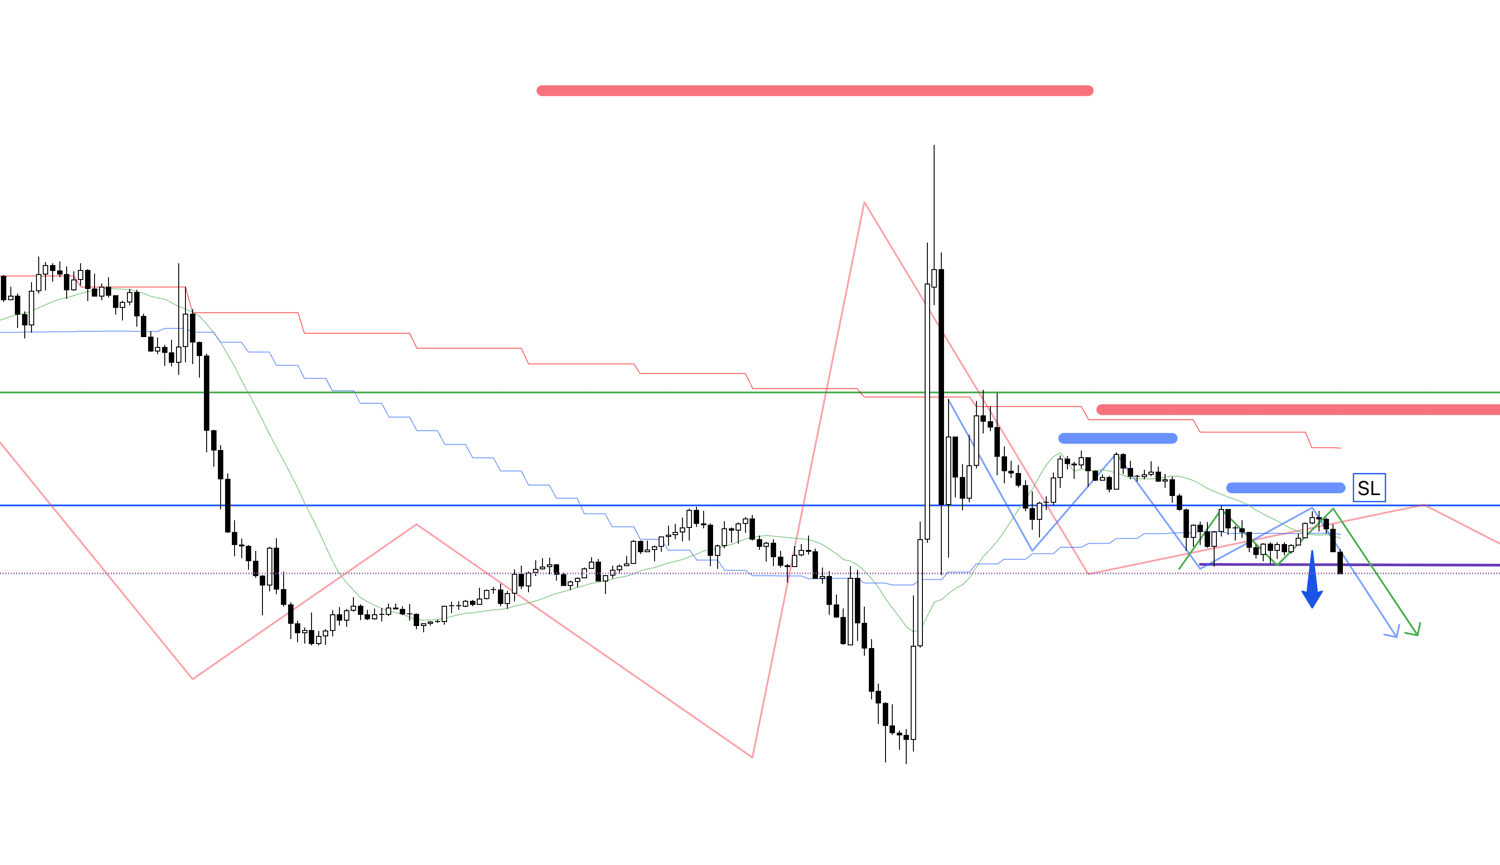
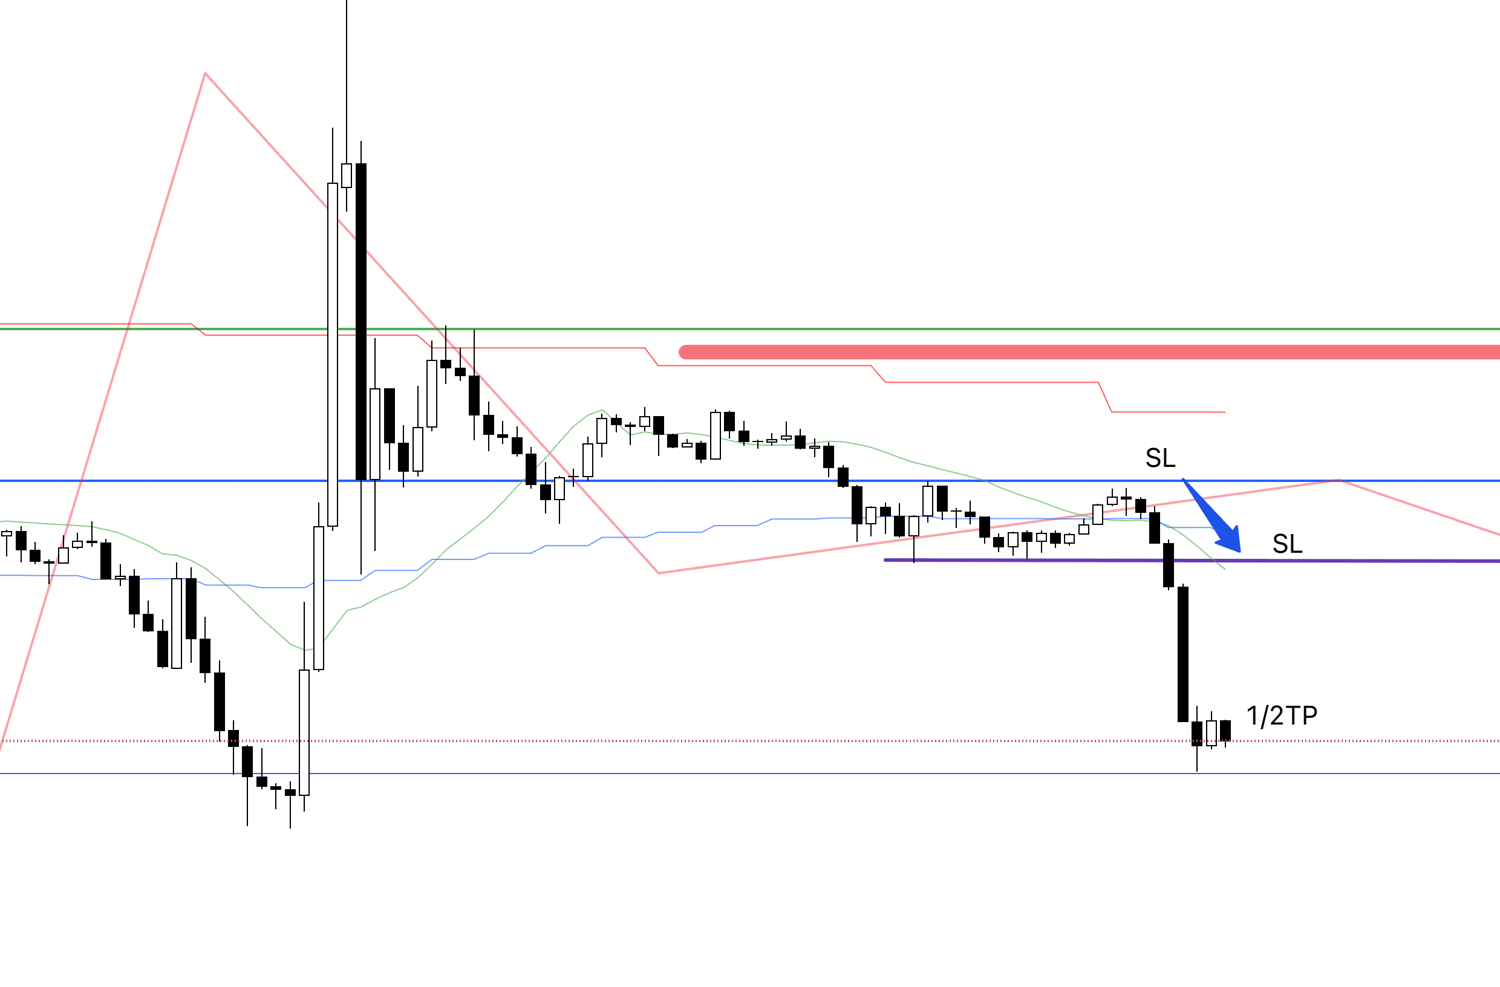
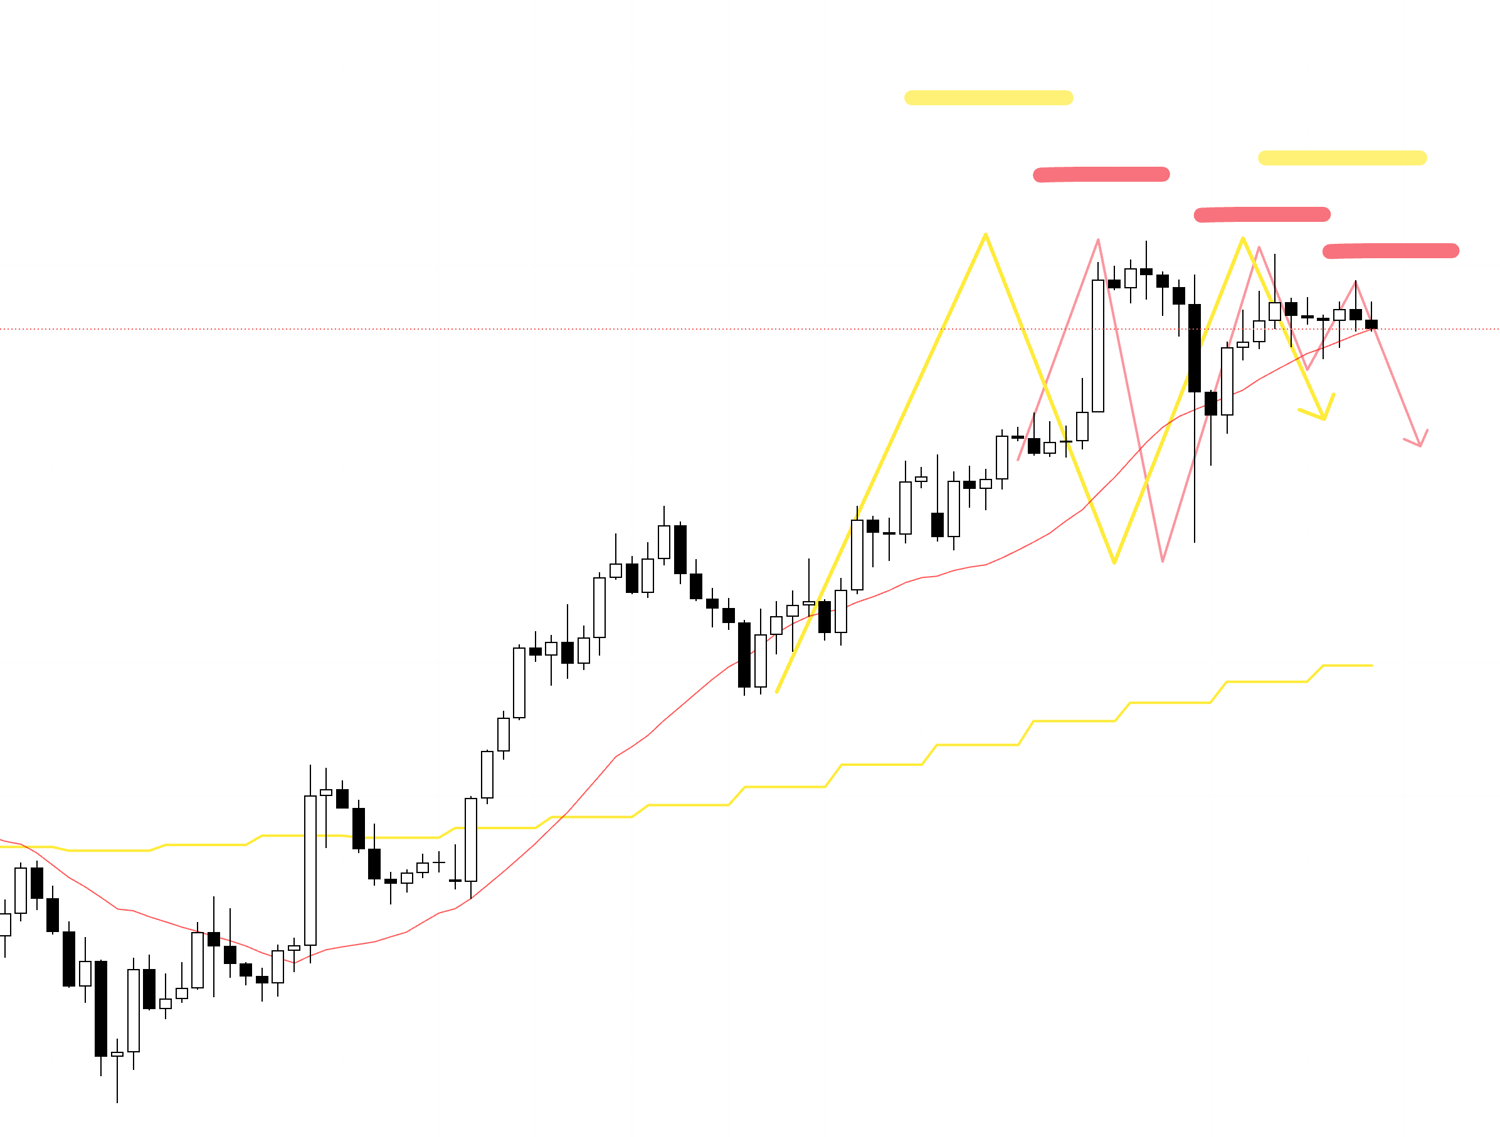
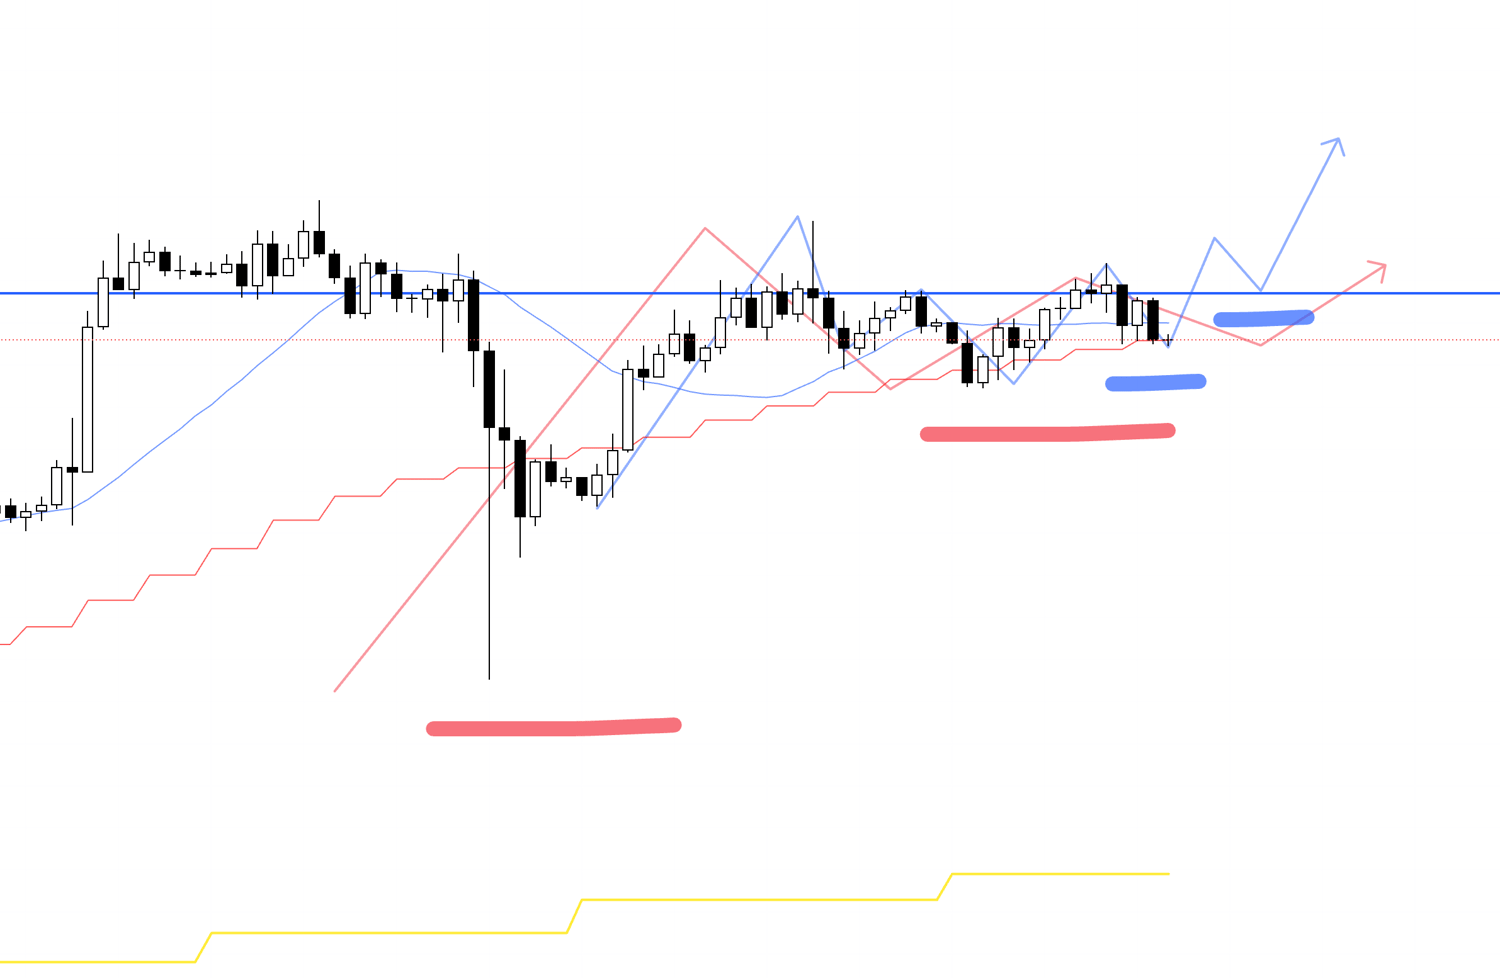
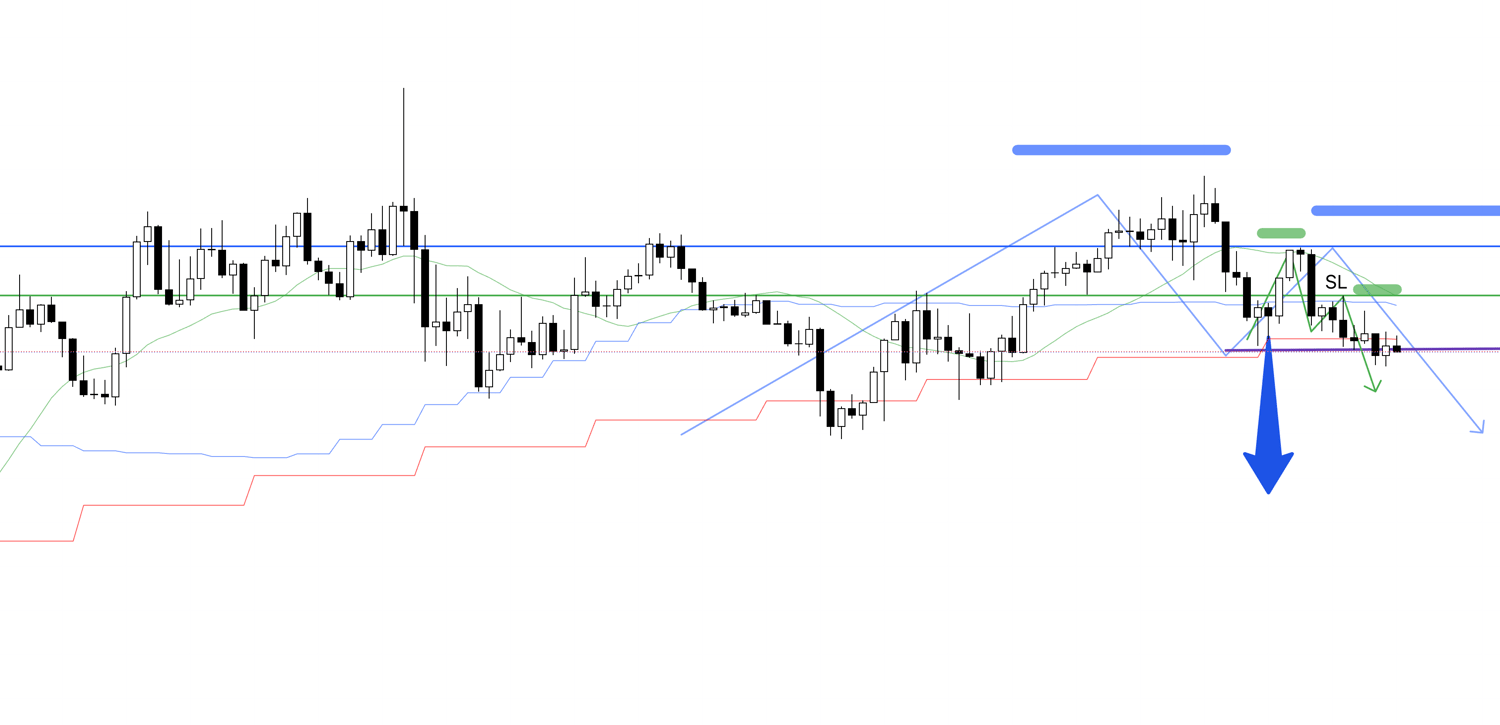
4h chart
On the 4h, after the downtrend broke down once like this, it made a lower high point again, so I placed a stop order.
The lower high on the 4h is a bit ambiguous, but it reversed cleanly at the blue line that is functioning well, so I want to follow the subsequent decline.
Let's change the scale of the 4h chart to see this blue line more clearly.
Please see below.
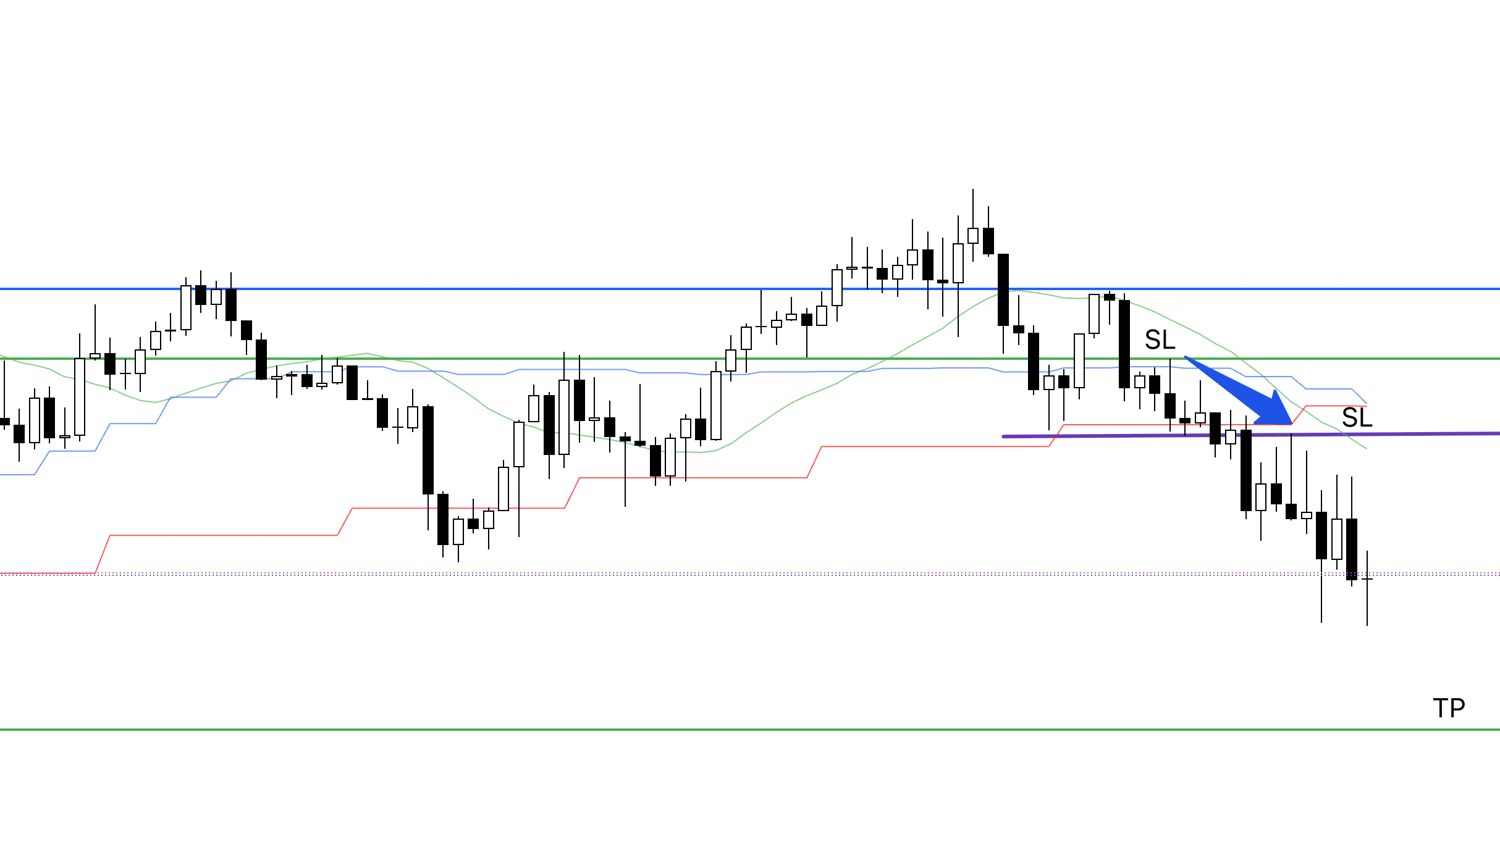
4h chart
As you can see, this is a line that has been separating buyers and sellers for some time, and if it reverses cleanly here, as a trend follower, I have to sell.
Let's also look at the lower timeframe 1h chart.
1h chart
On the 1h, within the lower high on the right side of the 4h chart's lower high, I enter where it breaks the low that confirms a lower high on the 1h as well.
It's a repeat of the same trade every time.
If you look back at my past trades, you'll see that no matter how different the chart is, the trade I do is always the same.
The key is how to trade only at "points with an edge" where orders are concentrated.
Now let's look at this on the 15m chart.
15m chart
On the 15m as well, it will be an entry at a point where it makes a new low and a lower high.
Since it is being held down by a solid line, I will set the SL above this high, and if the order is filled after this, I will follow the trend.
It's a very clean entry point, and a very high-edge entry point.
15m chart
Just now, while writing this article, the stop order I had placed was hit, and the order was filled.
This is the 15m chart on cTrader where I am actually trading.
After this, as usual, I will hold the position as long as the trend continues.
Tonight, there is an economic indicator announcement, and just below, there is a line from the weekly chart's high, so I will secure half the profit once before that line, and then I intend to hold the remaining position until the trend breaks down.
Currently, the weekly chart's buying on dips point is approaching, and the lower it goes, the more buy orders will come in, so it's necessary to build a plan that considers those risks.
15m chart
It immediately reached the blue line drawn at the previous weekly high, so I took profit on half.
And I moved the SL to the entry price line, which it would break at the same time as the moving average.
I plan to continue holding the remaining position until the trend breaks down.
15m chart
I lowered the SL another step.
If it breaks above this high, the trend on the 15m chart will break down, so it will be a close.
15m chart
I lowered the SL further.
15m chart
This is the 15m chart on cTrader where I am actually trading.
It just got closed.
I thought it broke below the weekly blue line due to the economic indicator announcement, but it was pushed back and closed where it broke the trend on the 15m chart.
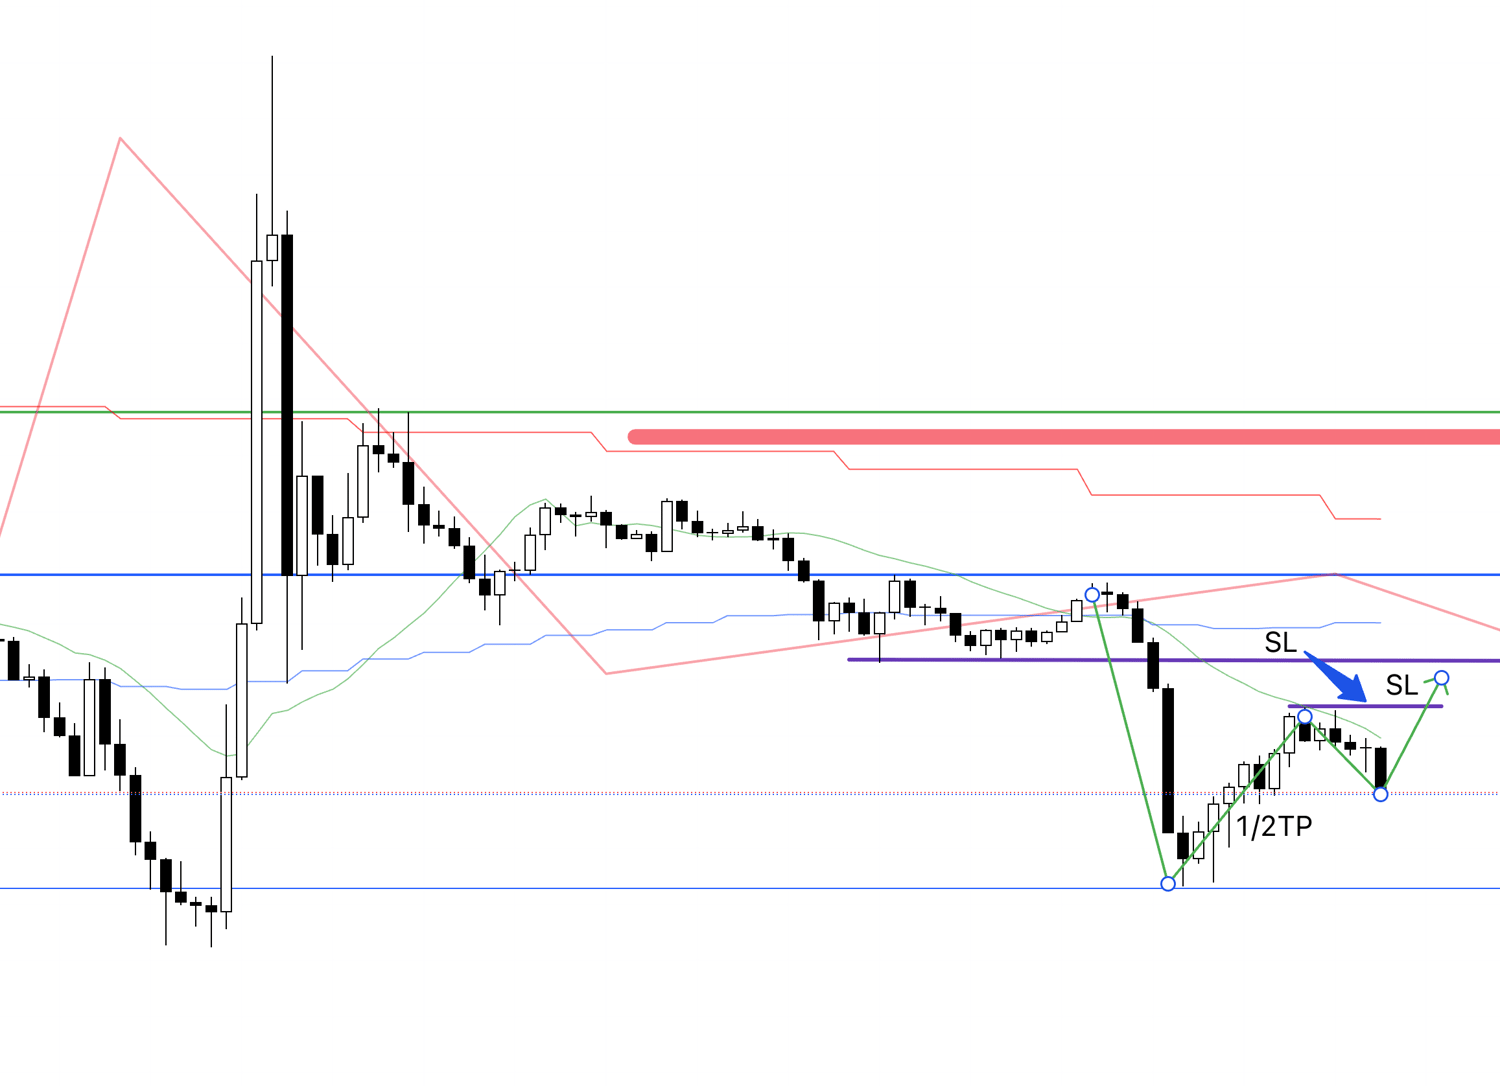
15m chart
To summarize this trade, it looked like this.
The entry was exactly the same as always: at a point where the 4h chart was making a lower high, and within that, the 1h chart was also making a lower high, and then the lower timeframe 15m chart also made a lower high while making a new low.
Regarding the exit, since there was an indicator announcement after entry today and I was concerned about the blue line where buying on dips on the weekly chart was likely to come in, I took profit on half the position upon reaching it, and held the rest until the trend broke down.
〜・〜・〜・〜・〜・〜・〜・〜・〜・〜・〜・〜・〜・〜・
July 18 (Fri) USDJPY
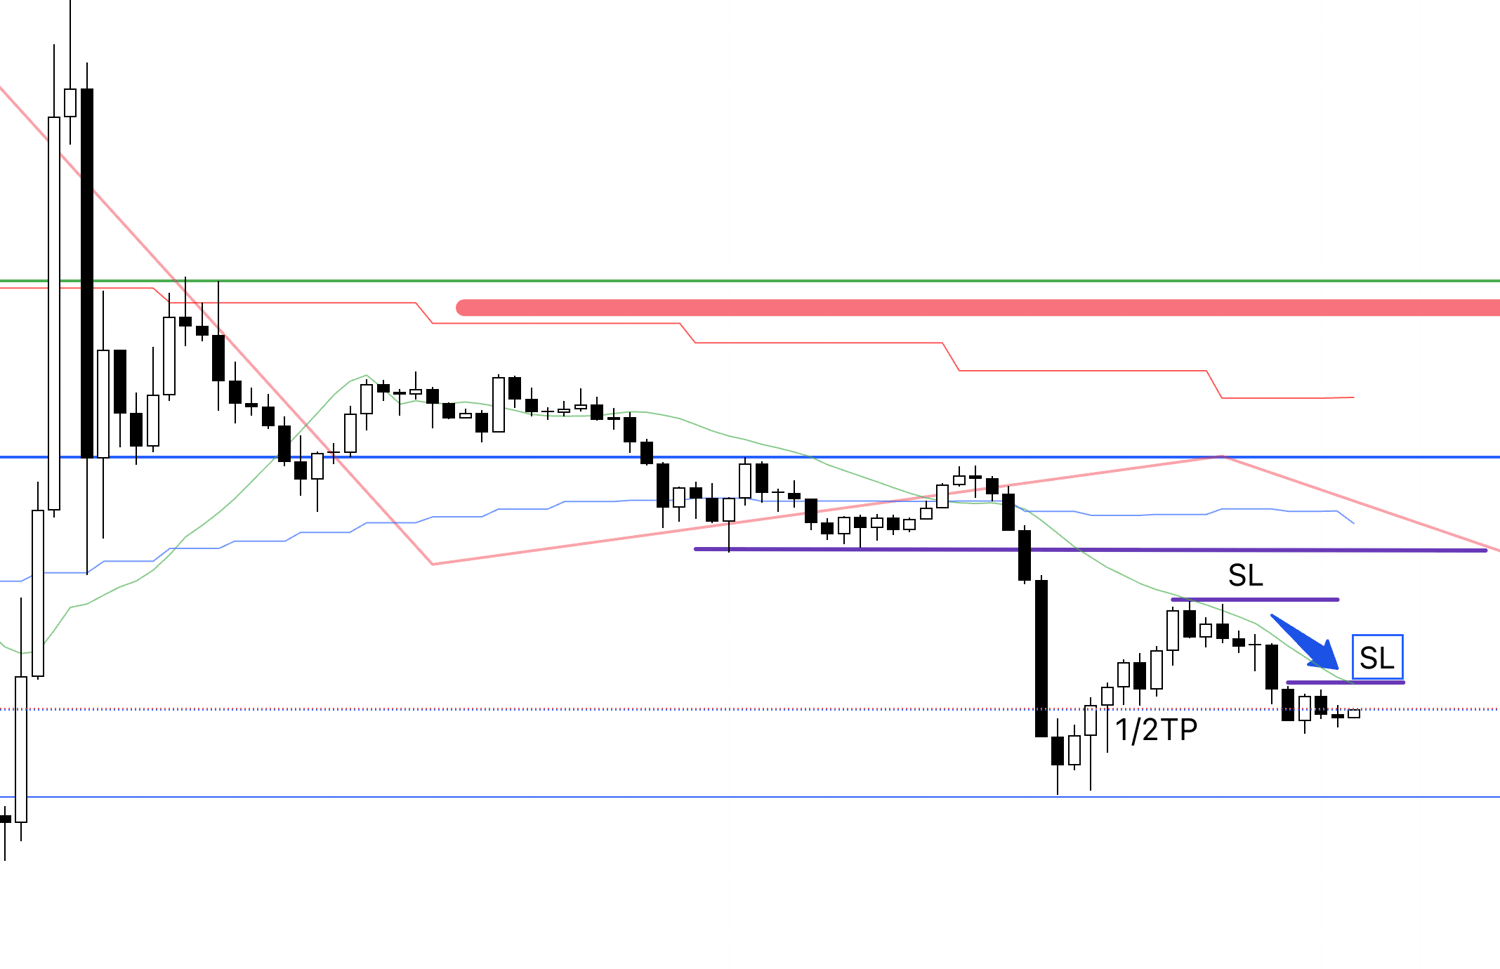
It showed a lower high on the 4h, so I just placed a sell stop order now.
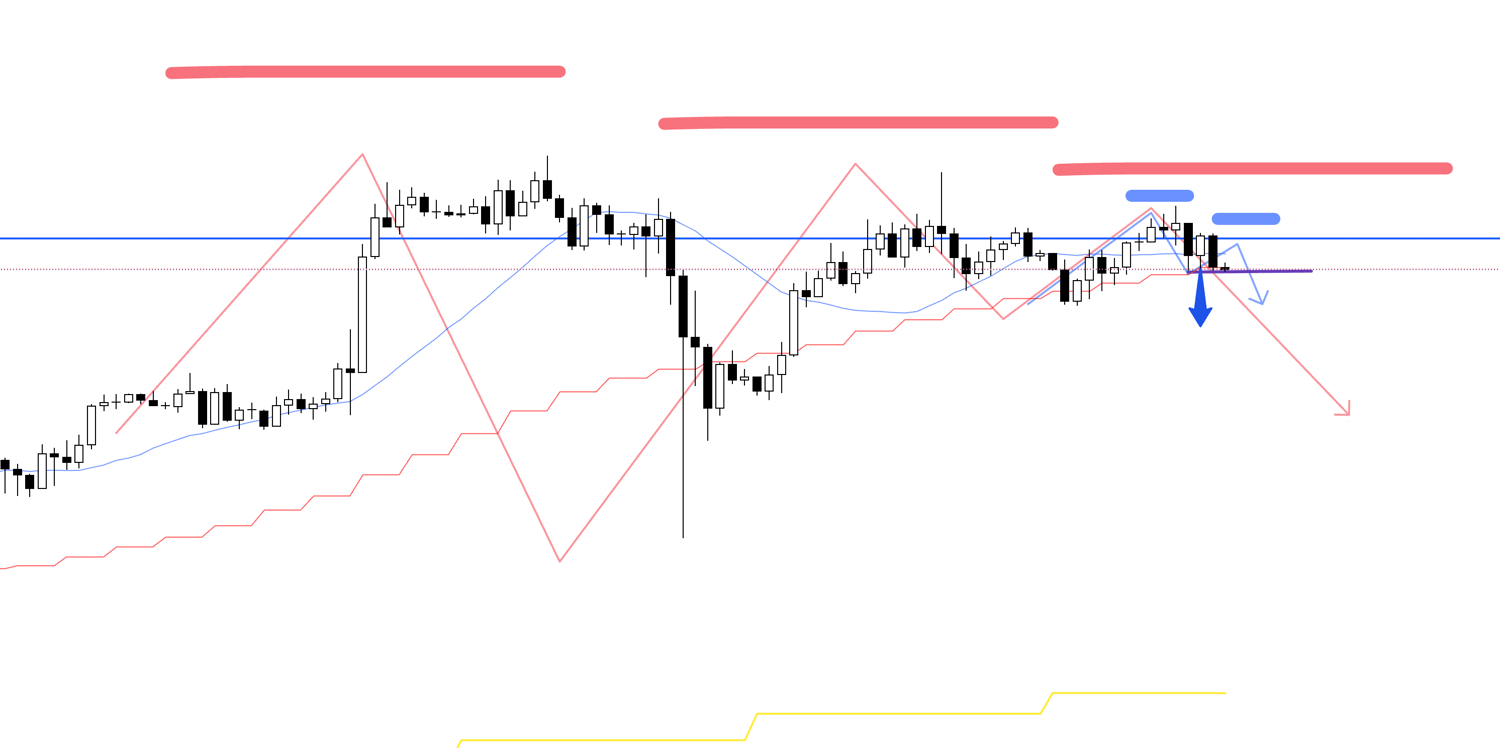
4h chart
On the 4h chart, it's at a point where it might be making a lower high, but at the same time, it also looks like it's trying to make a higher low.
In such cases, it's important to prepare both buy and sell scenarios and wait so you can respond whichever way it moves.
I will explain this later.
Now let's look at the 1h chart as well.
1h chart
This is the 1h chart, and as you can see, within the 4h's lower high point, the 1h is also making a new low and trying to make a lower high.
A little while ago, the 4h moving average was coming up from below at a sharp angle, making it difficult to sell, but at this 1h new low point, it is also about to break below the 4h moving average at the same time.
In a situation like this, it is a point where I want to sell.
Now let's look at the even lower timeframe 15m chart.
15m chart
As you can see on the 15m, within the 1h's new low and lower high point, it is also making a new low while trying to make a lower high.
This time too, it's exactly the same trade as always.
The line drawn in blue is recognizable on the daily chart as well, functioning as a line that separates buyers and sellers, and if it reverses here, I plan to follow the subsequent downtrend on the lower timeframes.
Let's check this blue line on the daily chart.
Daily chart
As you can see, buyers and sellers are separated by this blue line, and if it is held down by this blue line again and makes a lower high, as a trend follower, it is a point I want to trade.
However, this downtrend on the 4h and lower timeframes is a decline to create a dip on the daily chart, and the lower it goes, the more the daily chart's buying on dips will be recognized, and there is a risk that buying pressure will increase.
It is necessary to enter while considering these factors.
I mentioned earlier that it is necessary to prepare both buy and sell scenarios this time, and the price action around this blue line is important.
For example, a buy scenario would look like the following.
4h chart
As you can see, on the 4h chart, it's a point that also looks like it's making a higher low.
Let's display the previous blue line here and look at the 1h chart.
1h chart
On the 1h chart, if it is supported by the blue line after this and makes a new high while making a higher low, it is necessary to make a buy entry.
In this way, if you can only draw one scenario, you will overlook the trading opportunity on the other side, so it is necessary to look at the chart calmly without being biased toward one side.
And by drawing both scenarios, whether the chart goes up or down, no matter how it moves, there is no problem at all, and you just execute the actions you had prepared.
As I am writing this sentence, the price has just broken the low, the order was filled, and it became an entry.
15m chart
The stop order was just filled and I'm in.
This is the actual cTrader 15m chart right after entry.
15m chart
I set the SL just above the 15m high.
I've drawn a green line to make it easier to see, but this high has also functioned as a line separating buyers and sellers on the 15m chart in the past, making it a point with a very high edge.
I plan to hold this position until the trend breaks down.
15m chart
It made a new low and a lower high, so I lowered the SL to the newly formed recent high.
I plan to continue trend following, but today is Friday, and I do not carry positions over the weekend, so I will either hold until the time is up and close it manually, or I am thinking of closing it if it reaches the green line drawn at the bottom of the chart.
This line is a high that can be confirmed on the weekly and daily charts, and there is a possibility that the price will react here once, so since there isn't much time left today, I will close the entire position if it reaches here.
By the way, if you check this on the daily chart, it's as follows.
Daily chart
On the daily chart, it is this line.
Normally, I wouldn't close all positions at a specific point like this, but this is a closing rule specific to Fridays "to avoid carrying positions over the week".
I closed a position for a similar reason last Friday, so if you're interested, please refer to last week's trade report as well.
As I was writing that, I got a notification that it was closed, and the trade was over.
It seems it didn't reach the TP I had set and was pushed back, hitting the SL.
Now, I will summarize this trade.
15m chart

This trade was also exactly the same as always.
Within the 4h's lower high point, the lower timeframe 1h also made a lower high, and within that, on the right side, the 15m also confirmed a lower high and entered at the point of a new low.
After entry, I lowered the SL each time it made a lower high, and finally, it was closed when the trend broke down.
This time, I was able to lower the SL to almost the break-even line, but it ended up being a trade with a small loss.
However, if it crosses this line, the lower highs on the 15m chart will end, and the downtrend will be over, so it is absolutely necessary to close at this point.
Losses that occur while repeatedly taking the necessary actions according to the rules are a cost.
What is important is whether you were able to trade as per the scenario, as always; it's the process.
〜・〜・〜・〜・〜・〜・〜・〜・〜・〜・〜・〜・〜・〜・
That is all.
The trades I actually made this week were these three.
The number of trades cannot be controlled and depends on the market, but the important thing is to always repeat consistent trades with consistent judgment.
You must not think, "I can't make money this week because I have few trades," and make unnecessary trades and incur unnecessary losses.
It is precisely because you do the trades you should do when you should do them that the resulting losses function as a cost.
To commemorate the launch of the blog, this "Weekly Trade Report," which is published regularly every Saturday, will be available for free for this month.
In this report published every weekend, I summarize my thought process (entry, stop-loss, take-profit decisions, etc.
) recorded in real-time for the trades I actually made that week.
From August onwards, this Saturday "Weekly Trade Report" is scheduled to become paid content, so please take this opportunity to experience my real-time thinking.
Please note that these are provided for educational purposes only and are not intended to give you trading instructions, nor do they guarantee future profits.
You are responsible for any and all trades you make, so please spend adequate time on strategy development and testing, and engage in trading at your own risk.
I hope that the explanation of my trend-following strategy will serve as a reference for your own strategy development.