


Hello.
Let’s set up scenarios for next week’s trades.
I post this “Trading Scenario” blog every Sunday.
And every Saturday, I publish a “Weekly Trade Report” where I share how I actually thought through and executed trades during the week.
By reading both the scenario and the weekly report, you can see how I prepare in advance, what I wait for, and how I execute—offering a consistent, practical process you can use as a reference.
For more on strategy, please see my blogs on Dow Theory and Multi-Timeframe Analysis.
A scenario is not a forecast.
It is not about predicting, but rather “If this happens, then I will do this”—my personal plan.
I do not predict the market, and this is not intended to be read that way, so please keep that in mind.
Also, this does not provide buy/sell instructions or signals.
It does not guarantee future profits.
It is purely for educational purposes, showing how I execute a consistent process.
I cannot take responsibility for the outcome of your trades, so please trade at your own risk.
Now, let’s start with USDJPY.
(On my charts, the lines are colored as follows: orange for daily, red for 4h, blue for 1h, and green for 15m, each representing the movement of that timeframe.)
〜・〜・〜・〜・〜・〜・〜・〜・〜・〜・〜・〜・〜・〜・
USDJPY
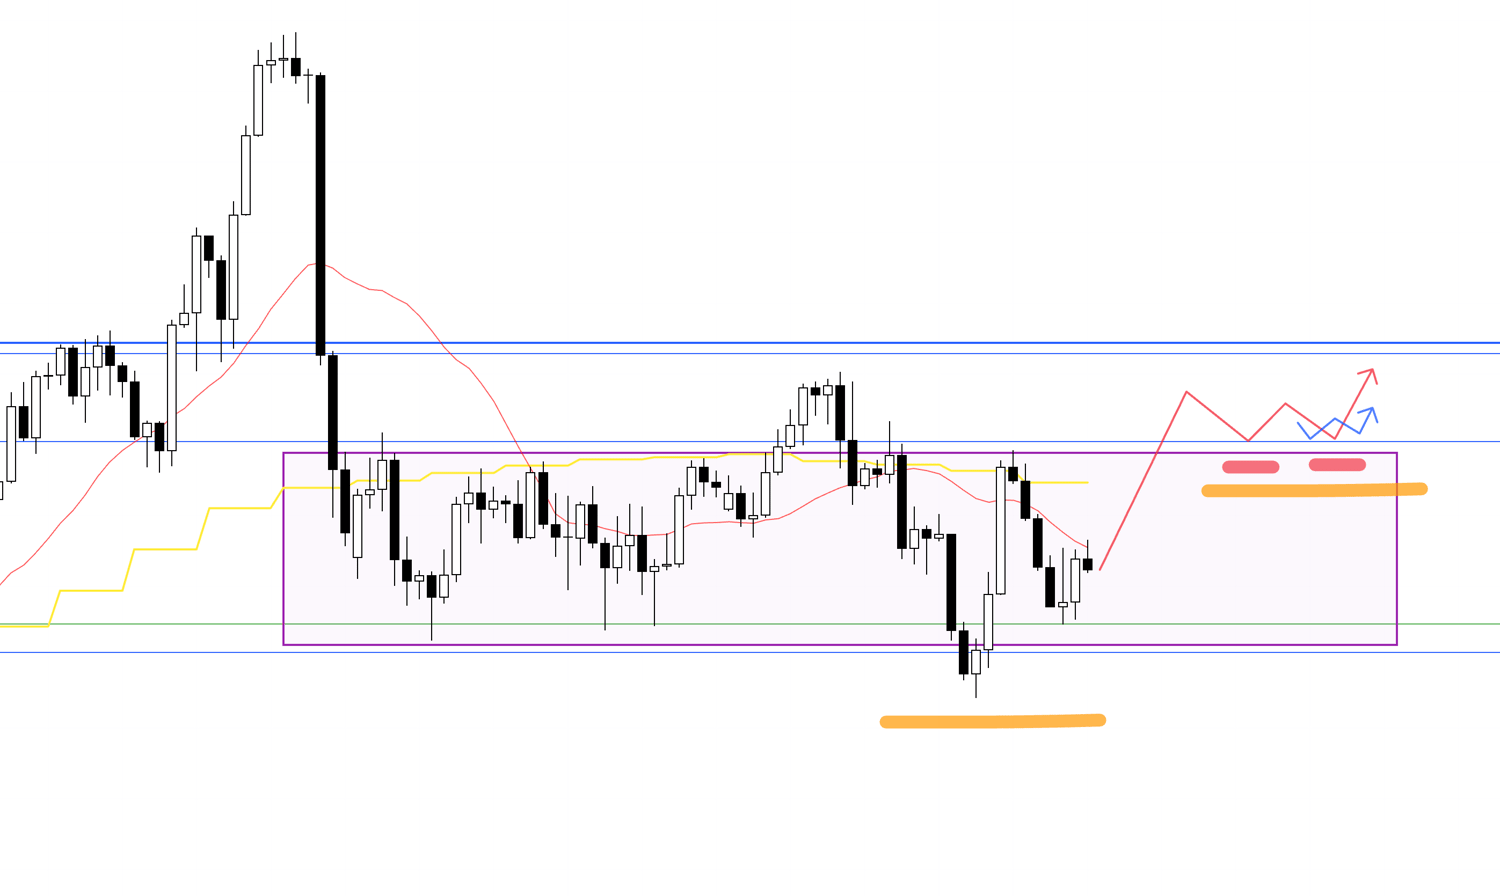
Daily
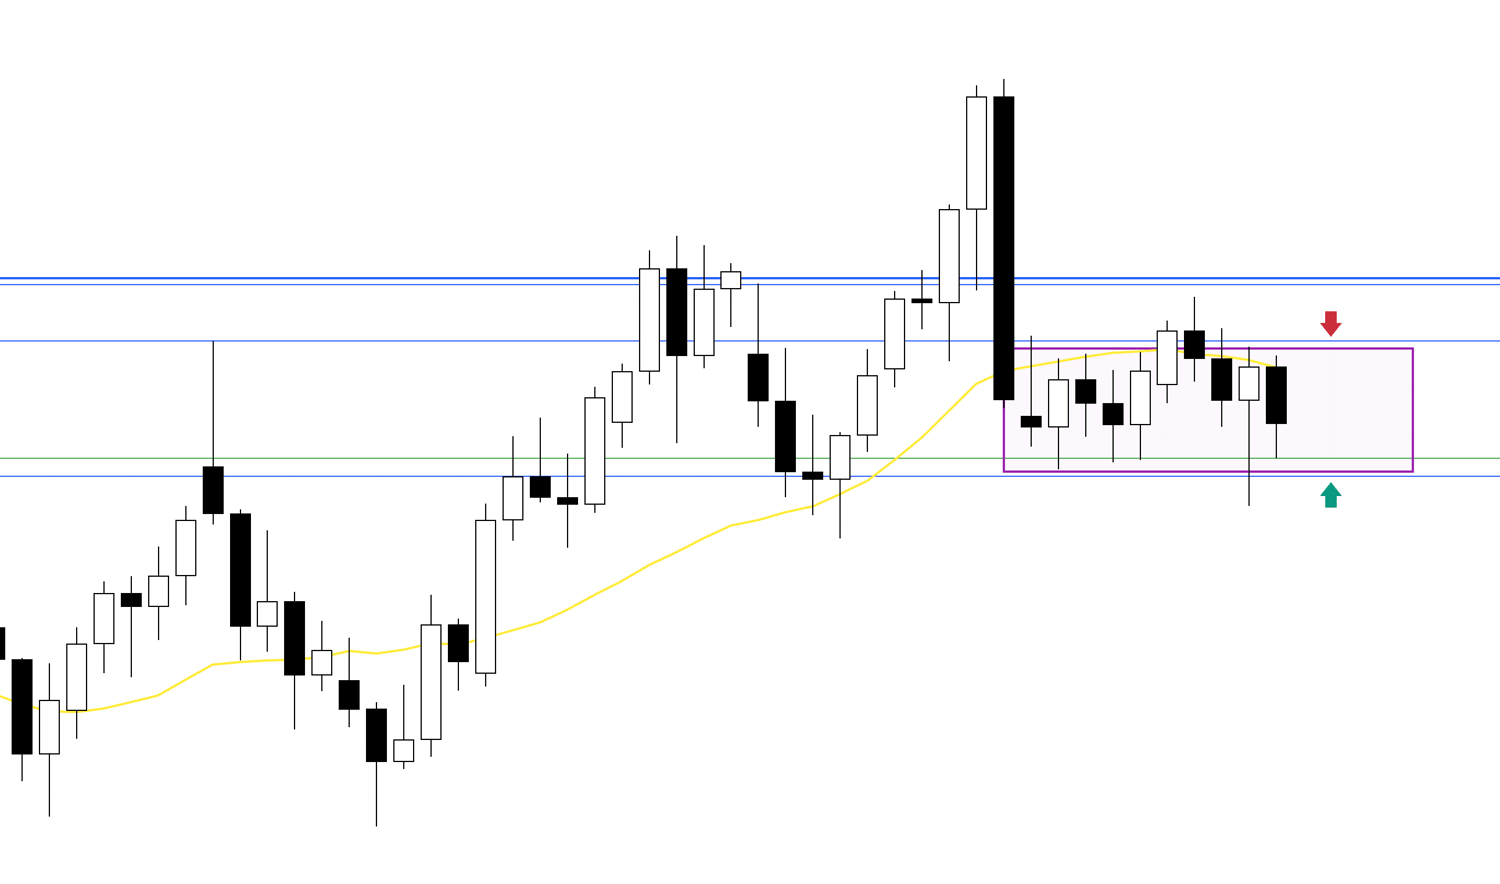
As noted in last week’s scenario, the daily chart shows price caught between resistance and support, with both buying and selling pressure preventing clear direction.
Even from a Dow Theory perspective, we saw a potential higher high, but then without setting a higher low, price broke the previous low—no trend is established.
On the daily, price has dipped below the moving averages and is showing signs of lower highs, but on the weekly, it still looks like a pullback in an uptrend.
This purple-highlighted area represents the overlap of both orders, which increases the risk of choppy movement on lower timeframes.
Let’s look at this on the 4h chart.
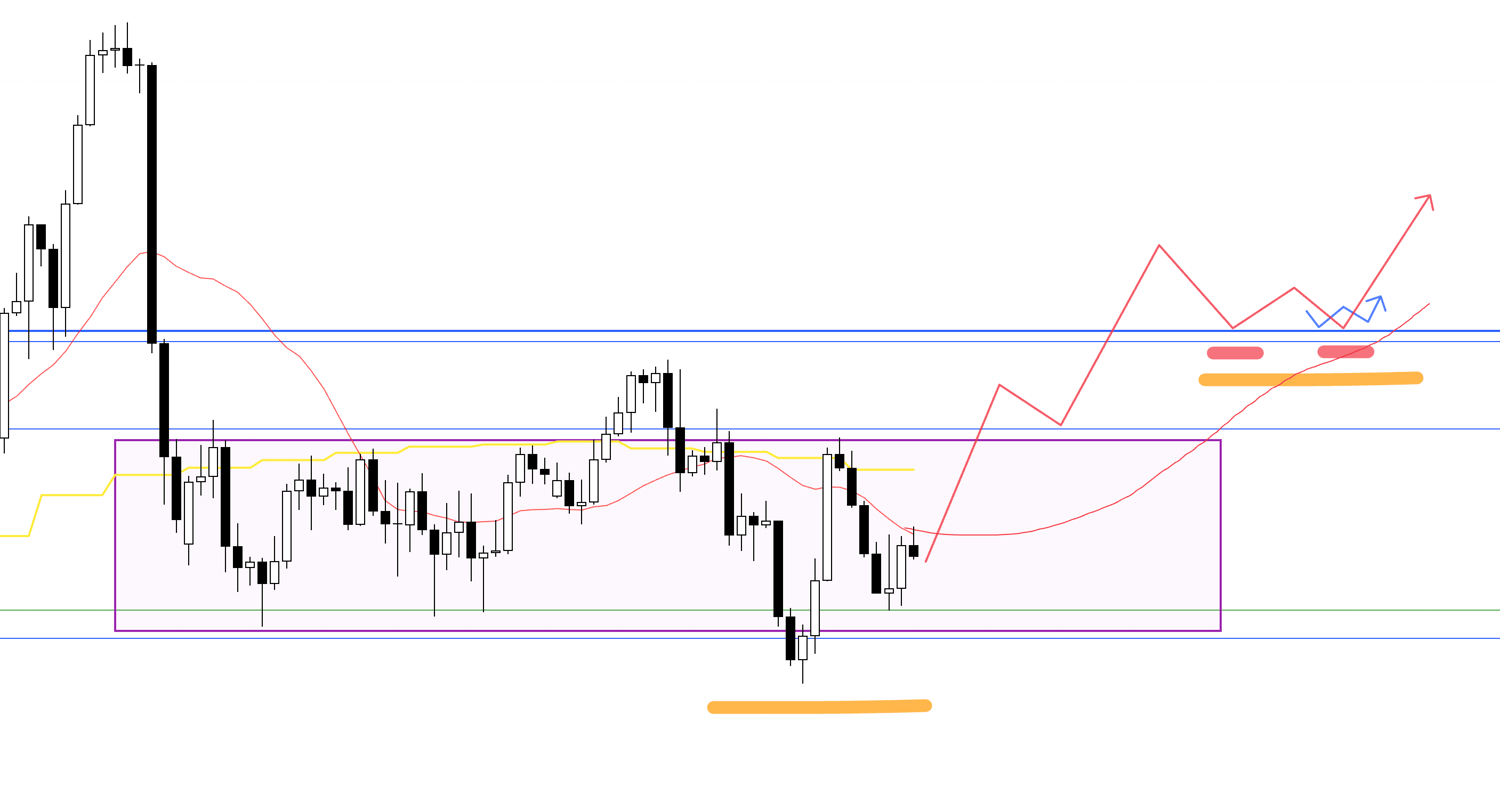
4h
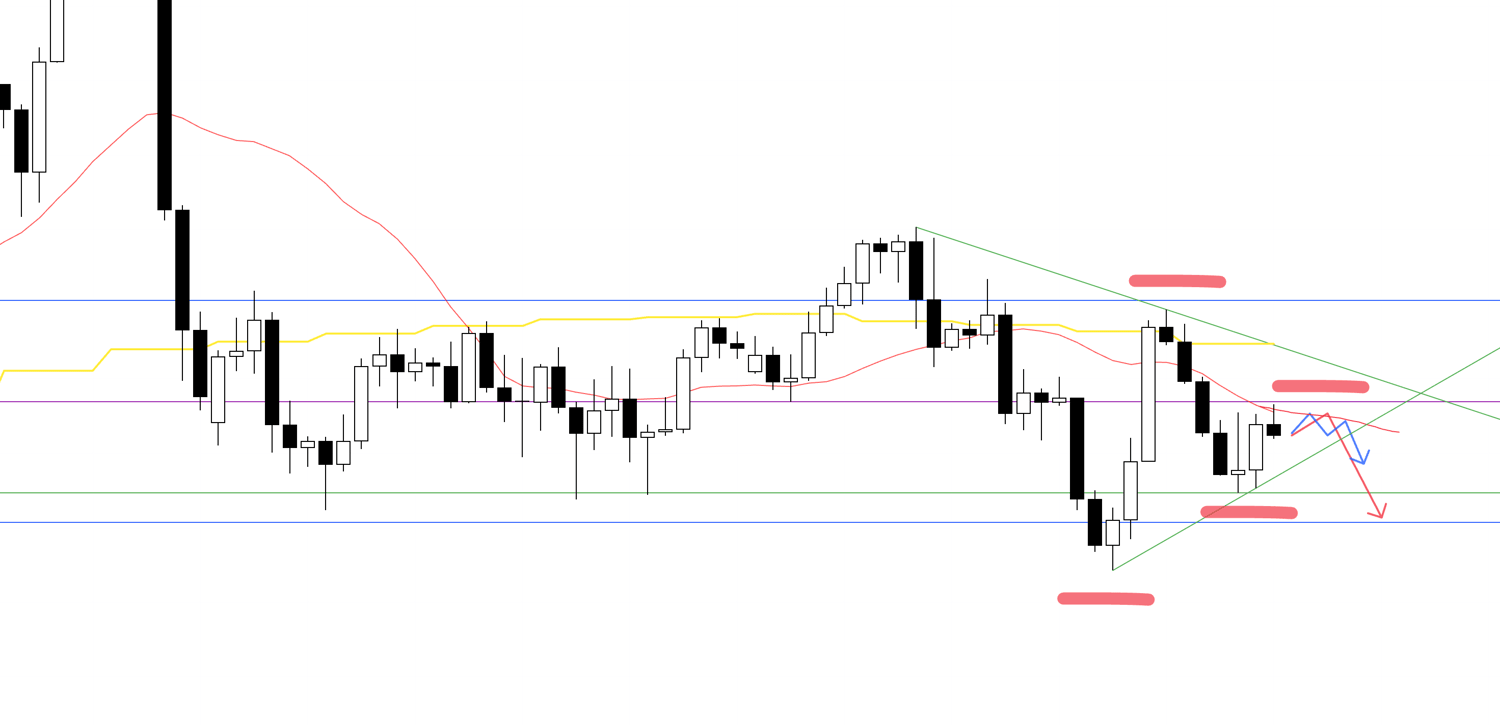
Since the daily broke its low, one could consider shorts at the 4h lower high.
But recent 4h lows were supported multiple times at the green line, making it possible that 4h begins to form higher lows instead.
When price is squeezed between lower highs and higher lows, the risk of choppy moves rises.
So, I prefer not to trade in this zone.
Let’s return to the daily chart.
Daily
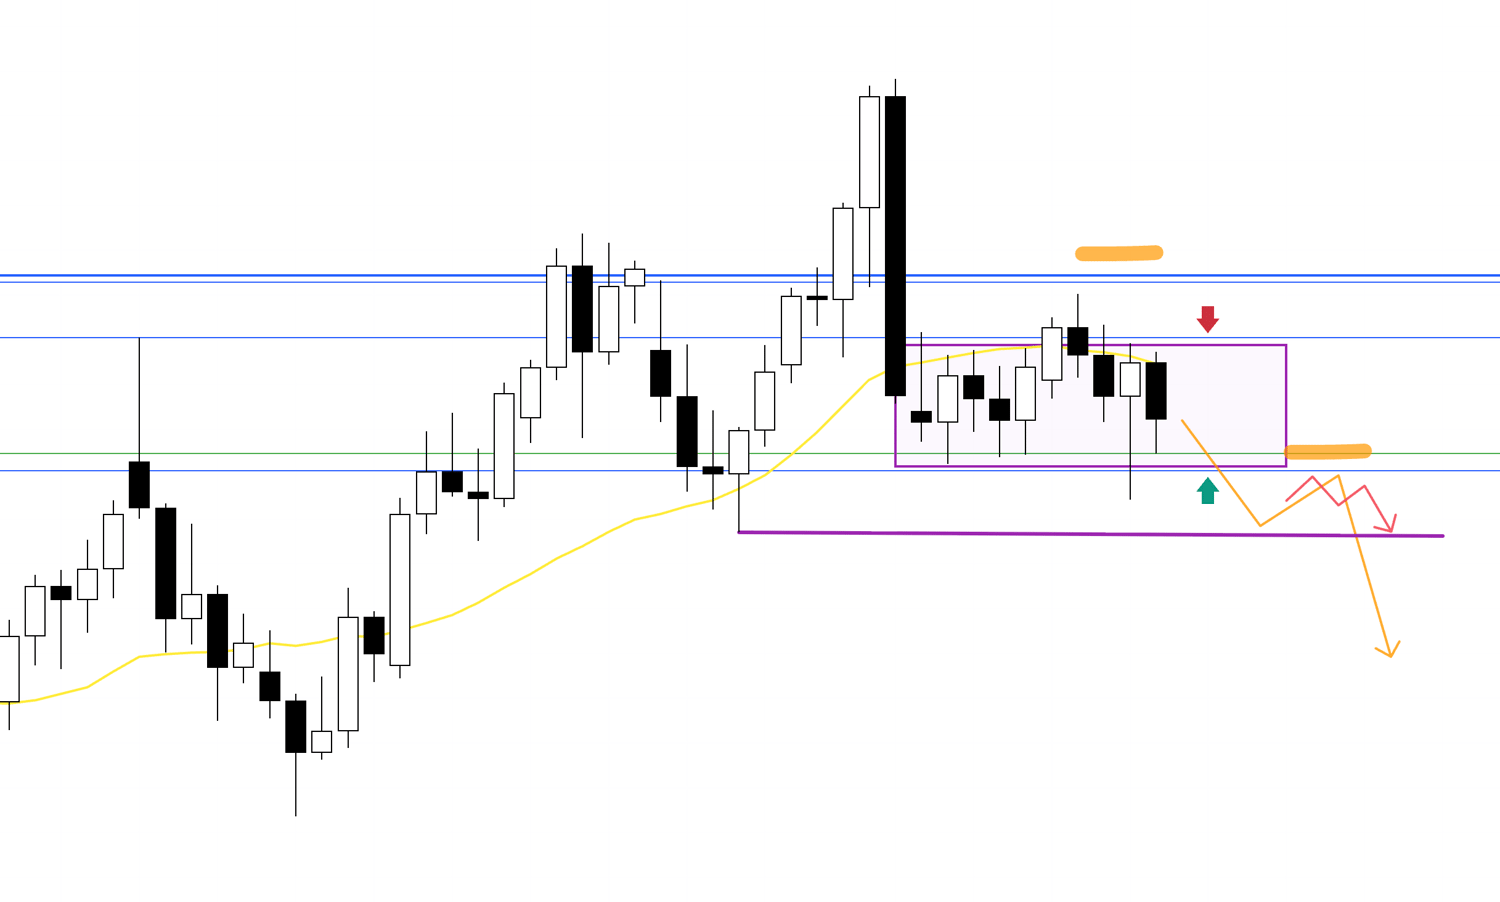
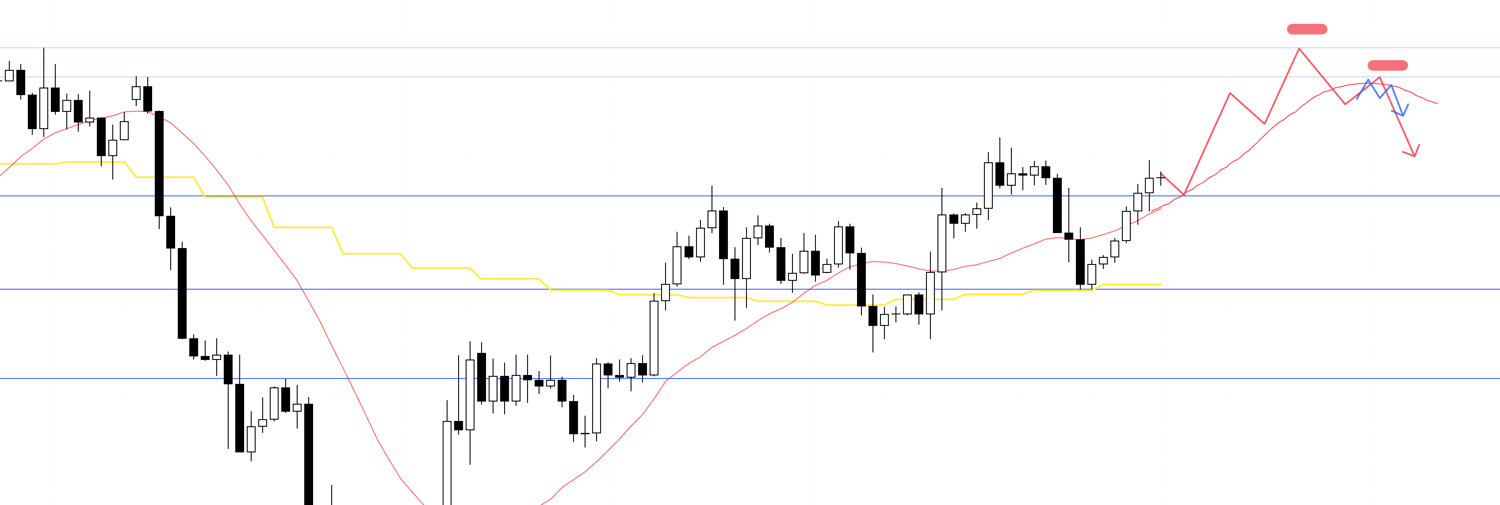
If price breaks the support line below and establishes a new lower high, then trading at 4h lower highs becomes easier.
In this entry scenario, the first key point after entering is whether price can break the purple daily low.
If it does break through, it will likely trigger a wave of additional sell orders, making it a point where a larger decline can easily develop.
Let’s view this on the 4h chart.
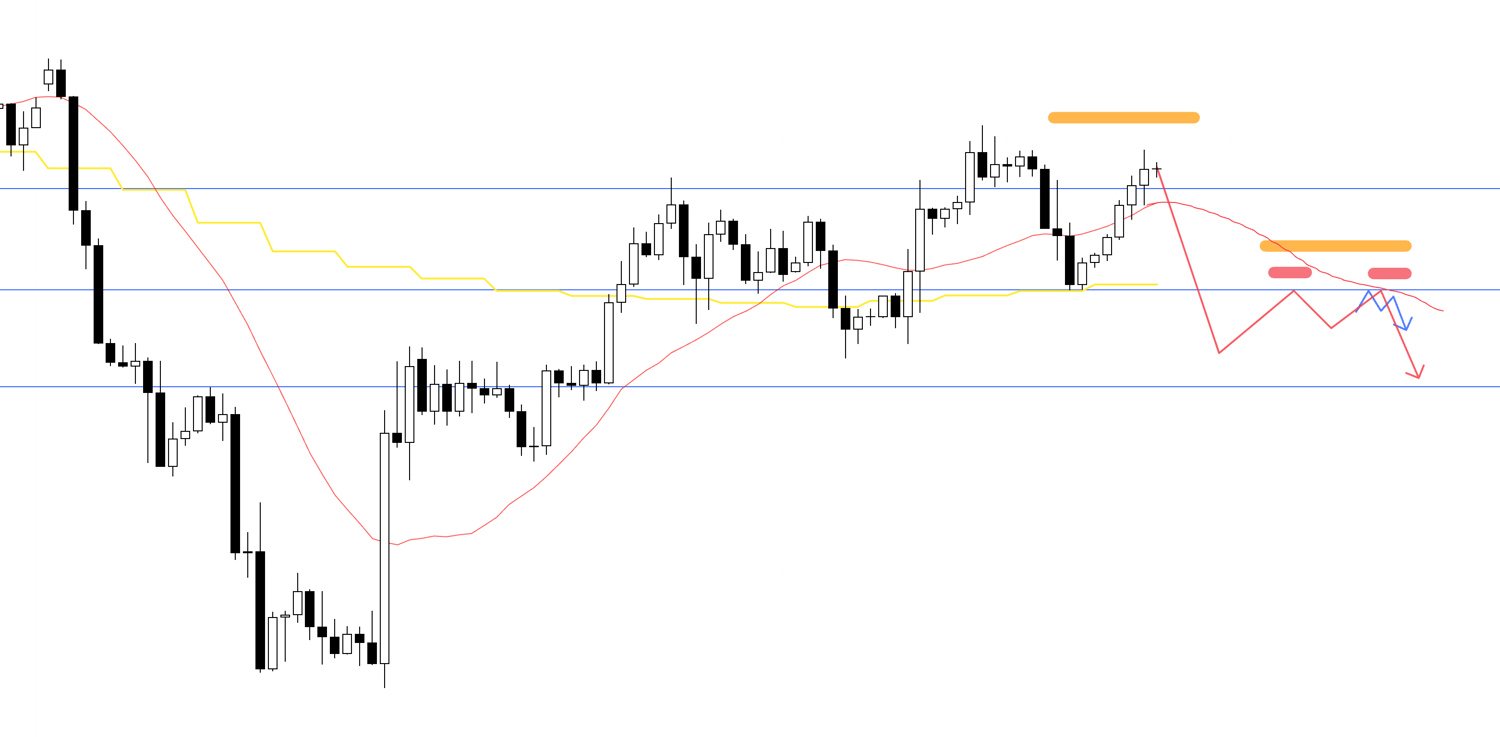
4h
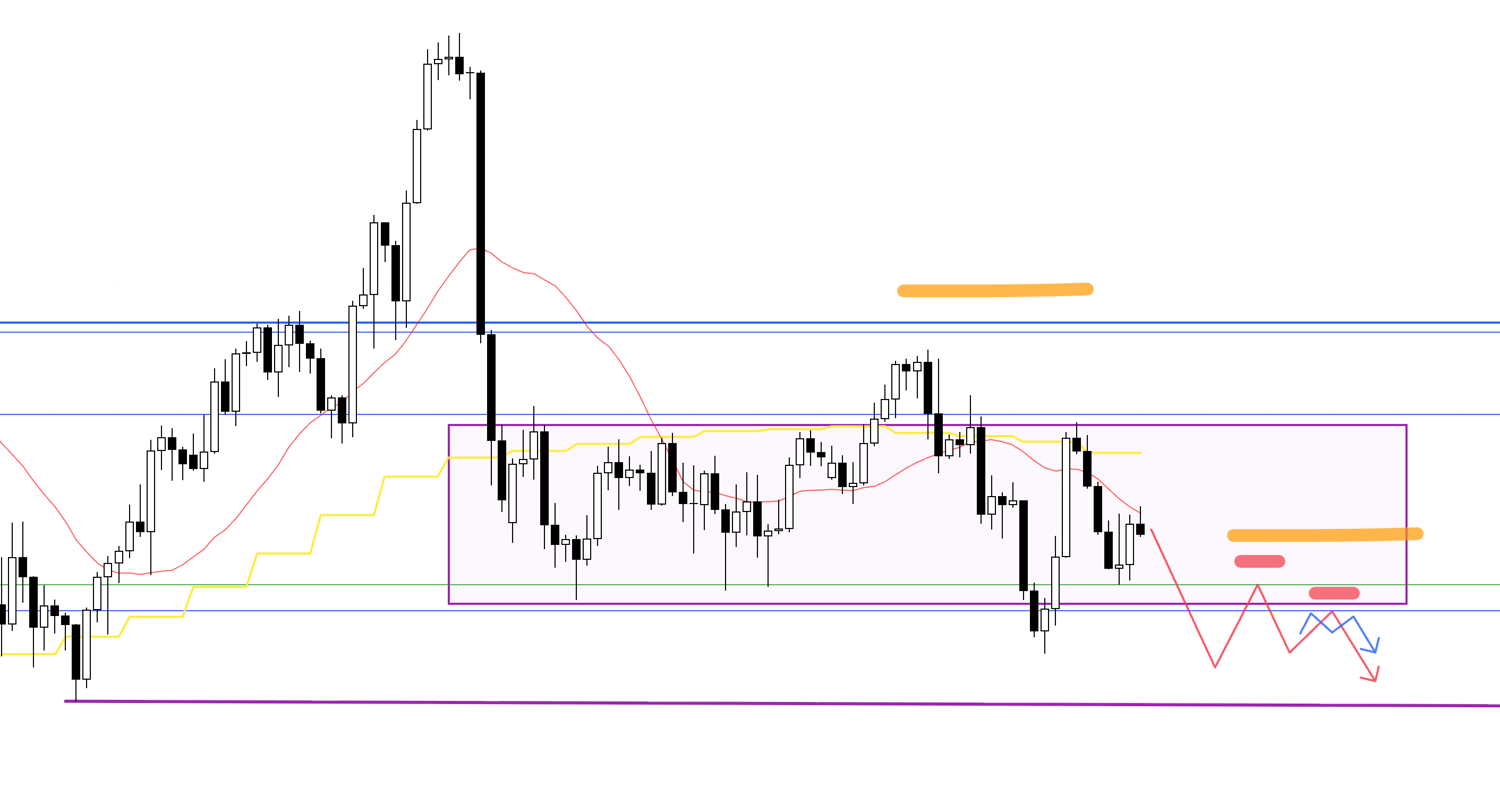
Here, we see that the current support could flip into resistance.
If the 4h shows a lower high at that level, and that point also aligns with a daily lower high, short setups gain strong validity.
Now let’s consider a buy scenario.
4h
For buys, I would avoid trading within the purple zone.
Instead, if price breaks above resistance and then retests it as new support—forming a higher low on 4h—I would consider entries on lower timeframes.
But since there’s another resistance level not far above, risk-reward alignment is key.
4h
If risk-reward does not align, I would wait.
If price breaks further above resistance and the daily forms a higher low, I would then look for 4h higher lows to trigger lower-timeframe entries.
Overall, USDJPY is currently in a difficult area to trade.
I will wait until direction becomes clear before taking positions.
By deciding not to trade in “difficult” zones, I eliminate “difficult trades” and focus only on repeating trades in clearer conditions.
Now, let’s move to EURUSD.
〜・〜・〜・〜・〜・〜・〜・〜・〜・〜・〜・〜・〜・〜・
EURUSD
Daily
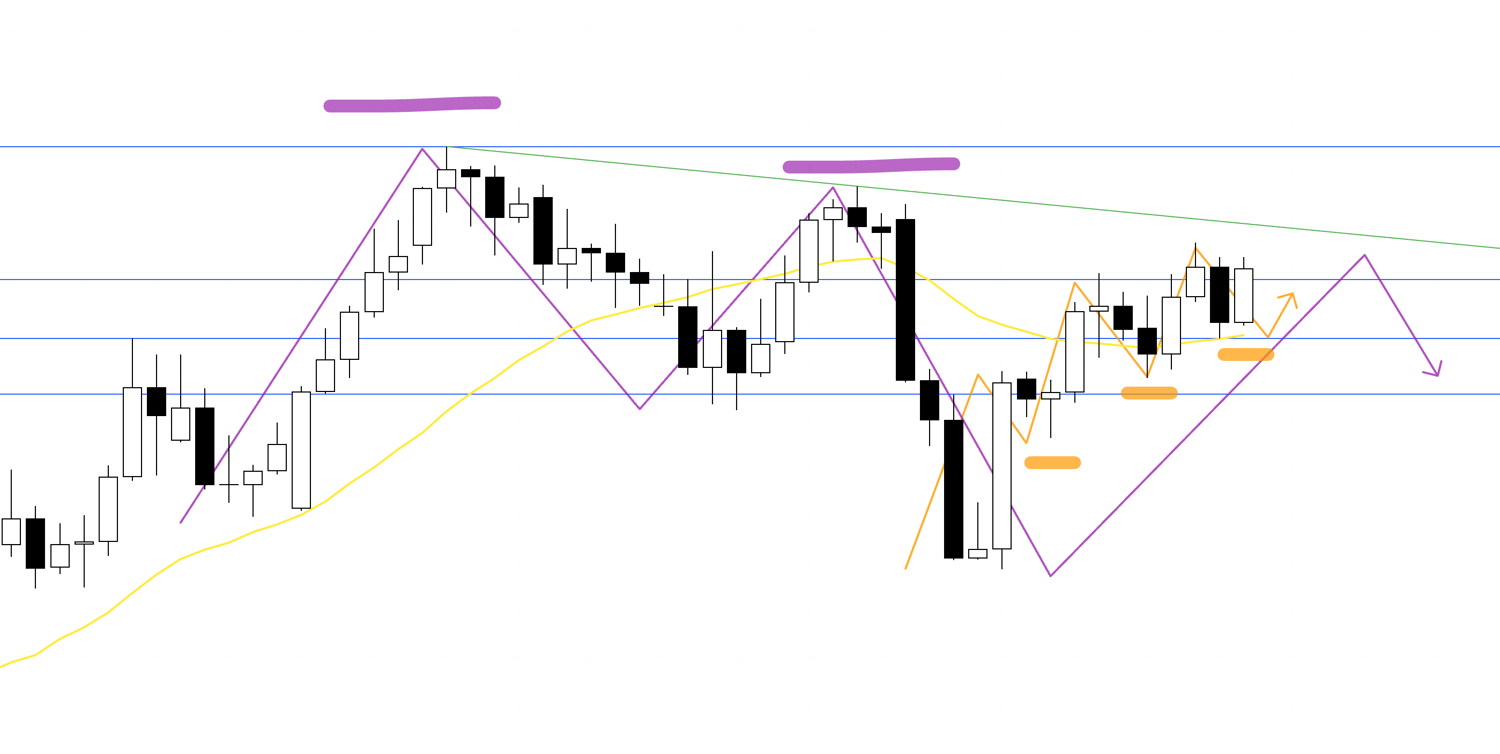
The daily chart shows higher lows and an uptrend.
So ideally, I want to buy on 4h pullbacks.
However, the weekly chart shows a lower high after breaking the low (highlighted in purple).
This suggests that trendlines drawn from those weekly levels (green) could come into play, so any buys must account for these risks.
For sells, since the daily is in an uptrend, dip-buying pressure is strong.
I would need to wait until that pressure clears before considering shorts.
Let’s look at the 4h chart.
4h
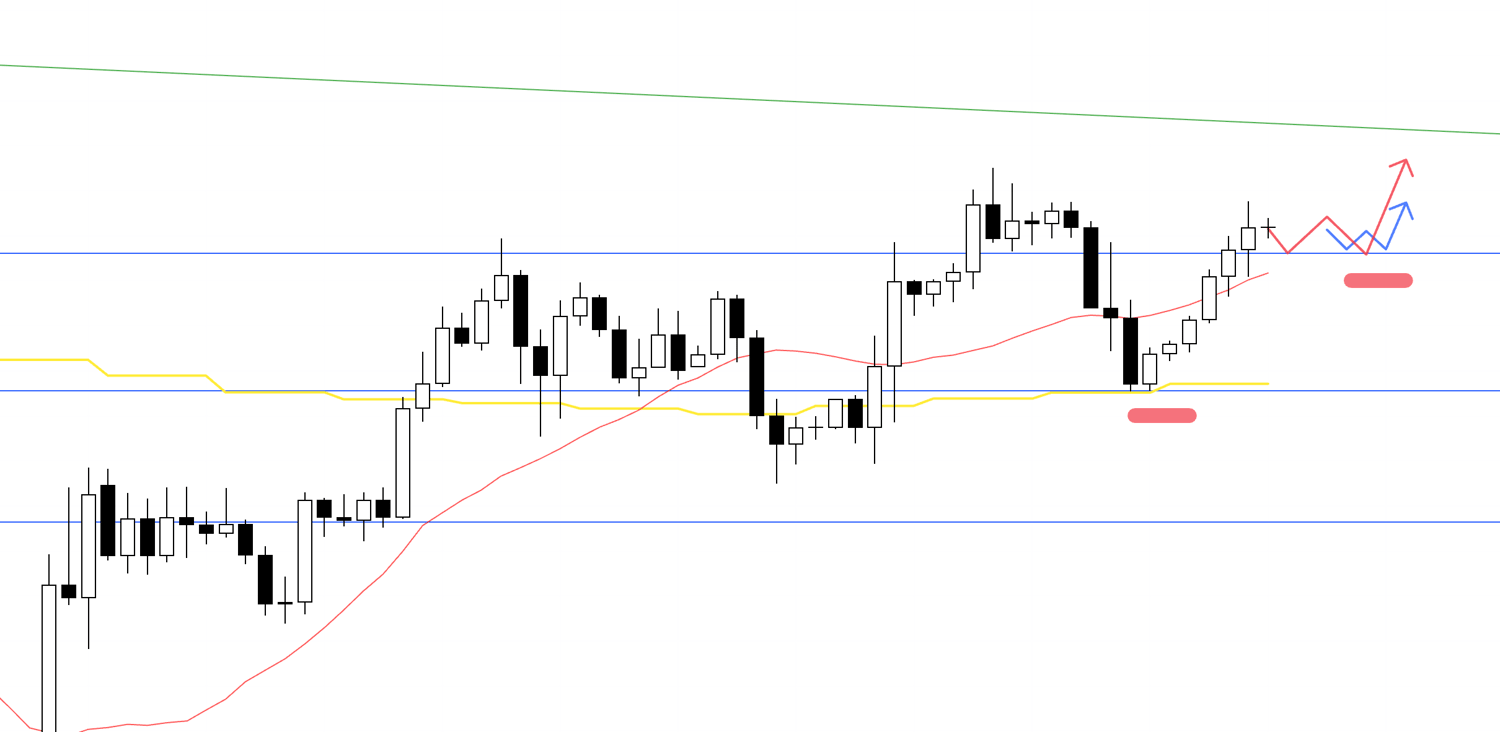
Here, buying opportunities would come at 4h higher lows, confirmed on lower timeframes with a break of prior highs.
4h
For shorts, one scenario is if price fails at a high and 4h shows a trend reversal.
Ideally, moving averages would flip from support to resistance.
If highs cannot break through, the weekly may form a triple top.
A 4h downtrend reversal in that context gives temporary selling advantage.
However, daily still shows an uptrend with higher highs.
That means “buy the dip” remains the prevailing sentiment, increasing buying pressure as price falls.
So for shorts, the key is whether an opportunity arises to enter from higher levels with favorable risk-reward.
Let’s consider another short scenario.
4h
Since daily is trending up, immediate shorts are difficult.
I would instead wait for a daily lower high to form, confirmed by a 4h lower high.
Note that blue lines below may act as support, so entries must align with risk-reward considerations.
〜・〜・〜・〜・〜・〜・〜・〜・〜・〜・〜・〜・〜・〜・
That concludes the scenarios.
These are current scenarios only.
As the week unfolds, I will update or rebuild them depending on price action.
In cases like USDJPY now—where buying and selling interests are balanced—it’s crucial to be cautious.
If many traders want to sell right above where you want to buy, that trade is highly unfavorable.
Thus, what matters most is whether orders concentrate heavily in one direction.
Through multi-timeframe analysis, I identify where trader orders are likely to cluster.
This allows me to repeatedly take trades with high win probability and strong risk-reward.
When conditions aren’t present, it’s important to wait until the chart environment sets up.
Even if this reduces the number of trades in a week, trading only at truly worthwhile points is what allows the performance of your strategy to show through.
I hope this provides some insight.
This is only my trading plan.
If you don’t yet have a fixed approach, you may find it useful in building your own strategy.
But if you already have a solid plan, stick to your rules without being swayed by mine.
Thank you for reading to the end.