

I will review key trading takeaways, focusing on the trades I executed this week.
This “Weekly Trade Report” will be posted every Saturday.
If you read it alongside the “Trade Scenarios” I post every Sunday, you’ll be able to see how I think in advance and how I actually execute trades based on those scenarios.
This Weekly Trade Report was scheduled to become paid content starting in August, but due to strong interest I have extended the free period and kept it open.
From September onward, it will be offered as subscription-only paid content on X, with a significantly expanded format including video.
This is not advice to “trade this way,” nor am I claiming that it is the one correct approach.
It is not a showcase of individual wins and losses, nor a recommendation of any specific strategy based on those outcomes.
Its purpose is to demonstrate, at an operational level, how I repeatedly run a consistent process grounded in preplanned scenarios, so that you can use it as a reference for building your own strategy and maintaining process consistency.
The results are solely my own and do not guarantee your future profits.
With that firmly in mind, thoroughly test and prepare your own trading and act under your own responsibility.
I trade pullback buys and rally sells on the 4h chart.
For my pullback-buy and rally-sell methodology, please refer to my prior blog posts on Dow Theory and multi-timeframe analysis.
With that, please see the charts below.
USDJPY 4h
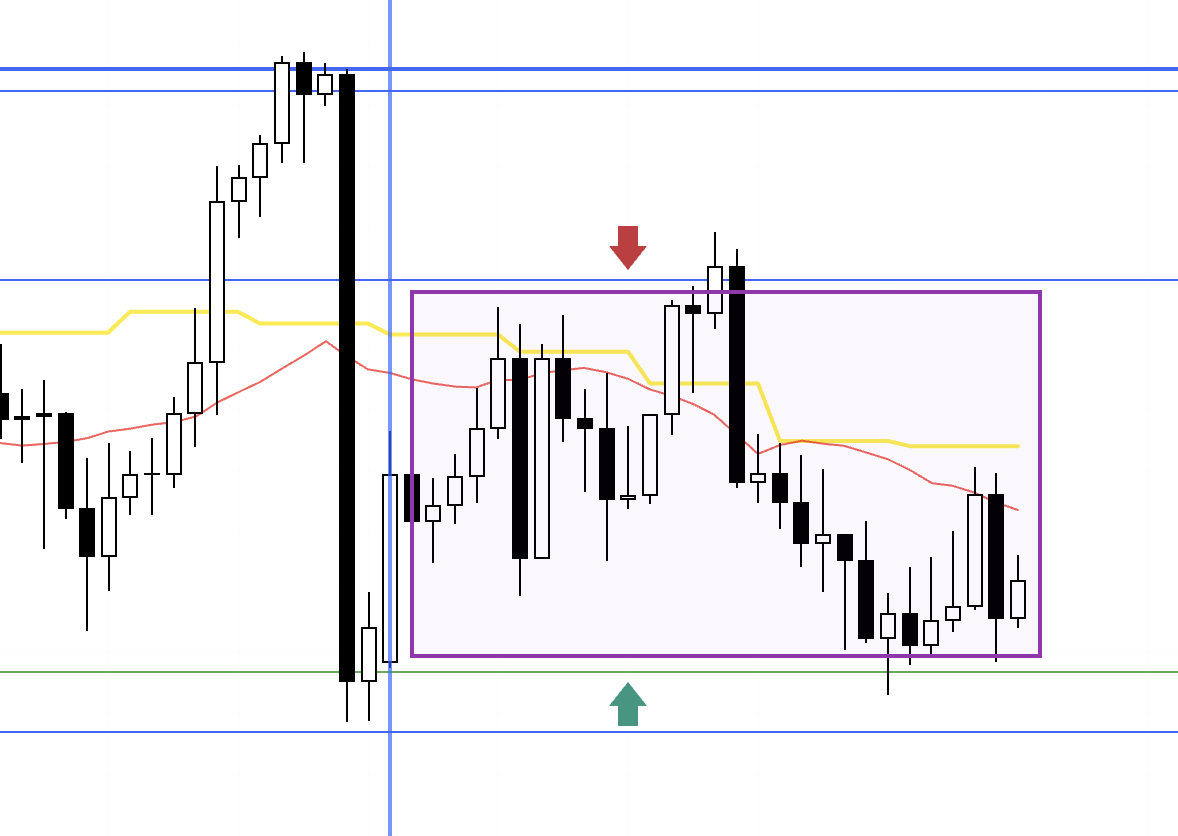
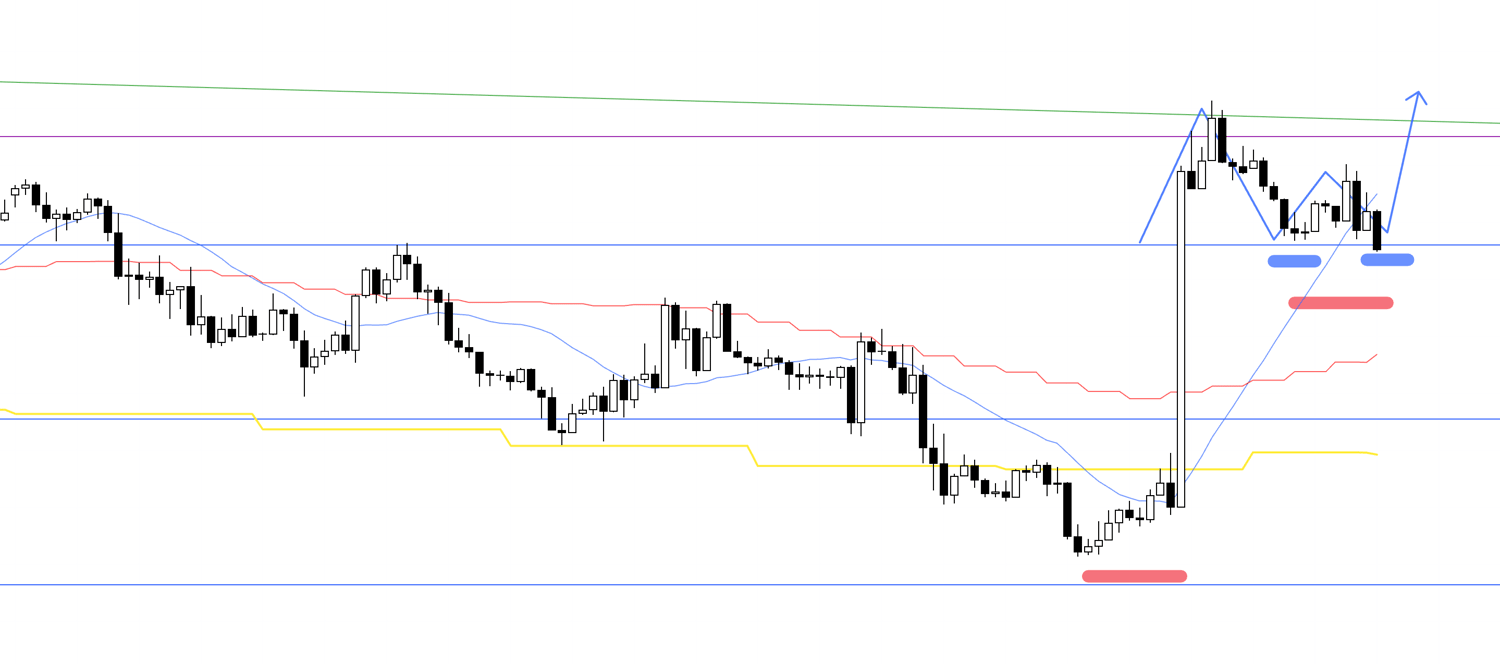
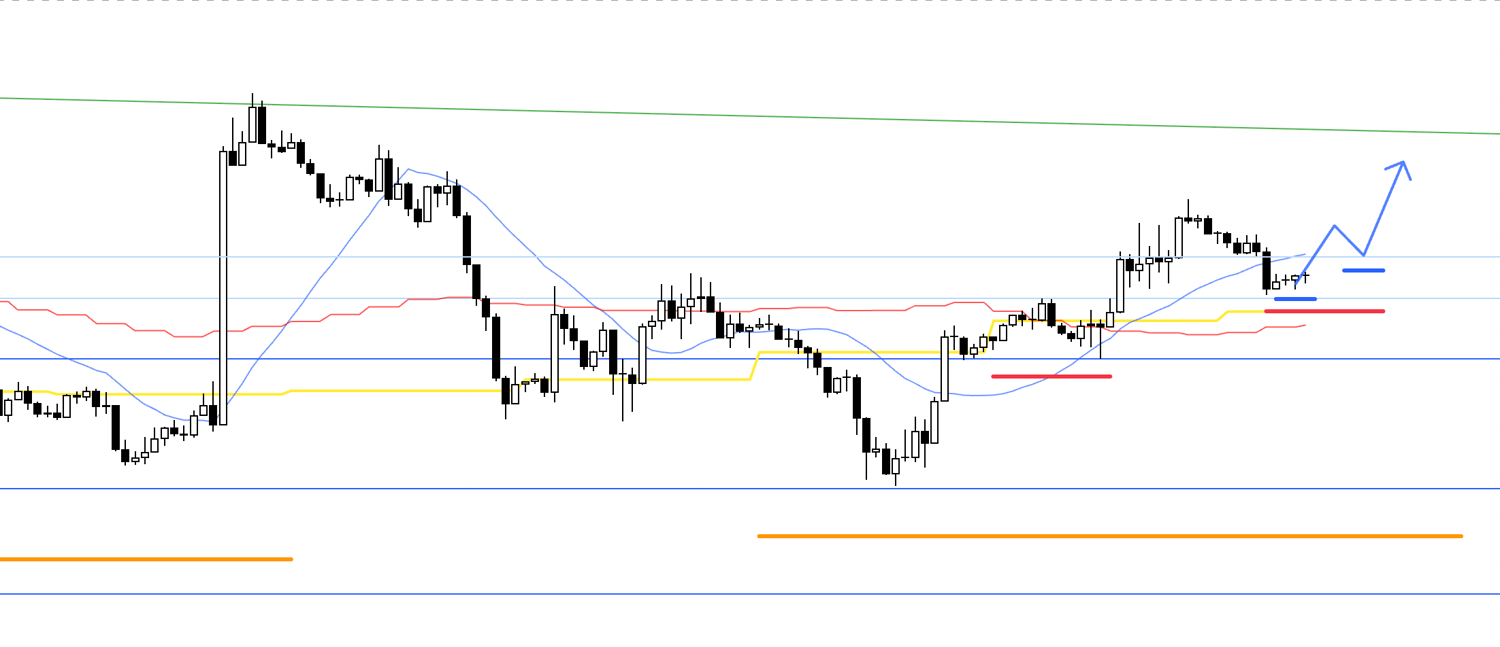
This is the USDJPY 4h chart.
This week’s price action is to the right of the blue vertical line shown on the chart.
Since two weeks ago I have noted in the scenario that I would only trade after price breaks out of the boxed area between the marked resistance and support.
This week it failed to break either side again, so there were no points to consider trades in USDJPY.
Next, please see the EURUSD chart below.
EURUSD 4h

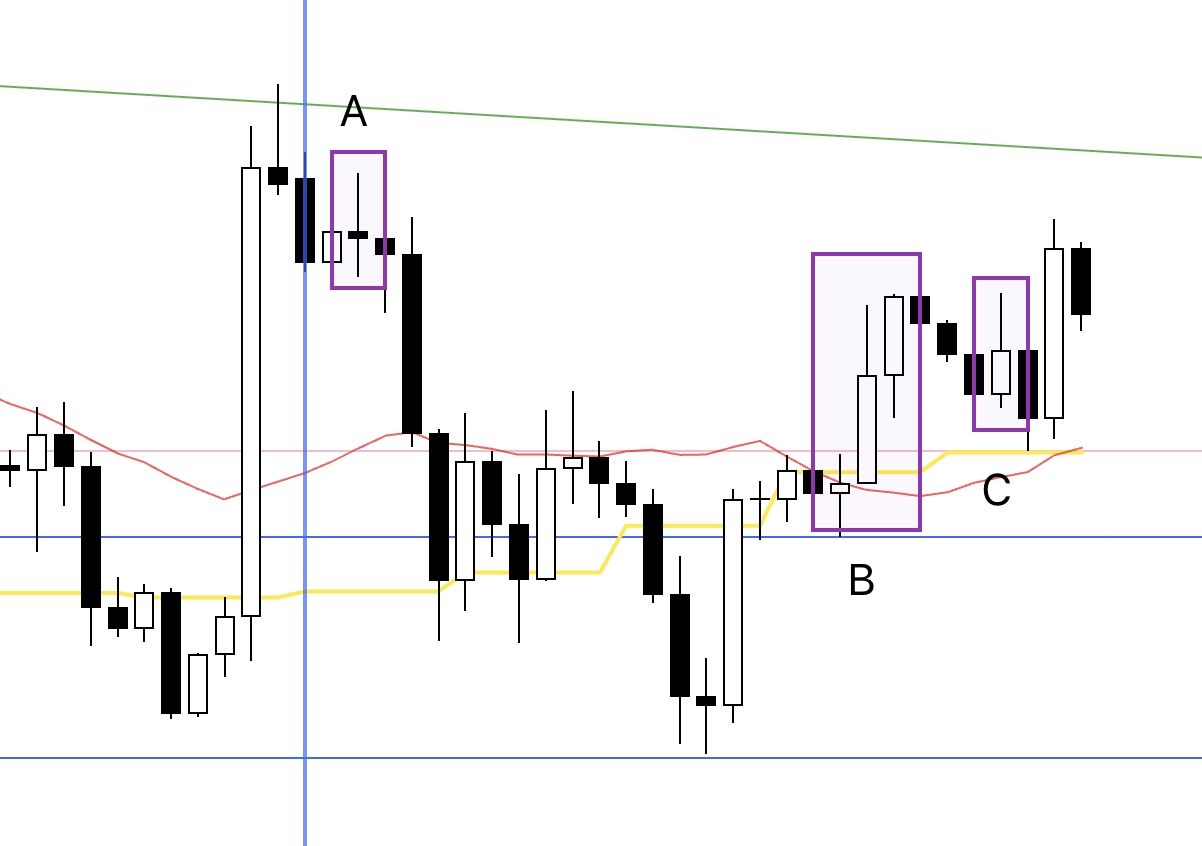
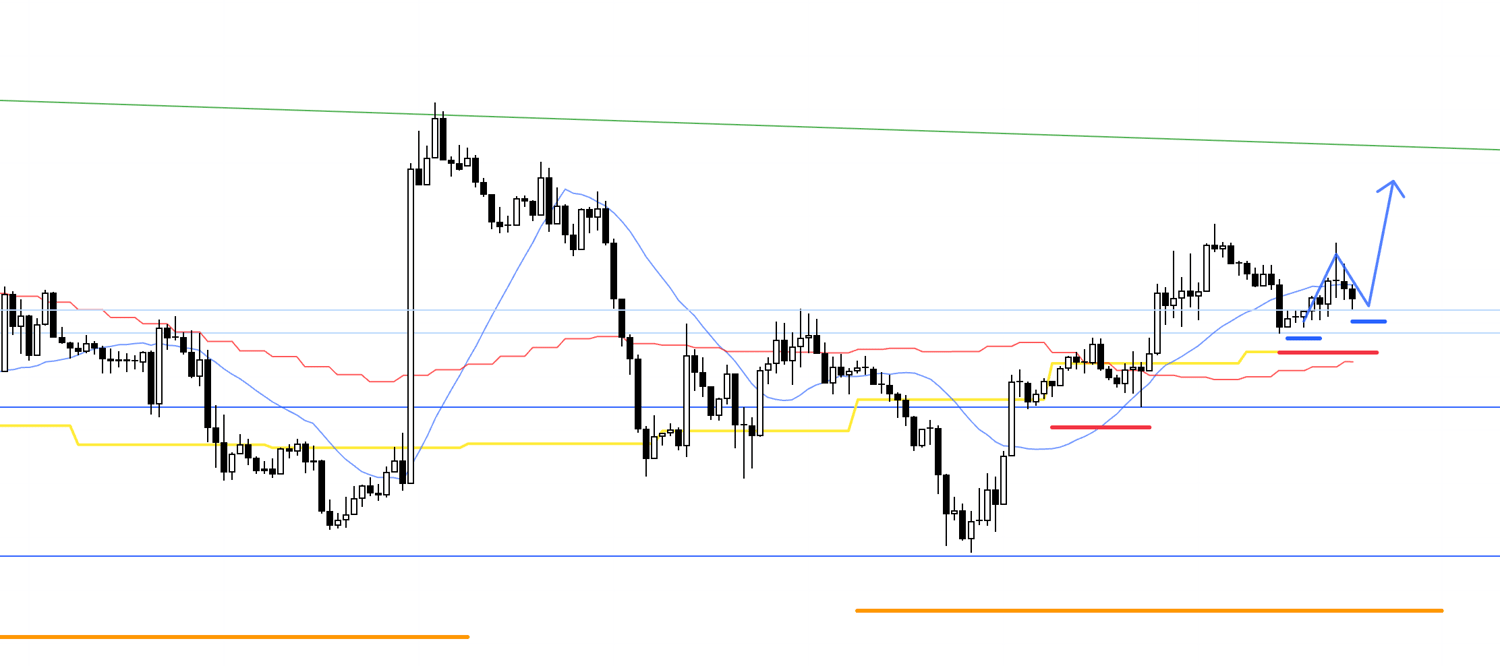
This is the EURUSD 4h chart.
There were three potential points to consider trades in EURUSD this week.
However, none ultimately met the conditions, so no entries were taken.
For A and C, I was writing the blog in real time while waiting for entry conditions, so I would like you to see how I was thinking and waiting.
Below is that record.
〜・〜・〜・〜・〜・〜・〜・〜・〜・〜・〜・〜・〜・〜・
Monday, August 25
EURUSD
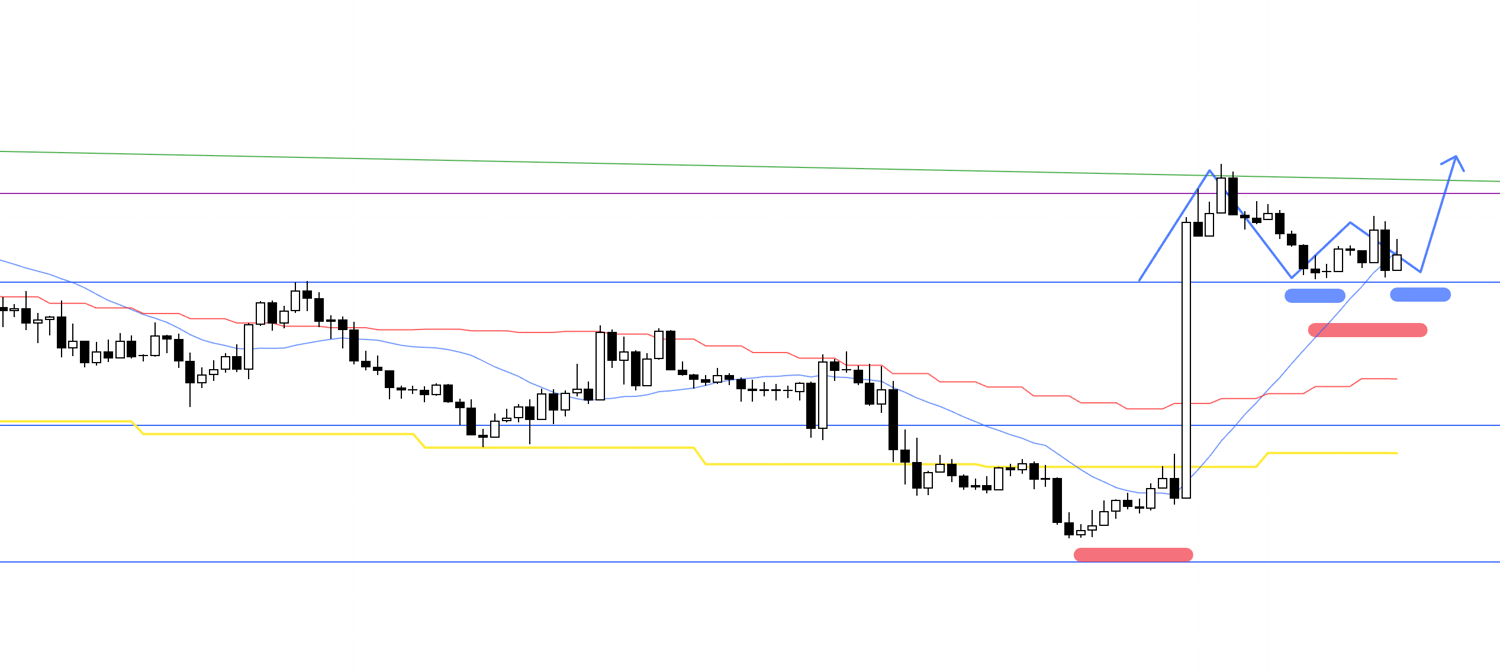
4h
On the 4h, price is forming a series of higher lows as if neatly supported by the blue support line.
If the lower timeframes turn into an uptrend within this structure, I want to join the move as a trade from the origin of the 4h uptrend and follow the advance.
However, as noted in last week’s scenario, highs are capped by the green trendline, price has already risen substantially, and considering the remaining range, this is a risky area.
In a situation like this, the key is how cleanly price shows support along the blue line, whether the lower timeframes turn up near that support, and whether the risk-reward to the green trendline above still makes sense.
Let’s drop down to the 1h.
1h
On the 1h, the question is whether price can keep making higher highs and higher lows from here, but I cannot enter on a breakout of the 1h high because the risk-reward does not work.
Risk is present here, and trades should not be taken unless the structure offers acceptable risk-reward.
In this case I will assess whether it is worth attempting on an even lower timeframe.
1h
I was waiting for the entry timing, but right after writing this the low was broken, so I canceled the setup.
I will wait for the next opportunity.
〜・〜・〜・〜・〜・〜・〜・〜・〜・〜・〜・〜・〜・〜・
Friday, August 29
EURUSD
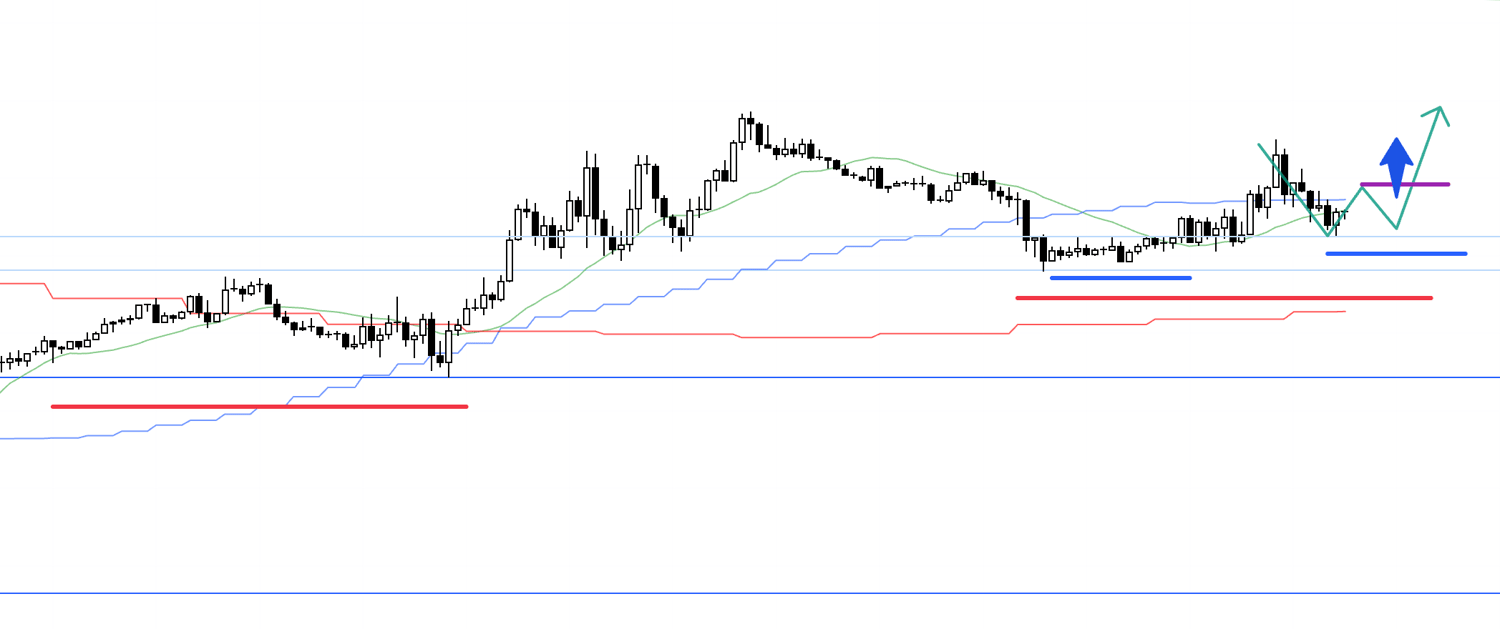
Daily
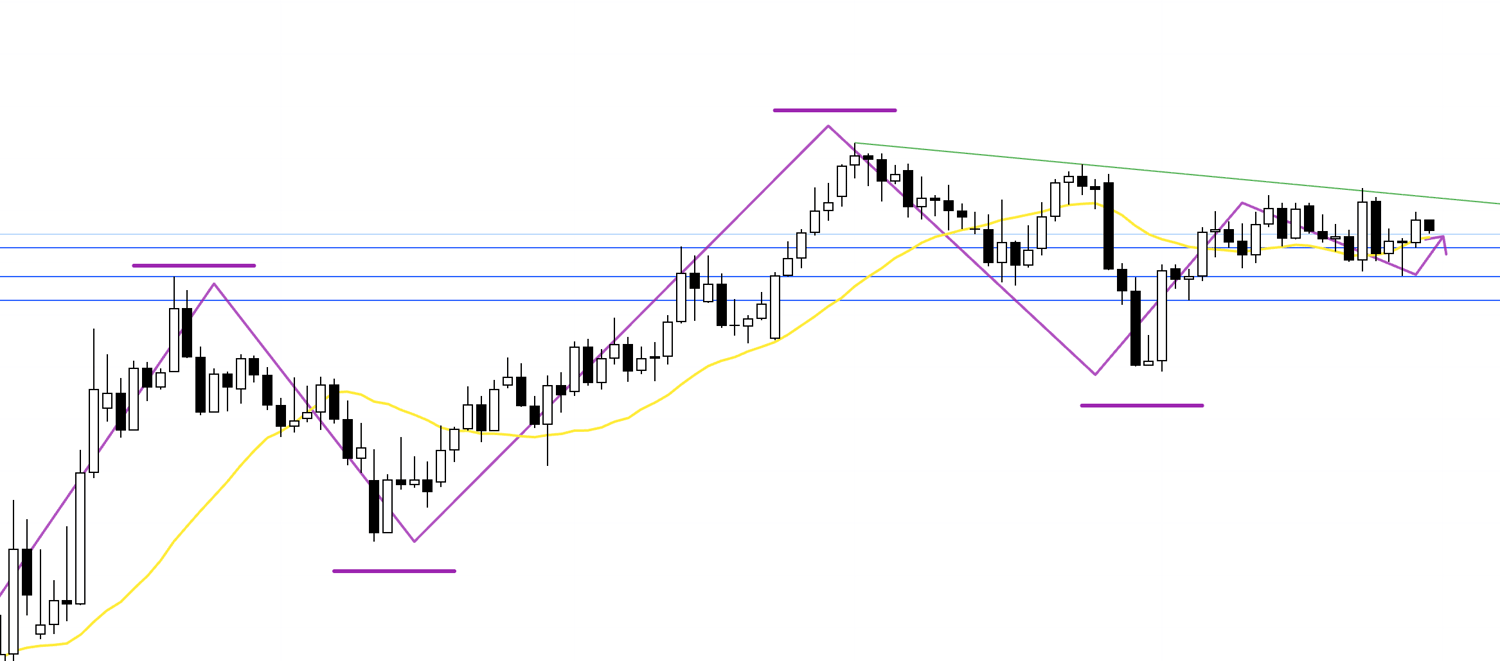
This is the daily chart, with the weekly structure overlaid in purple from above.
As you can see, the weekly is in an uptrend, printing higher highs and higher lows.
Within that, we are currently at a weekly pullback area.
Daily
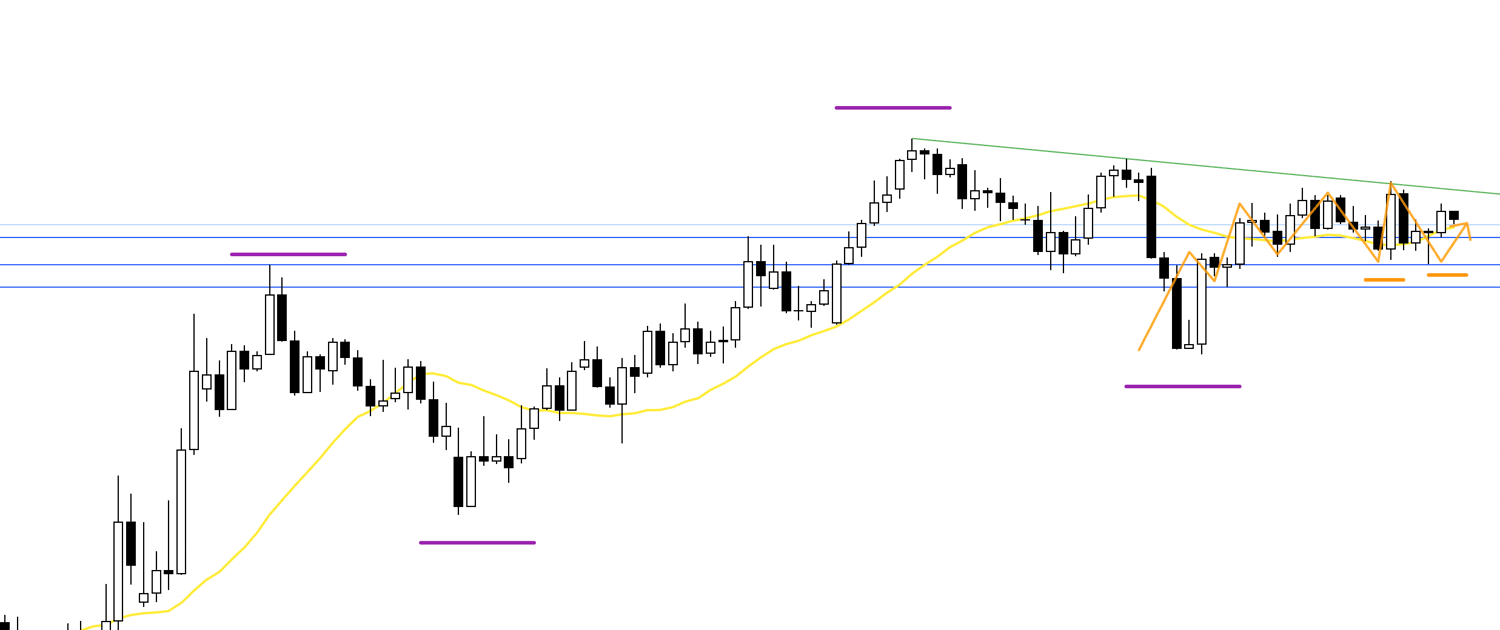
On the daily, as drawn in orange, price had just turned into an uptrend and looked ready to continue higher, but it is now showing some choppy behavior, caught between the downward-sloping green trendline and weekly dip-buying flows.
At the moment, price is attempting to rise again after forming a double bottom supported near the weekly dip-buy area and lifting the lows.
Let’s look at the 4h.
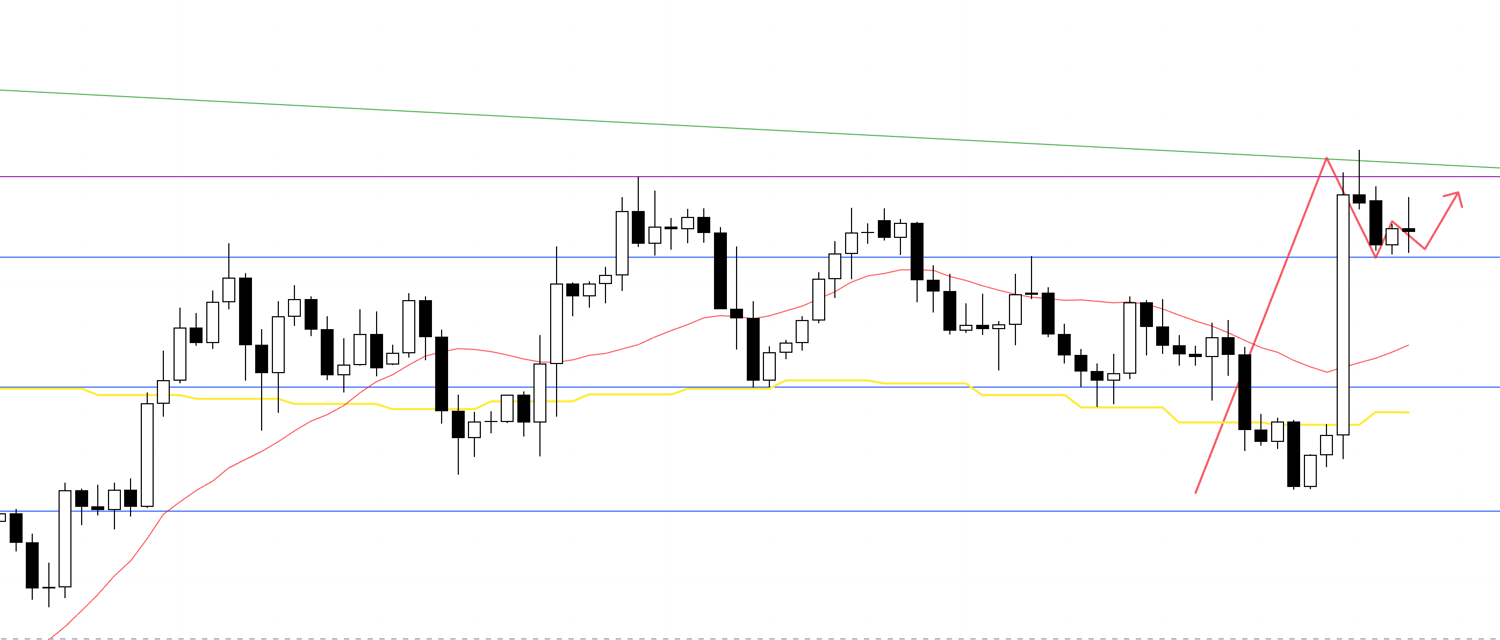
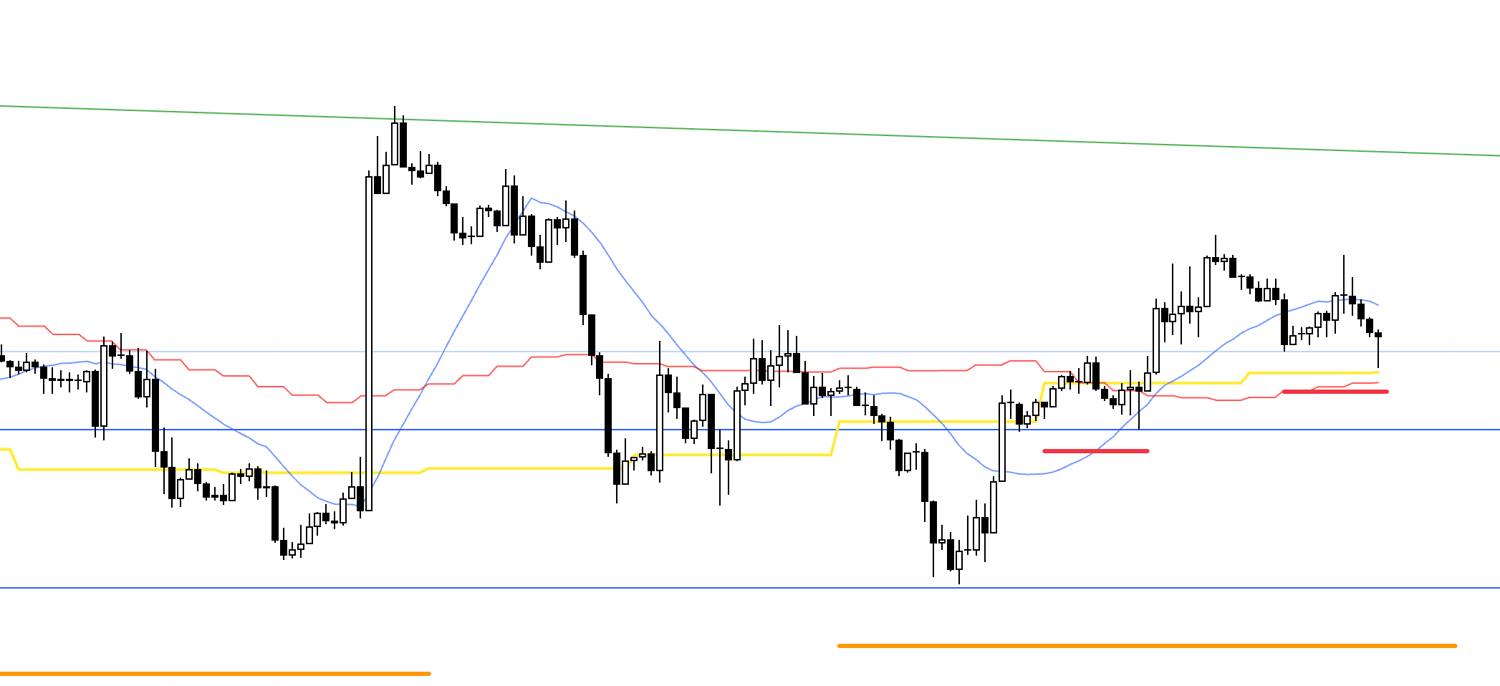
4h
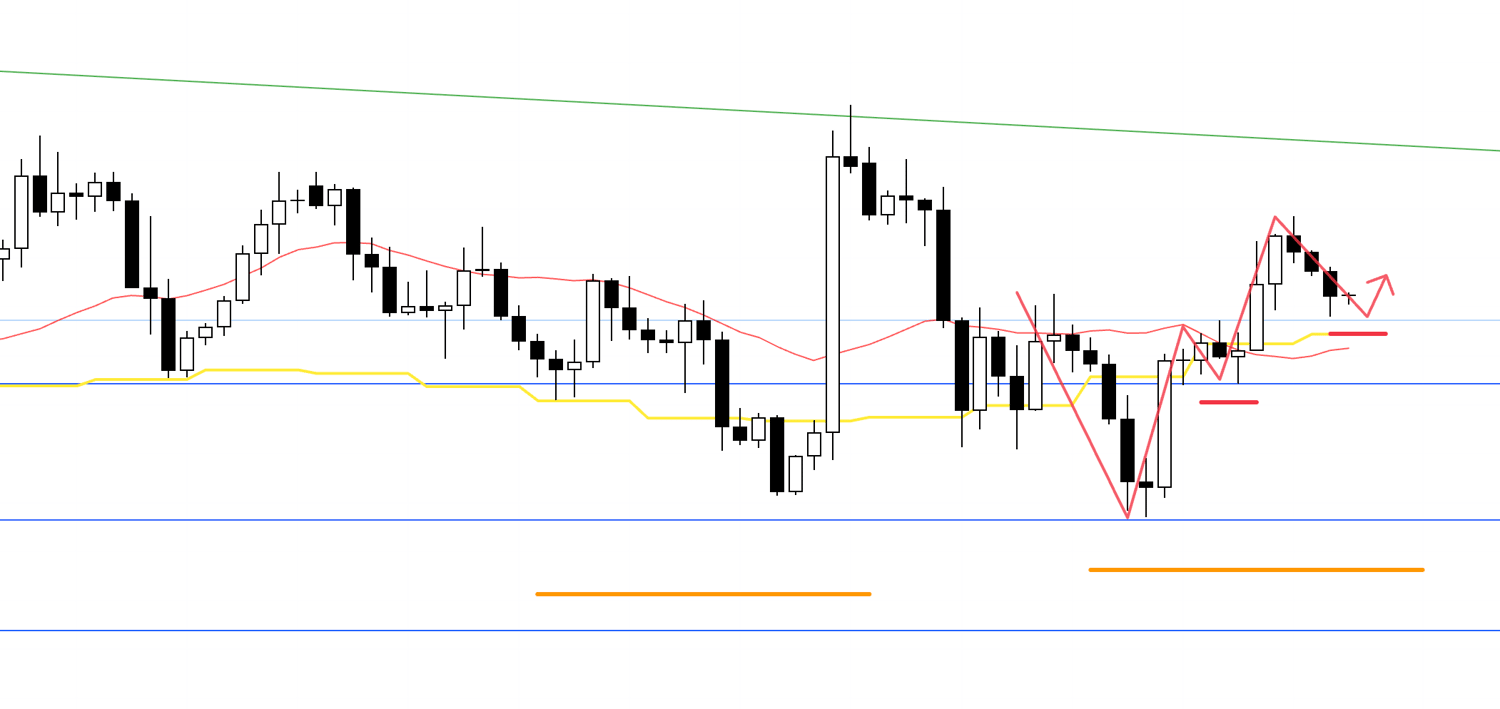
On the 4h, price is making higher highs while lifting the lows, so it is in an uptrend and currently forming a pullback.
If that pullback finds clean support along the line drawn from the prior high (the light blue line), I want to follow an advance on the lower timeframes that fills the distance up to the green trendline overhead.
Now let’s go further down to the 1h.
1h
On the 1h, the uptrend has broken, but this is the decline forming the 4h pullback, so I would like to trade the first point where the 1h turns back up.
In other words, the next higher-low.
Price is also below the moving averages right now, so as sketched on the chart, I want to see it reclaim the moving averages, then form a new higher-low, and time an entry on an even lower timeframe.
1h
After that, the 1h lows were neatly supported, which ordinarily would be a very clean entry.
However, the Core PCE Price Index was due shortly after, and I do not open new positions right before a news event, so I decided to wait and see whether an entry would set up after the release.
For reference, here is the current 15m as well.
15m
On the 15m, price carved a new higher-low and an entry would be on the break of the high formed during that process.
The news event is in about two hours, so if an entry trigger appears before that, I will not take the trade.
If a chance appears afterward, I will take it.
1h
Subsequently, the 1h low was broken, so the higher-low failed to form and I canceled this trade for now.
〜・〜・〜・〜・〜・〜・〜・〜・〜・〜・〜・〜・〜・〜・
That was the real-time record of my pre-entry process.
Let’s revisit the points where an EURUSD entry could have been considered this week on the 1h chart.
1h
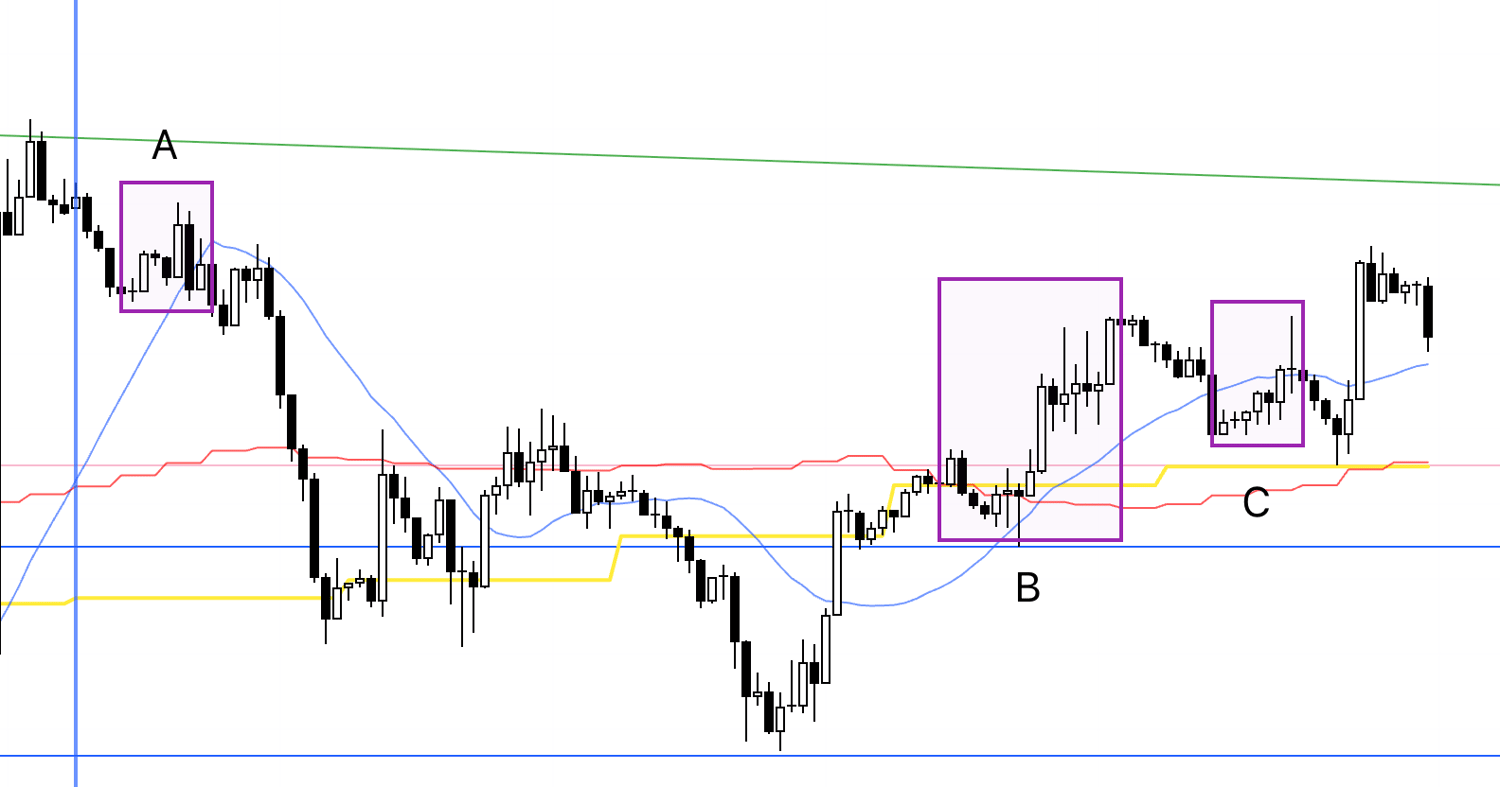
In the end, after the order at C was canceled, price advanced, but it did so without lifting the lows and simply broke the highs, which is not a move my approach can capture.
It is not helpful to think “I could have traded it if I had broken my rules.”
If you start eroding consistency by focusing on a single trade in isolation, you lose the strategy’s edge.
An edge is extracted by repeating the same behavior, so in such cases it is important to accept that the move was not for my playbook and wait for the next opportunity.
Next is point B, but I did not record that one in real time, so there are no screenshots.
The lows were cleanly supported, so this was a place where a trade could be taken near support, but if I were to trade it I preferred the 15m.
The reason is that GDP was scheduled right after this, and there was not enough time left before the release to trade a 1h breakout as a 1h trend-follow setup, and I do not open new positions ahead of news events, so considering the limited time I judged that a 15m entry could be appropriate if it set up.
However, on the 15m price shot higher without forming higher lows, so there was no entry.
Again, it is not necessary to look back at the result and think “I could have traded it if I had ignored the rules.”
It is important to wait for the next opportunity.
〜・〜・〜・〜・〜・〜・〜・〜・〜・〜・〜・〜・〜・〜・
That is all.
For the second week in a row, it turned out to be a week without trades.
USDJPY is currently stuck in a daily range and not moving, and that naturally makes other currency pairs influenced by it harder to trade as well.
We cannot control the market, and we must be willing to wait as long as it takes until valid trade opportunities appear.
No one knows when the range will break, and there is no need to predict it.
All you need is a plan for what to do when it breaks, and the patience to wait.
I am sorry that, as in the prior week, I cannot walk through an actual trade this week, but this is not a place to boast about my winning trades.
I see it as a place for you to reference the consistent process from scenario construction to execution, so there is no point in claiming I took trades I did not take, and it would be meaningless.
If something important comes through by sharing this “do nothing” process, I would be glad.
In this report, published every Saturday, I summarize the real-time thought process behind the trades I actually took during the week, including entry, stop, and take-profit decisions.
From next week in September onward, this Weekly Trading Report will be offered as subscription-only paid content on X, with video and other additions to make it a much richer product, so please take this opportunity to experience my thinking in real time.
These materials are provided solely for educational purposes.
They do not constitute instructions to buy or sell, nor do they guarantee future profits.
You are solely responsible for any trades you make, so invest the time to build and test your own strategy, and trade at your own risk.
I hope my consistent trading helps inform your own consistency.