

Hello.
Here are my trade scenarios for the coming week.
I post this “Trade Scenarios” blog every Sunday.
On Saturdays, I also publish a “Weekly Trade Report,” where I review how I actually thought and traded throughout the week.
Starting in September, the Saturday “Weekly Trade Report” will become a subscription-only feature on X, offering richer content including videos.
By reading both the Trade Scenarios and the Weekly Report together, you can see how I prepare in advance, what I wait for, and how I execute, giving you a practical view of a consistent, real-world process.
For my strategy, please also see my blogs on Dow Theory and multi-timeframe analysis.
A scenario is not a forecast.
It is not a prediction, but rather my personal plan: “If this happens, then I’ll do this.”
I do not predict markets, and this content should not be taken as such.
Nor is this meant to give you trade signals or instructions to buy or sell.
It does not guarantee future profits.
It is provided for educational purposes, showing how I maintain a consistent process.
I cannot take responsibility for the outcome of your trades, so please always trade at your own risk.
Let’s start with USDJPY.
(On my charts, orange lines mark daily price action, red for 4H, blue for 1H, and green for 15m.)
〜・〜・〜・〜・〜・〜・〜・〜・〜・〜・〜・〜・〜・〜・
USDJPY
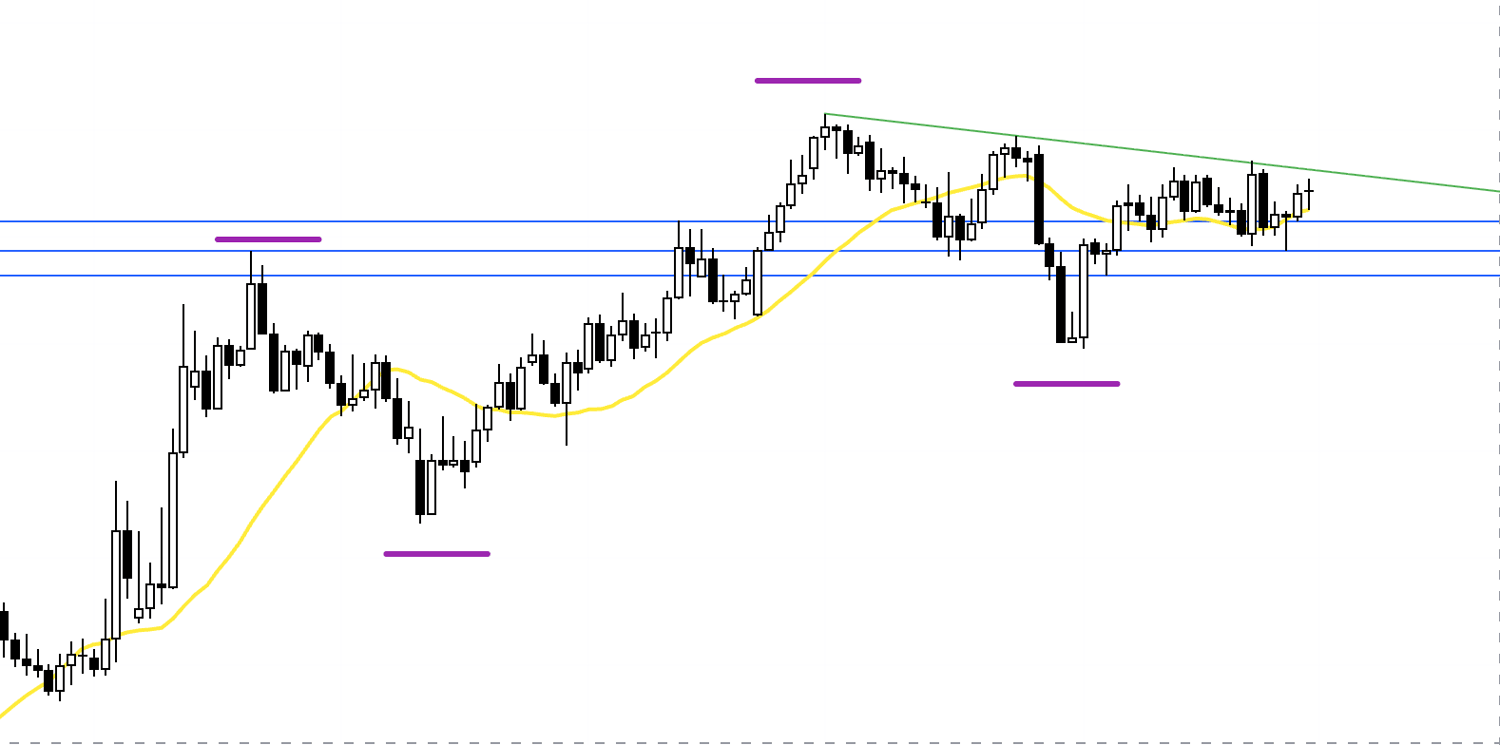
Daily

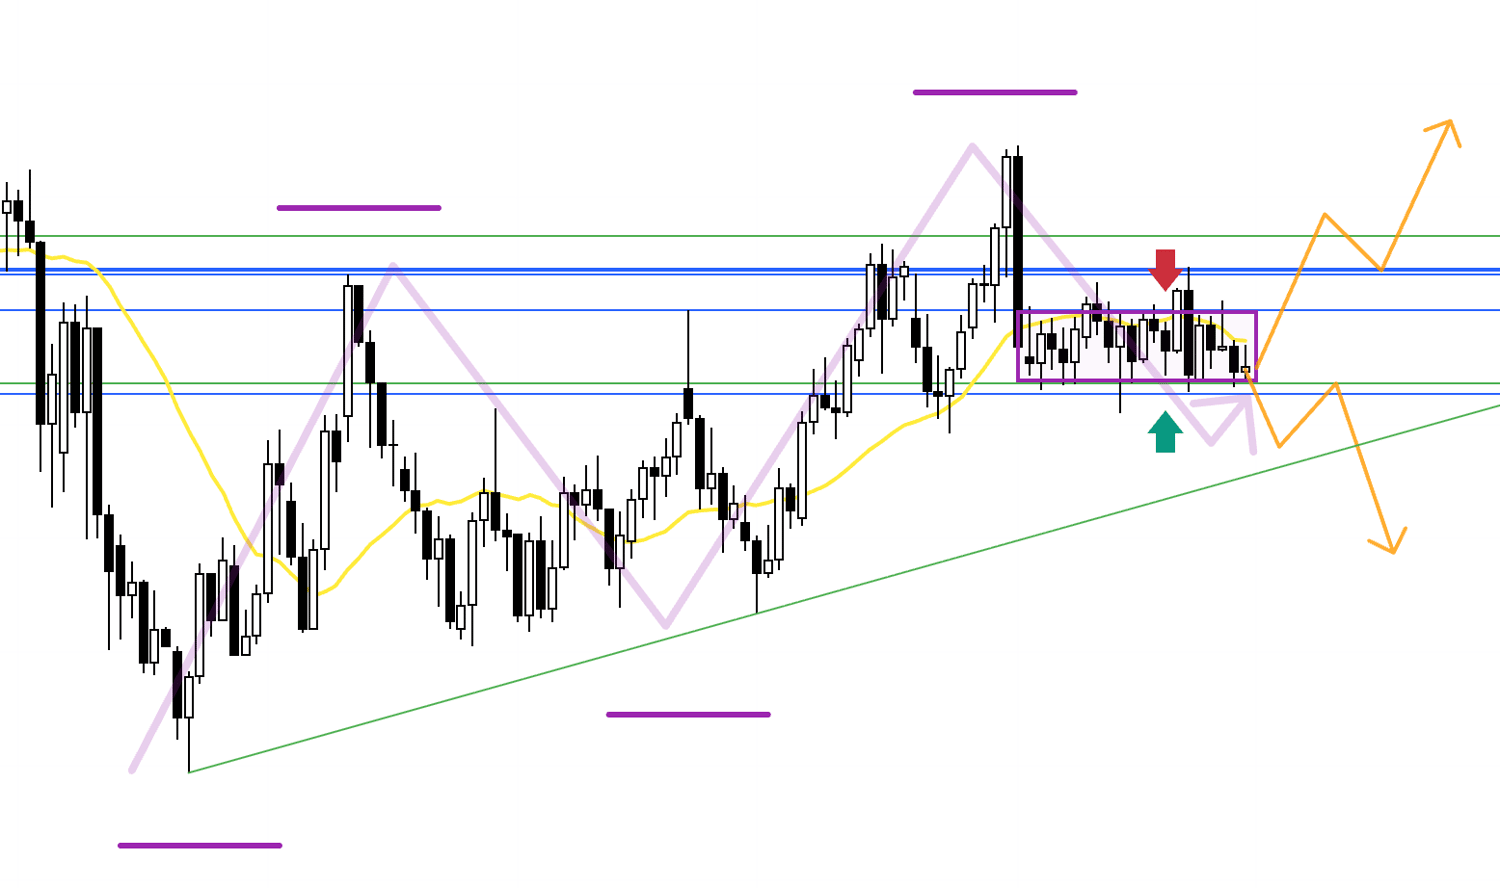
Looking at the daily chart, as noted since the week before last, price is ranging inside the purple box.
This is still an undecided area, with buyers and sellers in balance.
I’ve overlaid the weekly trend in purple lines.
From the weekly perspective, we are in an uptrend, currently in a pullback area.
However, on the daily, price has broken below the moving averages and is being capped by the resistance line above, which has proven effective before, making it heavy to the upside.
In such a stalemate, the basic strategy is to wait for a breakout of the range before considering trades.
As the orange arrows show, I want to wait for a breakout and then look for retests: buying if supported, selling if rejected.
On the sell side, though, we still face the risk of the weekly pullback area, so I also need to consider elements like the green trendline drawn here.
Now let’s move to the 4H chart.
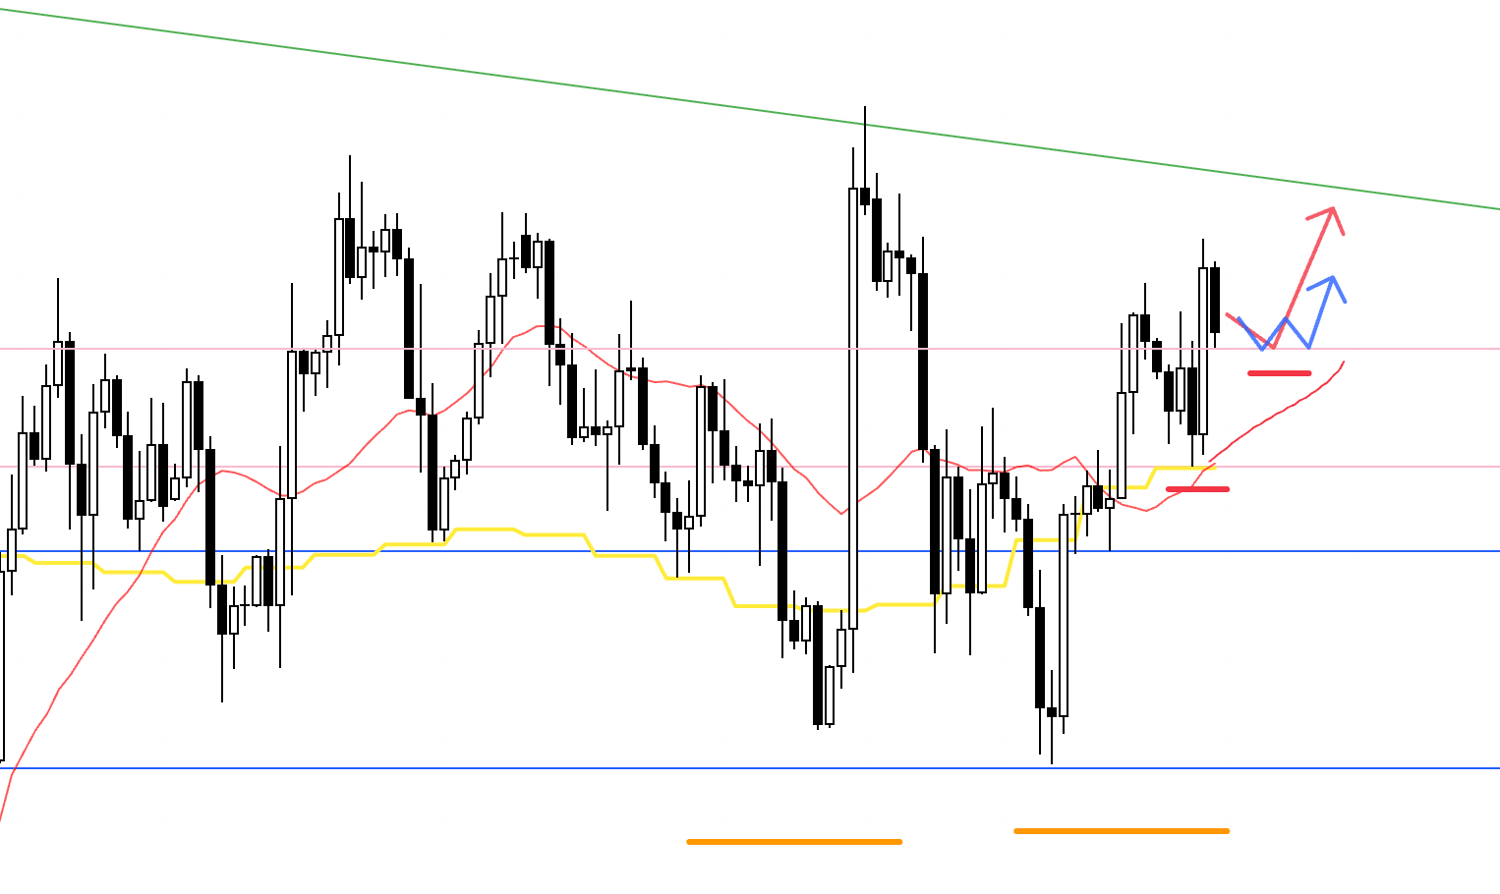
4H
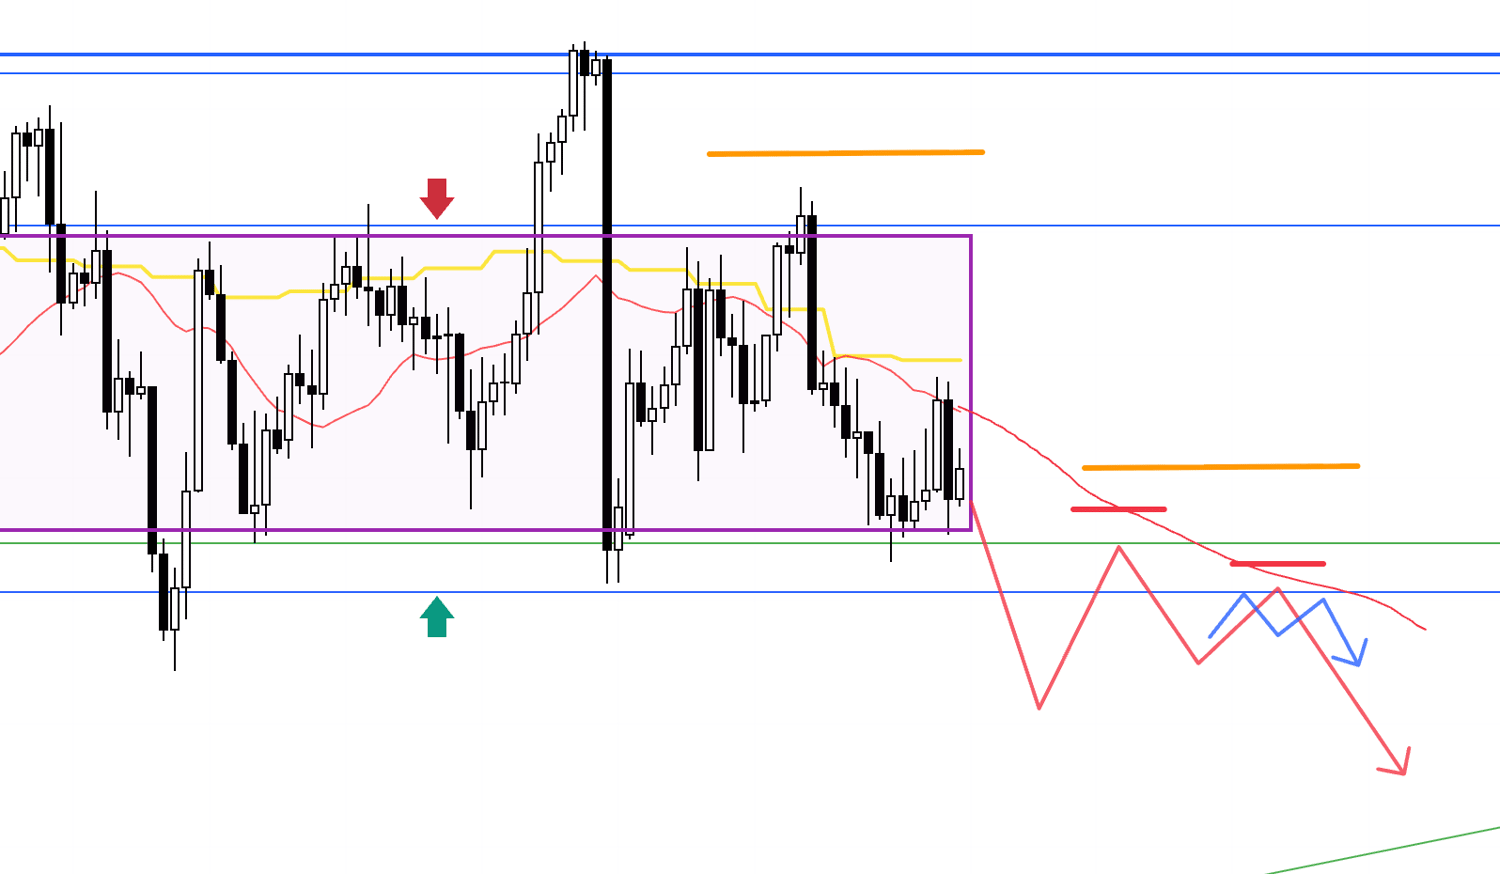
If price breaks below support, then retests that line as resistance while forming lower highs, I would consider entries on the lower timeframes.
In this case, the key will be whether there is enough room to the trendline drawn from the weekly chart to justify the risk-reward.
Managing risk could mean, for example, taking partial profits at that trendline.
4H
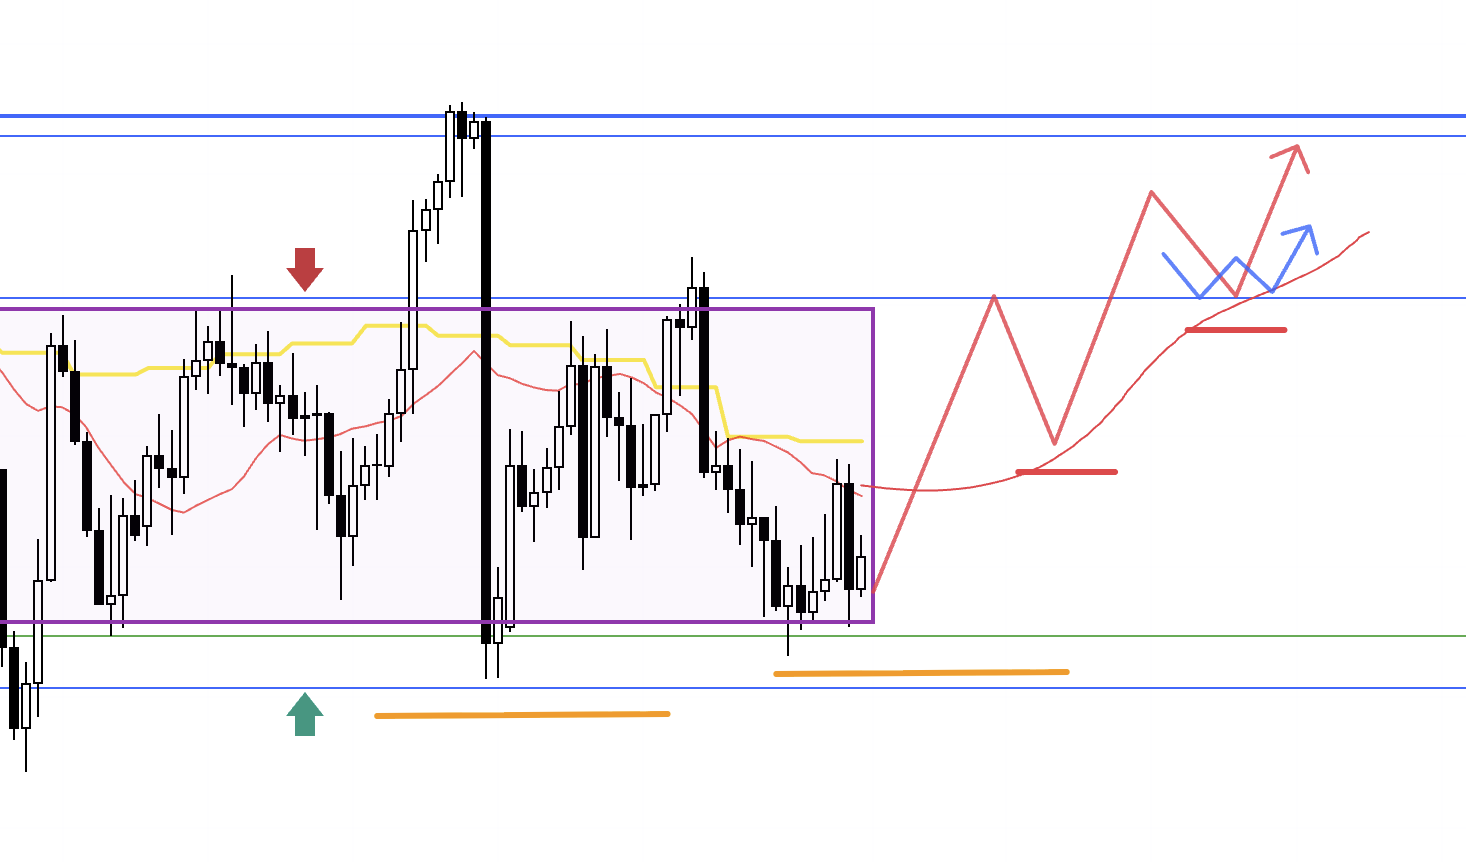
On the buy side, just like the sell, I want to see price break out of the range first, then test prior resistance as new support, showing higher lows.
Then I would look for entry timing on the lower timeframes.
But as this chart shows, there is another strong resistance immediately above the range, so the key is whether I can enter close enough to the support line to secure favorable risk-reward.
If those conditions aren’t met, I would wait until price breaks above the next higher resistance.
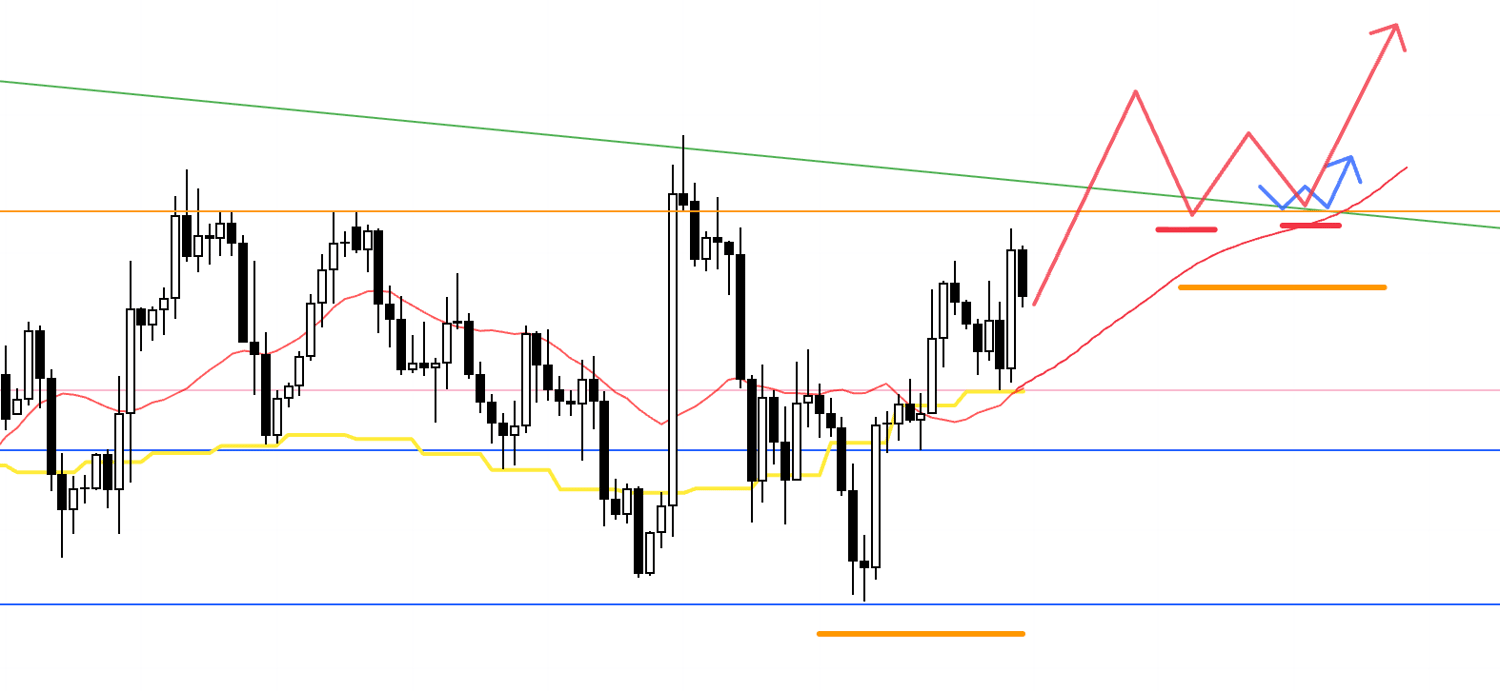
4H
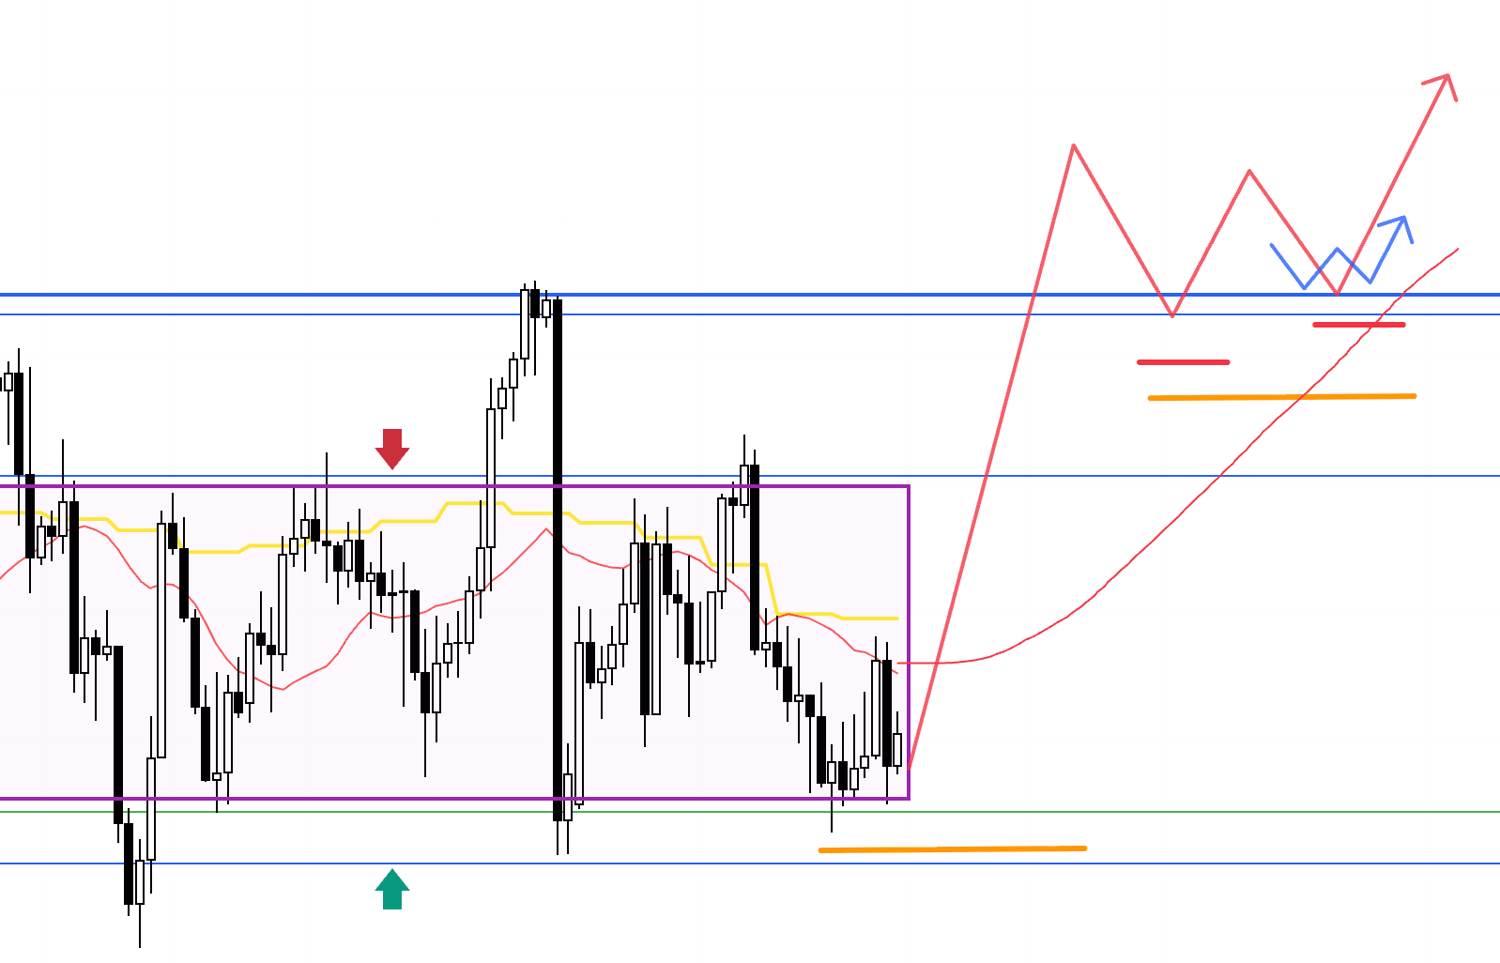
If that higher resistance turns into support, showing higher lows, I would again look for entries on the lower timeframes.
Regardless of the path price takes, for USDJPY the main point is to wait and see which way the range breaks.
This week brings major news events like NFP, so the USDJPY range may finally resolve.
But as traders, our job is not to predict which way.
It doesn’t matter which way it breaks—we simply prepare our “if this, then that” plans, wait, and trade only when advantage emerges.
Now let’s look at EURUSD.
〜・〜・〜・〜・〜・〜・〜・〜・〜・〜・〜・〜・〜・〜・
EURUSD
Daily
On this daily chart, the weekly trend is shown in purple.
The weekly is making higher highs and higher lows, so this is a pullback-buy zone on that timeframe.
However, price is capped by the descending green trendline, leaving upside heavy.
On the sell side, the horizontal blue line may serve as a strong weekly pullback-buy level, so caution is needed.
Now let’s move to the 4H chart.
4H
The 4H is making higher highs and higher lows, forming new pullbacks.
If the lower timeframes confirm an uptrend, I would consider longs.
But the key will be how much room remains to the green trendline above, and whether entry points align with acceptable risk-reward.
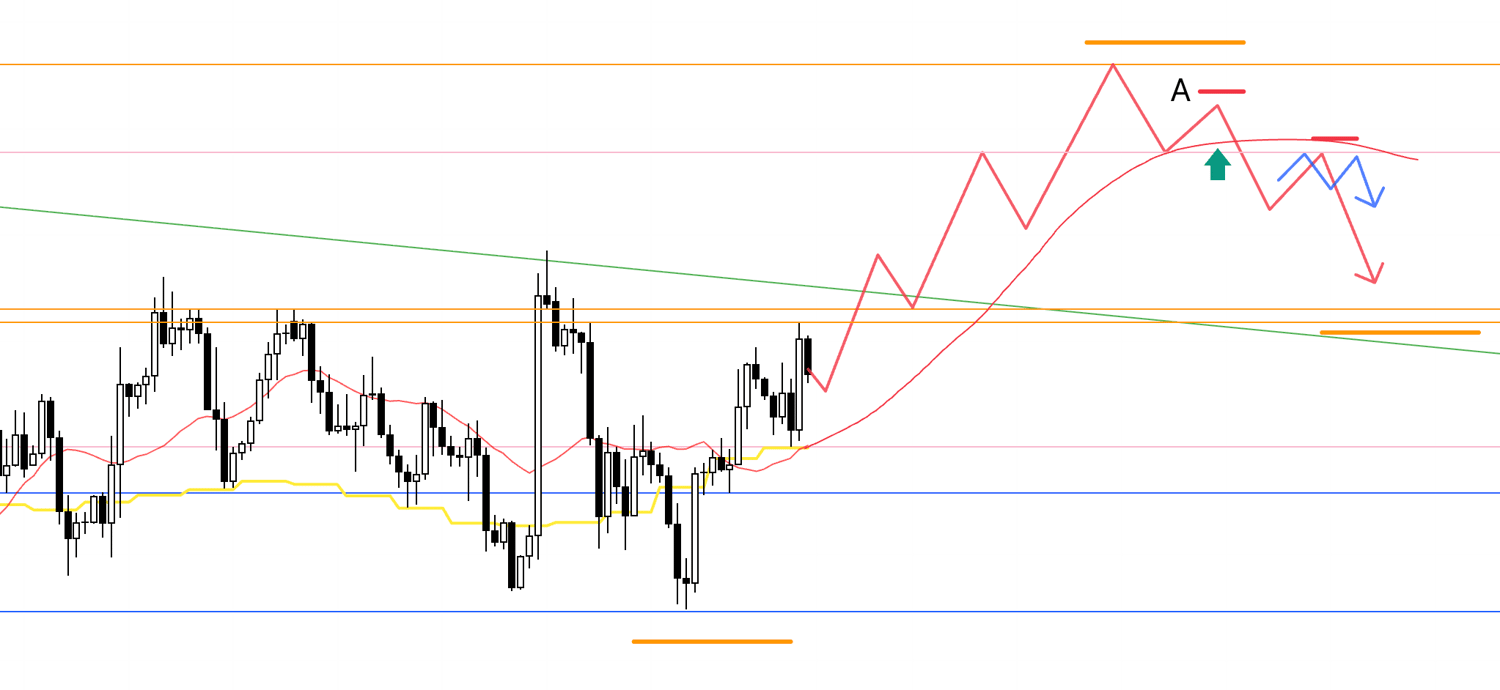
4H
Alternatively, if price breaks above that trendline and then forms higher lows while retesting it as support, I would consider entry on lower timeframes.
4H
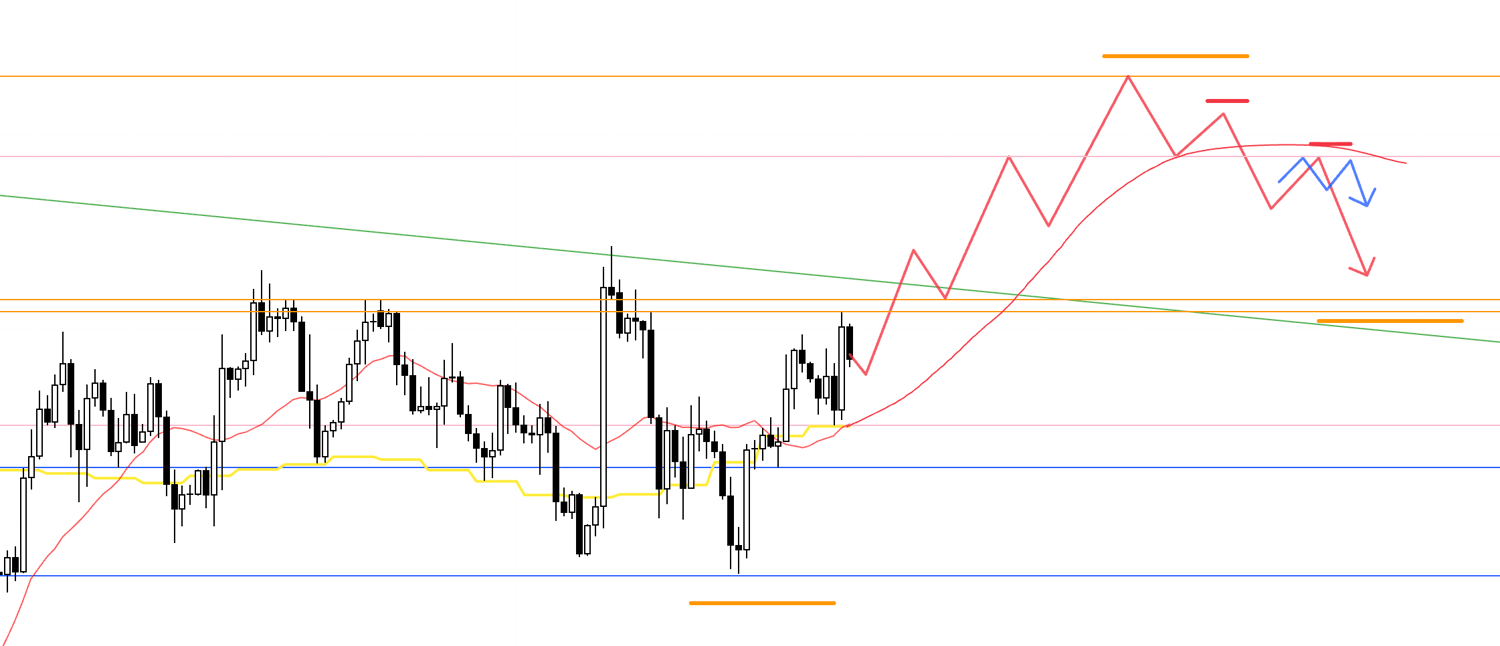
If price then turns lower—for example, capped by the previous weekly high (orange horizontal)—I would trade the 4H downtrend, taking advantage of profit-taking flows from the prior uptrend.
But because this would be a daily pullback in an uptrend, the deeper it falls, the stronger the risk of buyers stepping in.
That must be considered.
4H
Point A, the prior lower-high zone, still has the MAs supporting from below, making it an easy place for buyers to step in.
So for shorts, I would want to see a clean break below the MAs and rejection from above.
If price does show that rejection, I would consider selling at A.
4H
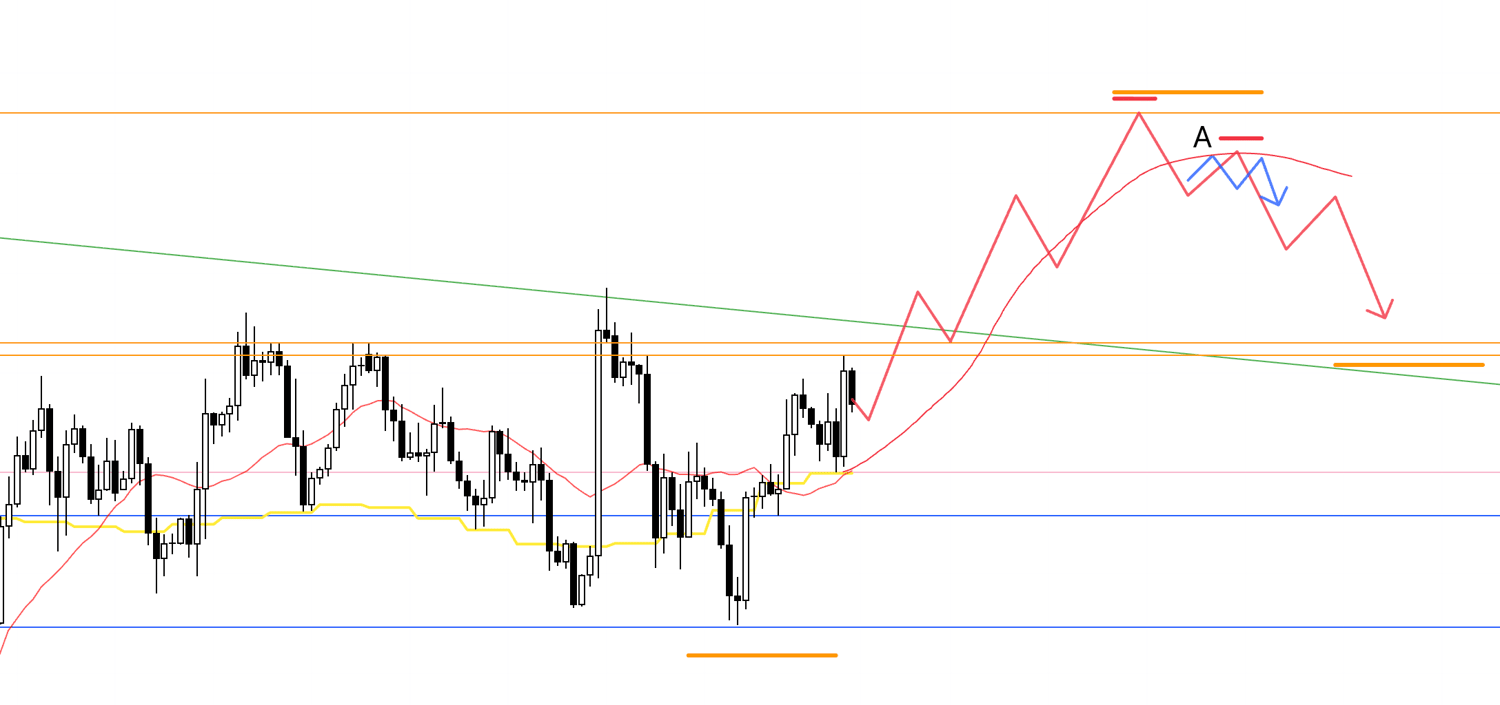
Whether this acts as a valid lower high depends greatly on its relation to the MAs.
Selling directly into a strong buy zone is very unfavorable.
4H
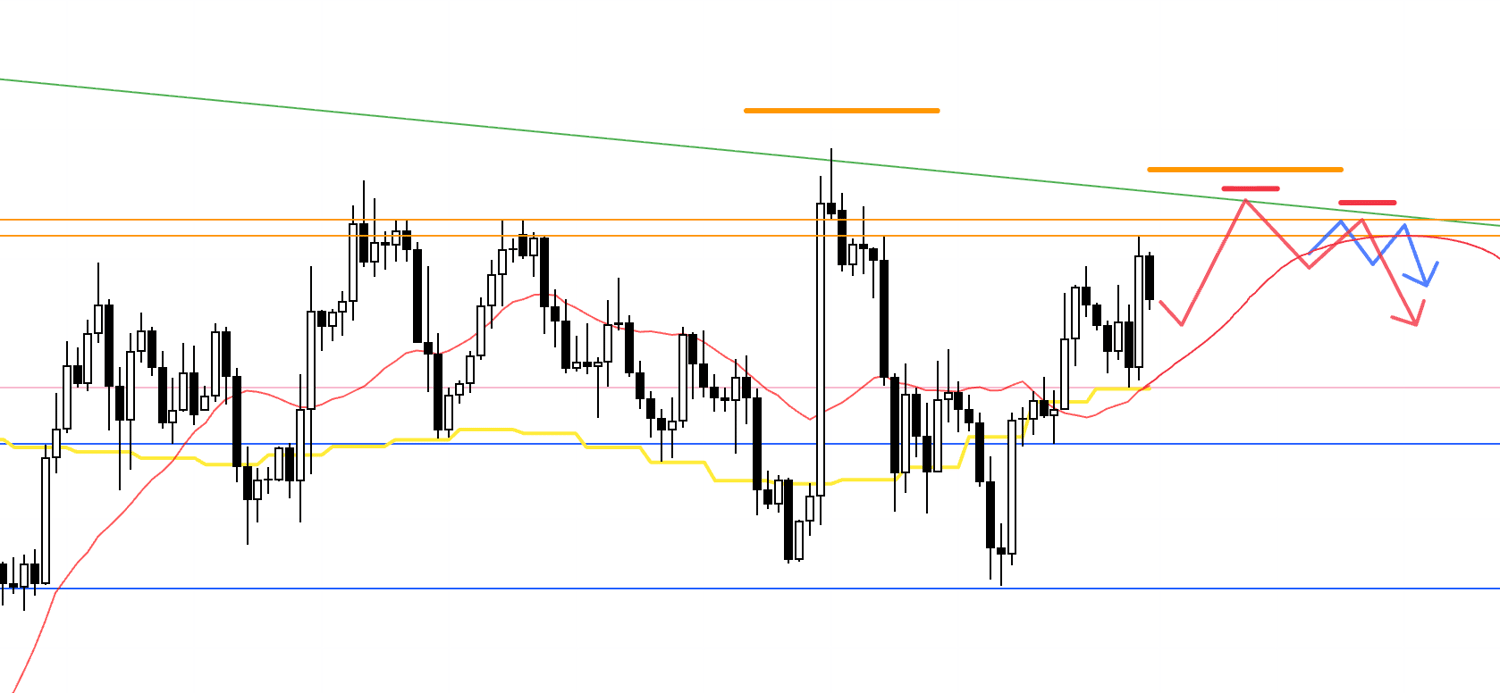
If price fails to break the green trendline, forms a double bottom on the daily, and shows lower highs on the 4H, I’d look for trades on the lower timeframes while monitoring the MAs.
But note the blue support lines below—these are strong buy zones on both the daily and weekly, so the key will be whether entries can be made from higher levels with proper risk-reward.
4H
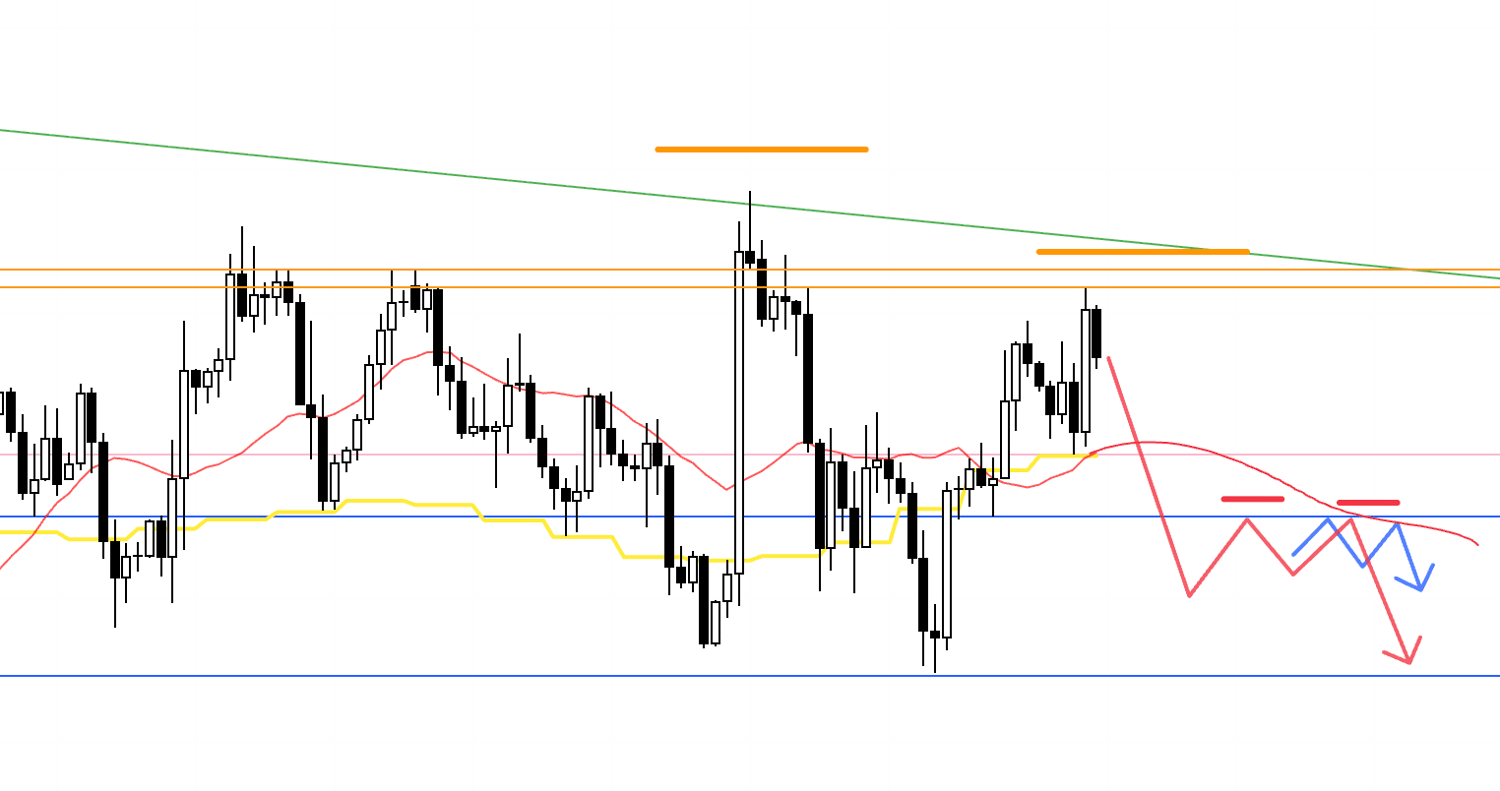
If price breaks below the blue support line that marks the start of the current 4H uptrend, and then forms lower highs with that line acting as resistance, I would consider shorts.
Again, the key will be whether risk-reward makes sense, given this is still a weekly pullback-buy area.
〜・〜・〜・〜・〜・〜・〜・〜・〜・〜・〜・〜・〜・〜・
That concludes this week’s scenarios.
These are my plans at the moment, but I will adapt and rebuild them as the week unfolds and price action evolves.
For USDJPY, as noted since two weeks ago, the daily chart remains in range.
The point is not to predict the breakout direction.
The point is to have plans ready for either outcome, wait, and execute.
I don’t care which way the market breaks.
I am prepared for both.
What matters is identifying where risks lie through multi-timeframe analysis, recognizing where advantage emerges, waiting patiently, and trading only at those points.
This week brings many news events, so the USDJPY range may finally resolve.
On the other hand, weeks with heavy news often offer fewer trading opportunities, so it’s uncertain whether I’ll actually be able to trade much at all.
You must not let thoughts like:
“I haven’t traded in this range lately, I want to trade soon.”
“If I don’t trade now, I won’t make money.”
push you into impatience.
The timing of when trading opportunities appear is not something a trader can control.
What matters is the discipline to simply wait until the right moment comes.
I hope this provides some value.
This is only my personal trading plan.
If you are still developing your own style, perhaps it may serve as a reference for building strategy.
But if you already have your own approach, please do not let my plan distract you from following your own rules.
Thank you for reading to the end.