


In this report I will review the key points of my trading this week, focusing on the actual trades I took.
This Weekly Trade Report is published every Saturday.
When you read it together with Trade Scenarios, which I post every Sunday, I believe it will give you a useful reference for how I think in advance and how I actually execute trades based on those scenarios.
This is not advice saying “you should trade like this,” nor am I claiming that this is the correct answer.
It is not about showcasing individual winning or losing trades, nor is it about recommending a specific strategy based on those results.
My purpose is to show, at a practical level, how I repeatedly follow a consistent process based on pre-defined scenarios, and to offer that as a reference for your own strategy building and for achieving consistency in your process.
The outcomes I show are nothing more than my personal results, and they do not guarantee your future profits.
Please keep that firmly in mind, and when it comes to your own trading, make sure you carry out your own testing and preparation, and trade entirely under your own responsibility.
My trading is based on buying pullbacks and selling rallies on the 4h timeframe.
If you are interested in my pullback and rally strategy, please read my past blog posts on Dow Theory and multi-timeframe analysis.
Now, please take a look at the following charts.
USDJPY 4h
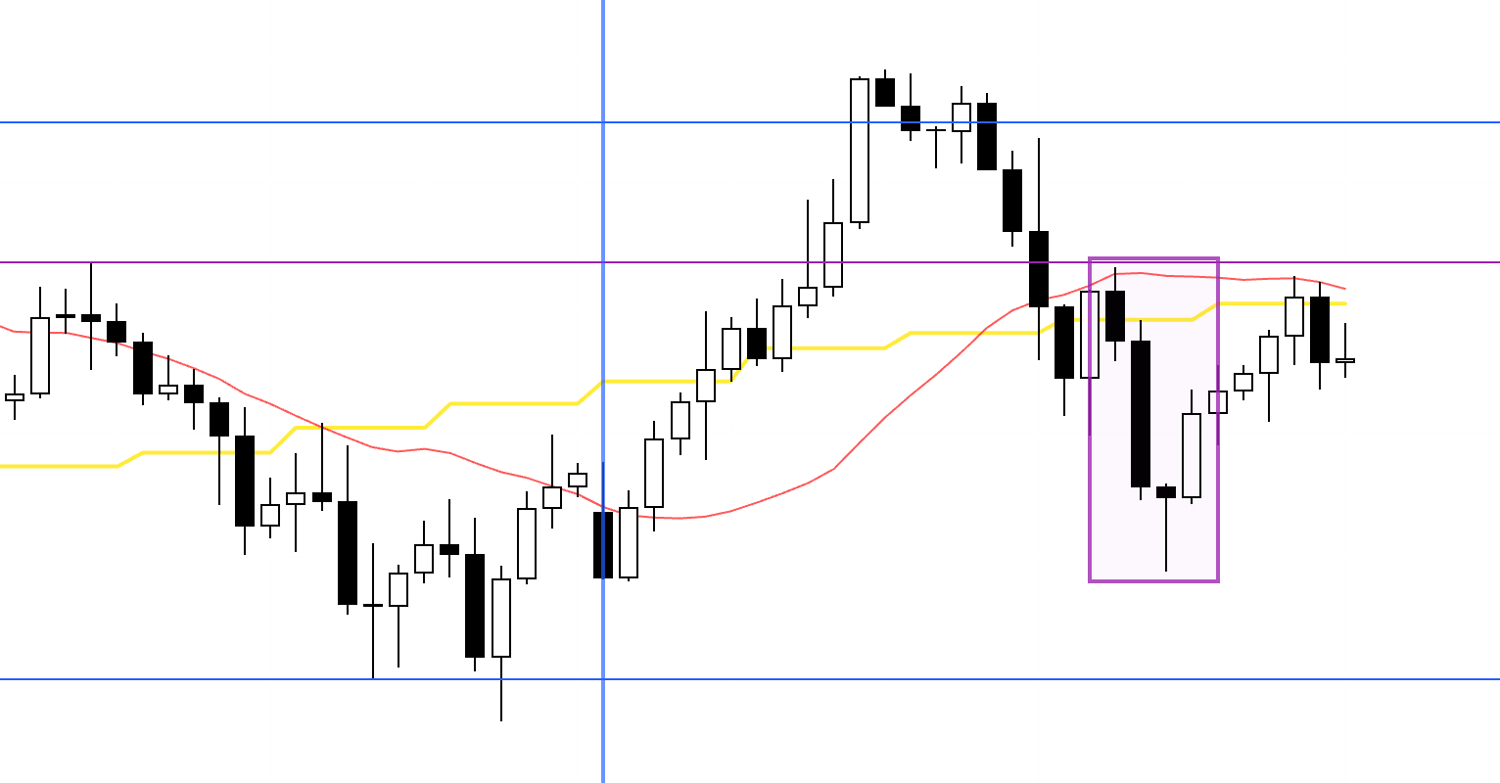
This is the 4h chart of USDJPY.
This week's price action is the section from the blue vertical line on the chart onward.
There were no tradable setups in USDJPY this week.
There was a potential short setup at the boxed area, but because it was right before an economic data release, I do not open new positions immediately before such events, so I did not take the trade.
Next, please take a look at the EURUSD chart below.
EURUSD 4h
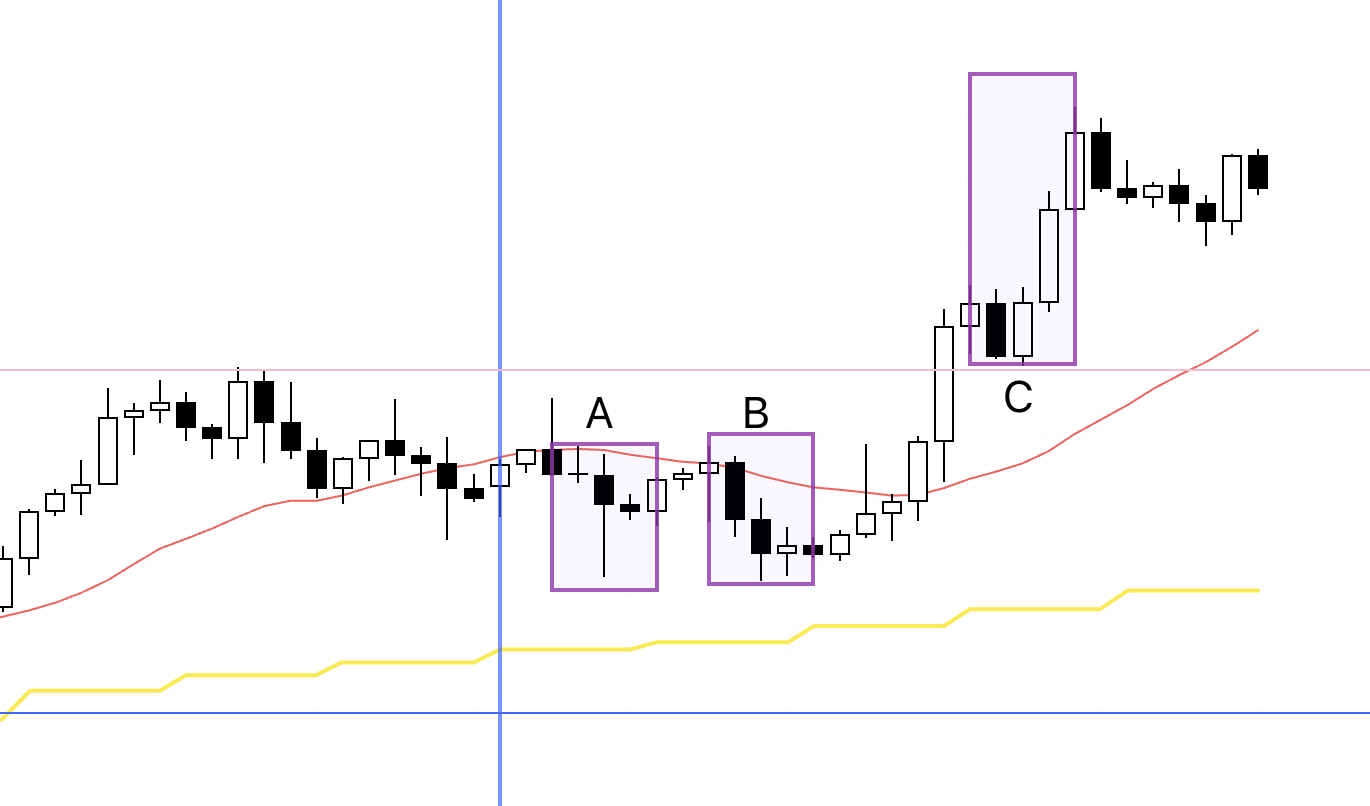
This is the 4h chart of EURUSD.
There were three areas where I considered taking trades in EURUSD, but the only one I actually traded this week was point A.
B and C would have been clean pullback short and dip-buy levels on the 4h, but on the 1h the conditions were not met, so I passed on both.
1h
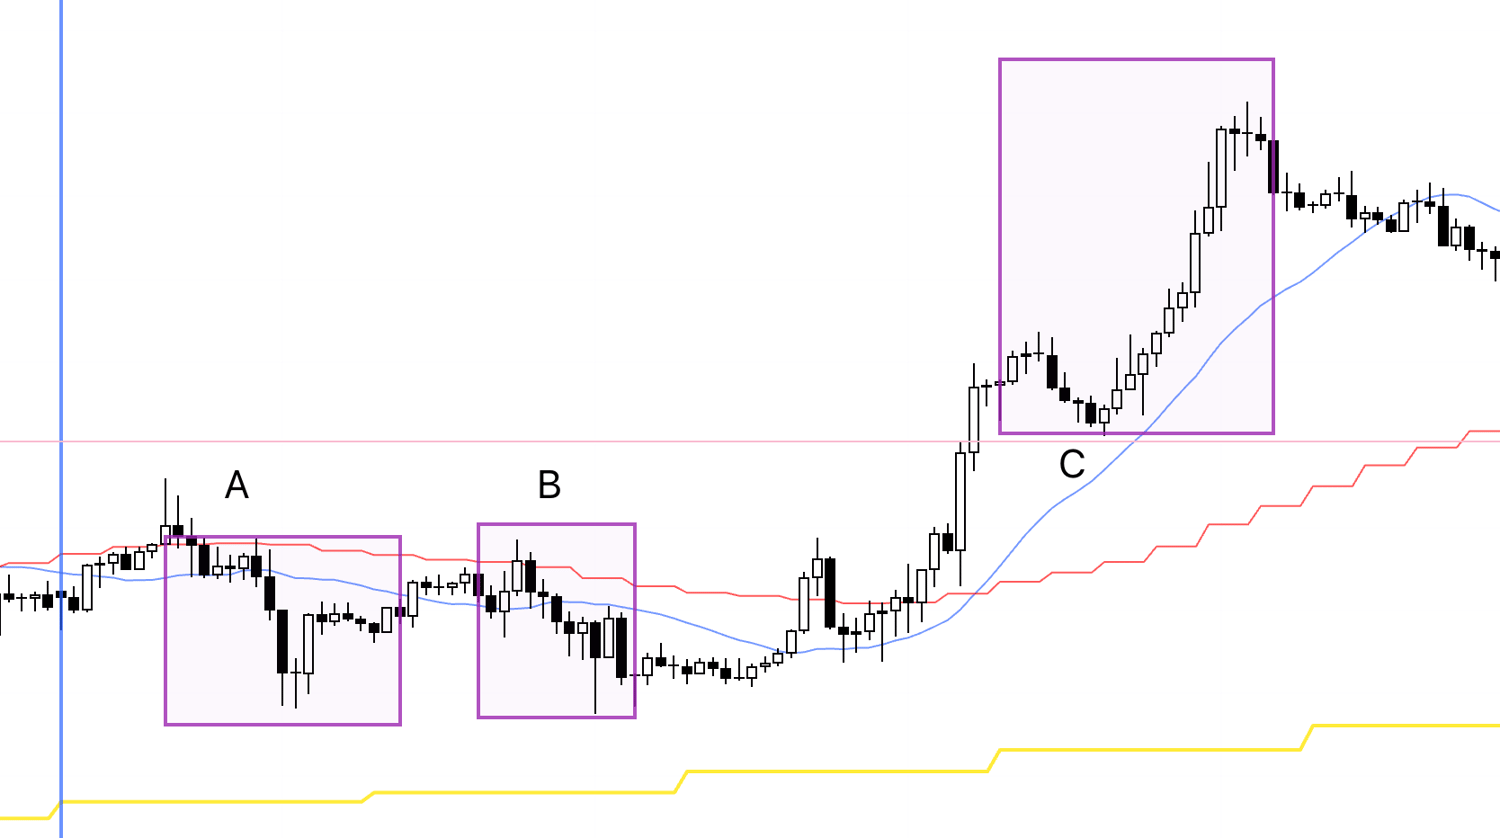
On the 1h chart, it looks like this.
At B, price made a new low without putting in a lower high first, so I could not enter there.
As for C, by the time price reached that area on the 1h, it had already extended one leg higher.
I basically do not enter on the 1h in the middle of such an advance.
If I were to trade it, I would wait for the 1h uptrend to break once and then look for the start of a new uptrend, but this time price just kept climbing, so I was not able to trade it.
Looking back now, C has indeed moved higher, so many people tend to think things like "I couldn't enter" or "I should have taken it".
But as I just explained, in that moment the chart was not in a structure that allowed an entry, so that would have been a "trade you must not take".
This is a crucial point, so please do not get it wrong.
Traders are never told the result in advance and must always trade based only on the information in front of them.
If, in that moment, the chart does not meet your entry criteria, then it is a "trade you must not take".
By contrast, A was a short plan I had laid out in my Sunday scenario, and I traded it exactly according to that scenario.
I will explain that below.
So below I will break down the trade I took this week, while sharing my real-time notes from those moments.
December 8 (Mon)
EURUSD
4h chart from the scenario blog

In Sunday’s scenario blog, I was looking at a plan to search for shorts on the lower timeframes within the 4h lower-high area.
On the daily, the trend is still up, so this downswing is a pullback within the daily uptrend, and the deeper it falls, the greater the risk that buy-side pressure will build.
4h
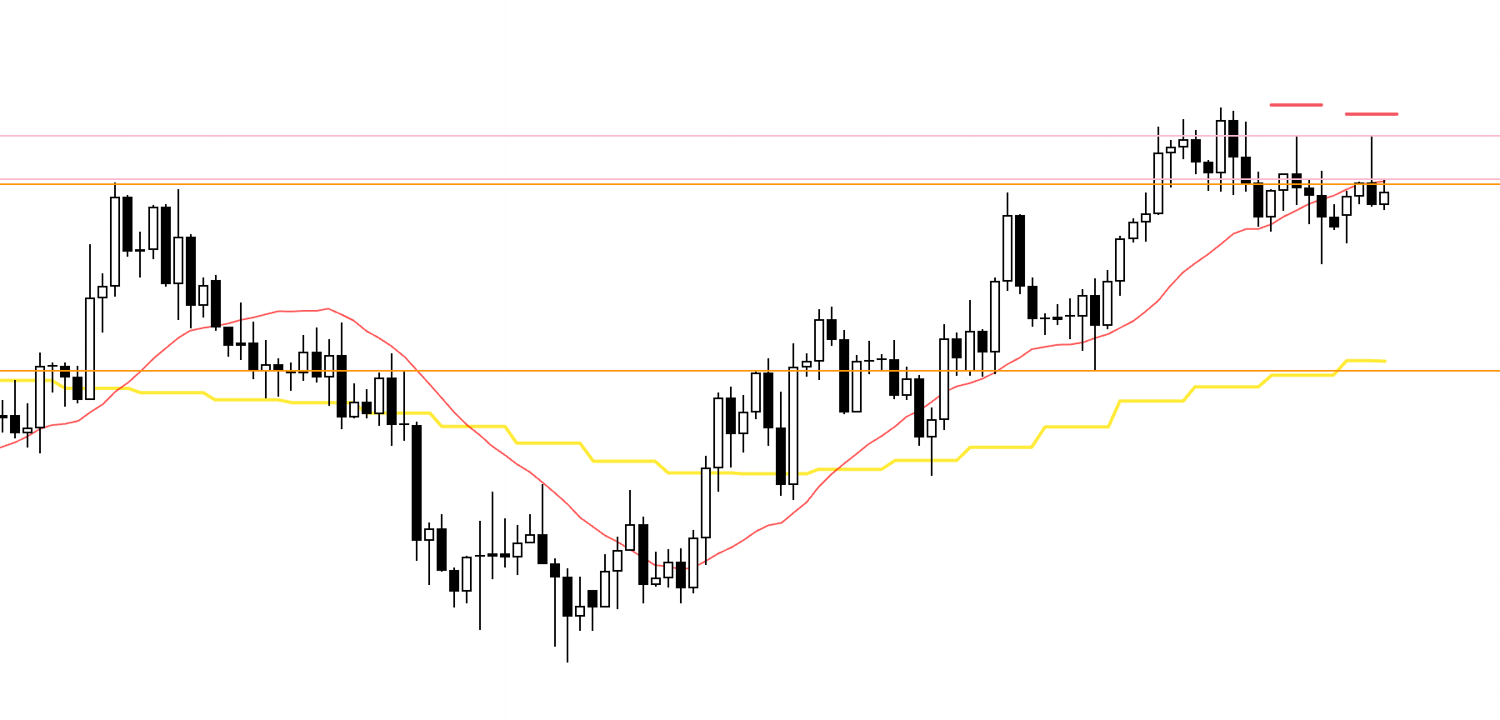
On the 4h, price is forming a double top and starting to show lower highs.
Next I look at the 1h, and on the 1h it is clear that the highs are being capped by the orange line, so I am considering shorts.
1h

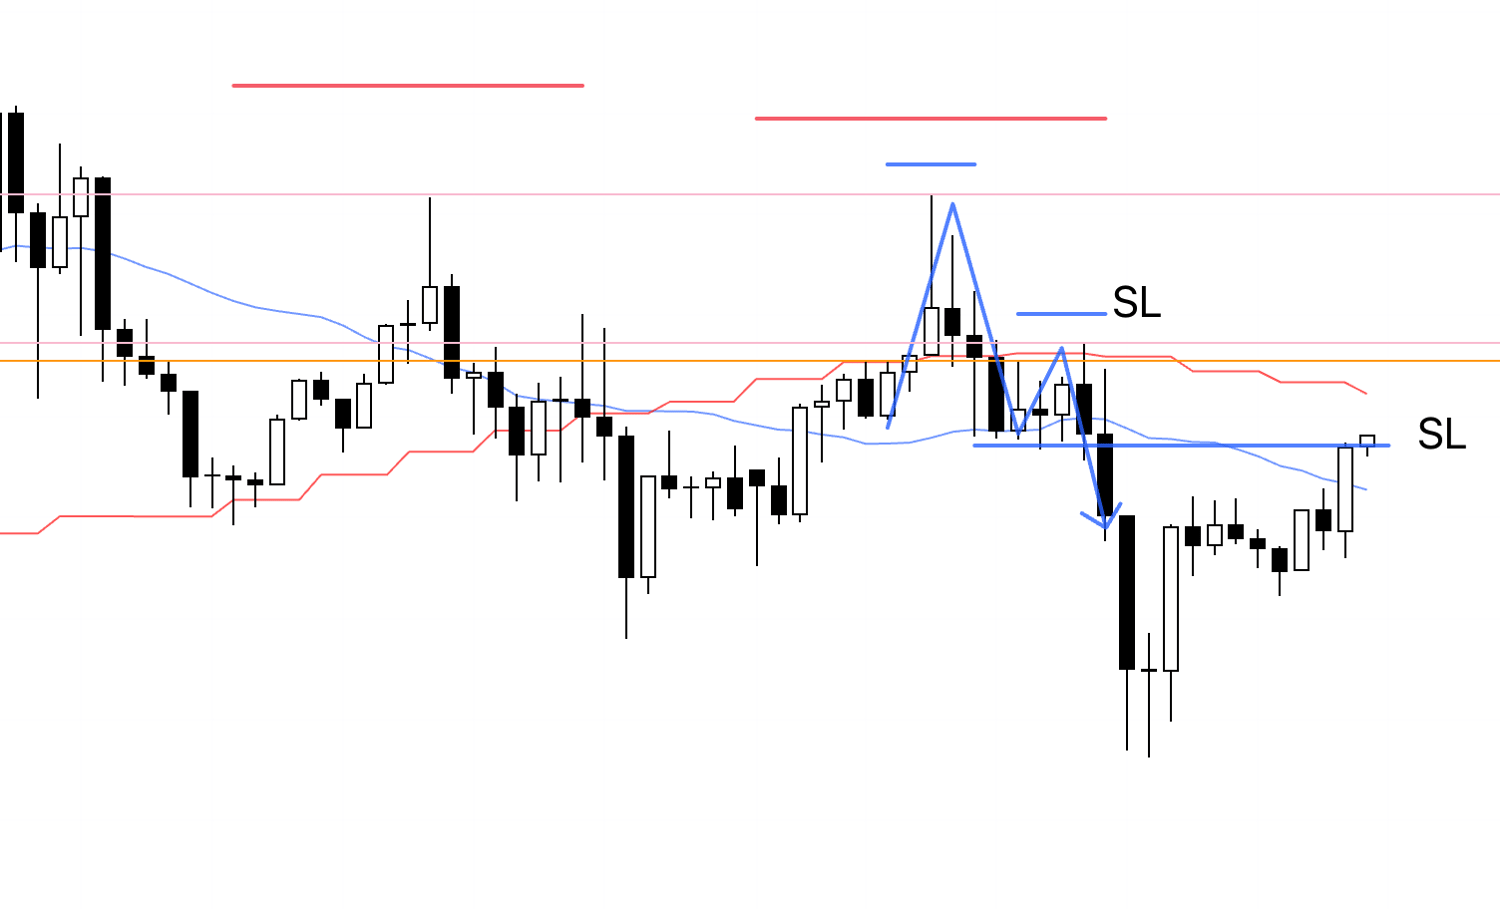
On the 1h, within that 4h lower-high area, the 1h is also forming its own lower-high structure.
These highs are being capped by the orange line, so if price now breaks the low, a temporary edge to the downside will emerge, and this is definitely a place where I want to be short.
1h

The pending stop order I had placed gets hit, and I am now in the trade.
I will hold the position until the trend on the 1h breaks.
As I wrote in Sunday’s scenario, this downswing is a pullback within the daily uptrend, so the more it falls, the more buy-side pressure is likely to build up.
This is not a trade I can sit in for a long time.
If price reaches just in front of the lower orange line, I plan to take profit on half of the position.
1h

I have not moved the stop-loss yet.
I will go to bed with the position as it is.
1h

After waking up, I lowered the stop-loss slightly.
1h
Price then hits the trailing stop I had moved down, and that brings this trade to an end.
That is all.
This week I only had this one trade in EURUSD.
As I wrote at the beginning, you must not trade at points where, according to your own rules, you do not have an entry.
Even if, looking back, that level went on to produce a large move, that is nothing more than hindsight.
In the moment, no one knows that the future will unfold that way, so all you can do is follow your rules, and if you start questioning those rules based on a single isolated outcome, the large-sample testing you did beforehand becomes meaningless.
A trader cannot control the number of entries they get.
All you can do is wait, patiently and relentlessly, for situations that match your rules.
It is totally normal for the trade you finally take after a long wait to end in a loss, and it is equally normal for those losses to come in a streak.
That is not an abnormal situation but merely outcome dispersion created by randomness.
All of that must already be factored in when you test your approach over a large sample size, and what remains after you incorporate it is your positive expectancy.
"Building positive expectancy" simply means continuing to follow those tested rules, and you must be able to regard even the losses that occur within them as part of your edge.
This does not just apply to losses, but also to "trades you skipped in accordance with your rules".
The very act of sticking to your rules is your positive expectancy.
Once you really understand this, you will stop using phrases like "learning from losses".
If you correctly understand that even losses incurred while following your rules carry positive expectancy, then there is no lesson there that you need to learn.
What you truly need to learn from is the fact that you are trading "in a way that still leaves lessons to be learned" and that you are not prepared and cannot follow your rules.
Many people misunderstand the phrase "learning from failure" as "learning from losses", but "loss = failure" is not true.
How you define failure drastically changes the nature of this game.
You need to move from a win-or-lose game to a probabilistic game and actually embody that in your trading.
Aiming for that and ultimately embodying it in practice is what makes someone a true professional on this path.
Thank you for reading to the end.
I hope this blog can provide hints for those who are about to build their strategy and for those who are struggling because they cannot achieve consistency.
If this blog was helpful, my book will take your probabilistic thinking to the next level.
📚 Get your copy here👇